You can collect logs from Java applications running in your ACK cluster and write them to Simple Log Service (SLS) without modifying your application code. To do this, configure the LogHub Log4j Appender in your workload YAML file so that logs are sent directly to an SLS project.
Log4j is an open-source logging framework maintained by Apache and designed for Java applications. Its core components include Appenders (output targets), Layouts (output formats), and Filters. By configuring Appenders, you can route logs to different destinations, such as the console, files, or external services.
Prerequisites
An AccessKey pair is created for integrating the Log4j Appender in the application.
To protect your account, we recommend that you use a Resource Access Management (RAM) user instead of your Alibaba Cloud account and create the AccessKey pair for the RAM user.
Step 1: Configure the Log4j Appender in SLS
In this step, you create an SLS project and a Logstore, and then configure the Logstore data source as a Log4j Appender. This allows your Java application to send logs directly to SLS.
We recommend that you create the SLS project in the same region as your ACK cluster. This routes log data over the internal network, which avoids external bandwidth costs and reduces latency.
For more information about SLS project billing, see Billing overview.
Create an SLS project.
The following describes the key parameters. You can keep the default values for other parameters. For more information, see Manage a project.
Region: Select the same region as your ACK cluster. In this example, China (Hangzhou) is selected.
Project Name: Enter a project name. In this example, k8s-log4j is used.
Create a Logstore in the project.
In this example, the Logstore Name is k8s-logstore and other parameters use default values. For more information, see Manage a logstore.
After k8s-logstore is created, follow the on-screen prompts to access data.
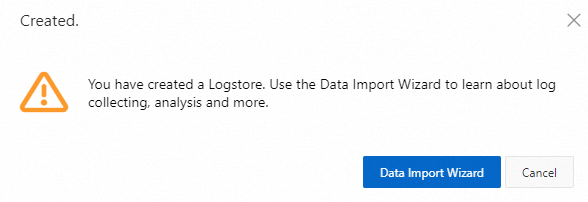
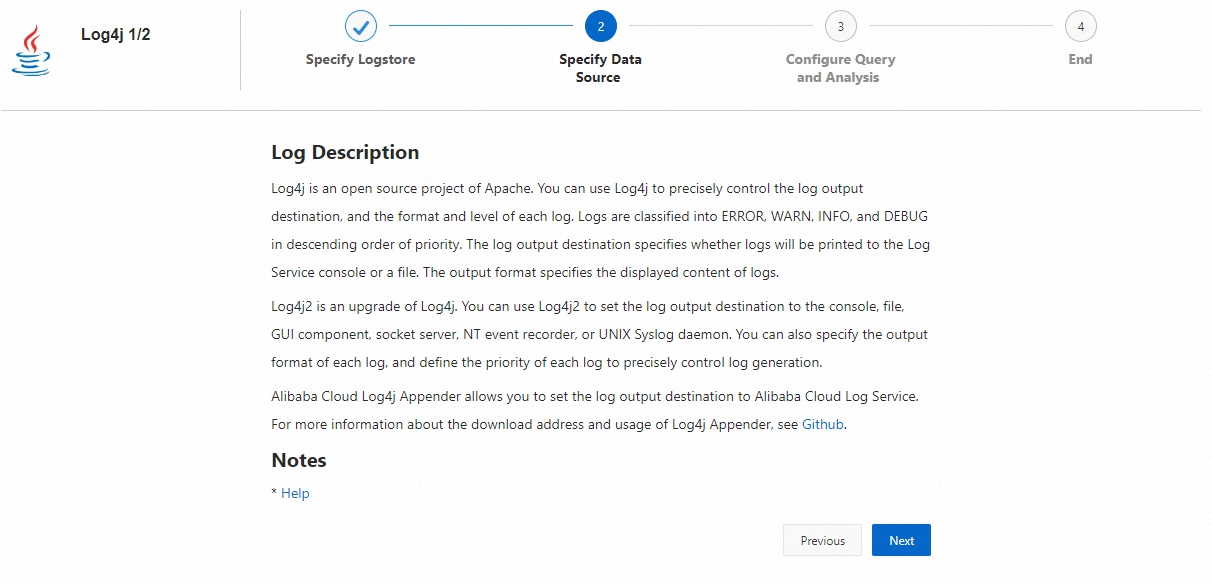
Find the Log4j access card and follow the prompts to complete the data access configuration.
In this example, the default configuration is used. You can adjust the settings based on your log data usage scenarios.
Step 2: Integrate Log4j in your application
This step walks you through integrating the Log4j Appender into a Java application by deploying a Spring Boot sample application. After integration, the container passes SLS configuration through the JAVA_OPTS environment variable at startup. Log4j reads these parameters and sends logs to SLS in real time.
Obtain the demo-deployment.yaml file and configure the
JAVA_OPTSenvironment variable.For the file source, see demo-deployment.
The following table describes the
JAVA_OPTSparameters:ImportantReplace the placeholder values in the YAML file with your actual SLS project name, Logstore name, endpoint, AccessKey ID, and AccessKey secret before deploying.
Parameter Description Example value -DprojectThe SLS project name. k8s-log4j -DlogstoreThe SLS Logstore name. k8s-logstore -DendpointThe SLS service endpoint. Set this value based on the region of your project. For more information, see Endpoints. cn-hangzhou.log.aliyuncs.com -Daccess_key_idYour AccessKey ID. N/A -Daccess_keyYour AccessKey secret. N/A Create the Deployment.
kubectl create -f demo-deployment.yamlObtain the demo-Service.yaml file. You can keep the default configuration.
For the file source, see demo-Service.
Deploy the demo-Service.yaml file to create a Service.
kubectl create -f demo-service.yaml
Step 3: Test log collection
After the Deployment and Service are deployed, you can verify that logs are written to SLS by accessing the service through its external IP address.
Get the
EXTERNAL-IPof the Service.kubectl get svcExpected output:
NAME                                  TYPE           CLUSTER-IP     EXTERNAL-IP      PORT(S)          AGE
log4j-appender-demo-spring-boot-svc   LoadBalancer   172.21.XX.XX   120.55.XXX.XXX   8080:30398/TCP   1h
Run the
logincommand to generate a test log entry.Replace
K8S_SERVICE_IPwith theEXTERNAL-IPvalue from the previous step.curl http://${K8S_SERVICE_IP}:8080/login?name=bruceYou can view the complete API collection in GitHub log4j-appender-demo.
Step 4: View logs in the SLS console
You can log on to the SLS console to query and analyze the collected logs.
Log on to the Simple Log Service console.
In the Projects section, click the target project to open the project details page.
Click the
 icon to the right of the Logstore and select Search & Analysis to view the logs collected from your cluster.