By Niu Tong (Qiwei)
This article focuses on the various log collection solutions provided by Serverless Application Engine (SAE) as well as related architectures and scenarios.
Log is important to a program no matter if it is used for troubleshooting, recording key node information, early warning, or configuring monitoring dashboards. It contains important content that every application needs to record and view. Log collection in the cloud-native era is different from traditional log collection in the collection solutions and the collection architectures. We have summarized some common problems that we often encounter during log collection, such as:
The disk size for applications deployed in Kubernetes will be much lower than that of physical machines. Not all logs can be stored for a long time, but there is a demand to query historical data.
Log data is critical and cannot be lost, even after the application is restarted, and the instance is rebuilt.
Users hope to log some keywords, other information alarms, and the monitoring dashboard.
Permission control is very strict. You cannot use or query log systems (such as SLS). You need to import it to your log collection system.
The exception stacks of JAVA, PHP, and other applications will be line wrapped and printed into multiple lines. How can we summarize and view them?
How do users use the log function to collect logs in the production environment? Which collection solution is better in the face of different business scenarios and demands? As a fully managed, O&M-free, and highly elastic PaaS platform, SAE provides multiple collection methods (such as SLS collection, NAS mounting collection, and Kafka collection) for users to use in different scenarios. This article focuses on the features and the best usage scenarios of various log collection methods to help users design appropriate collection architectures and avoid some common problems.
Log collection by SLS is a recommended log collection solution for SAE. It provides one-stop data collection, processing, query and analysis, visualization, alerting, consumption, and delivery capabilities.
SAE integrates the log collection work of SLS, which allows you to easily collect business logs and container stdout to SLS. The following figure shows the architecture diagram of SAE integrating SLS:
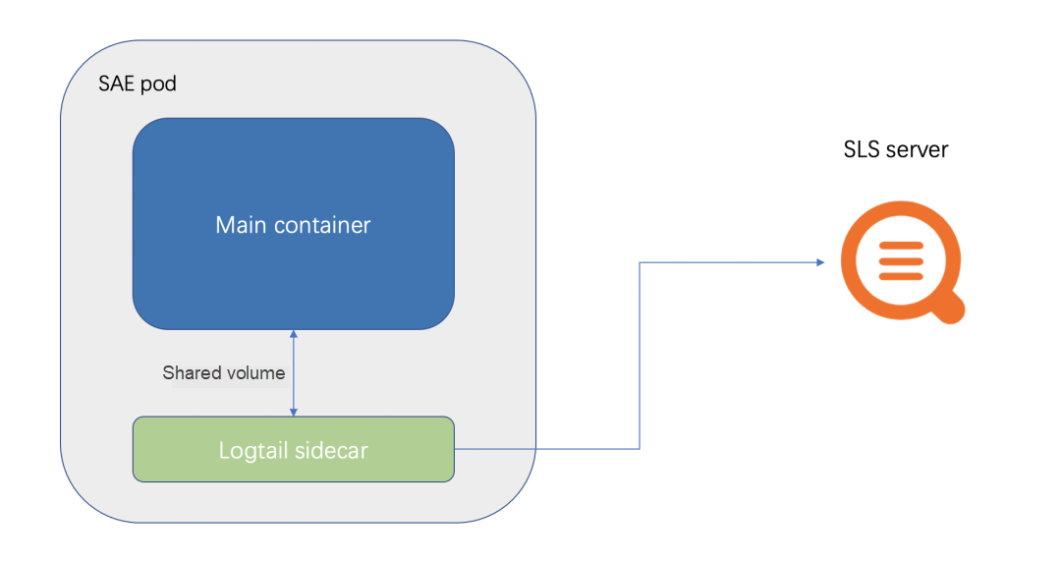
SAE mounts a Logtail (Collector of SLS) sidecar to the pod.
Then, the files or paths configured by the customer to be collected are shared with the service container and the Logtail sidecar in the form of volume. This is also why the /home/admin cannot be configured in the SAE log collection. Since the service startup container is placed in the /home/admin, mounting the volume will overwrite the startup container.
At the same time, Logtail reports data through the internal network address of SLS. Therefore, no public network is required.
In order not to affect the running of service Containers, resource limits are set in the Sidecar collection of SLS. For example, the CPU limit is 0.25C, and the memory limit is 100 MB.
SLS is suitable for most business scenarios and supports configuring alerts and monitoring charts. SLS is the best choice in most scenarios.
NAS is a distributed file system that provides several benefits. These benefits include shared access, scalability, high availability, and high performance. It provides high throughput and high IOPS. It also supports random read/write operations and online modification of files, making it suitable for log scenarios. If you want to store more or larger logs locally, you can mount the NAS file system and point the storage path of the log files to the mount directory of the NAS file system. I will skip mounting NAS to SAE because it does not involve many technical issues and architectures.
When NAS is used as a log collection solution, it can be considered a local disk. Log loss will not occur even in various situations, such as instance crashes and reconstruction. You can consider this solution in very important scenarios where data loss is not allowed.
You can collect log files to Kafka and then consume Kafka data to collect logs. You can import logs from Kafka to Elasticsearch based on your needs or use programs to consume Kafka data for processing.
There are many ways to collect logs to Kafka (such as logstach, lightweight collection component filebeat, and vector). The collection component used by SAE is the vector. The following figure shows the architecture diagram of SAE integrating the vector:
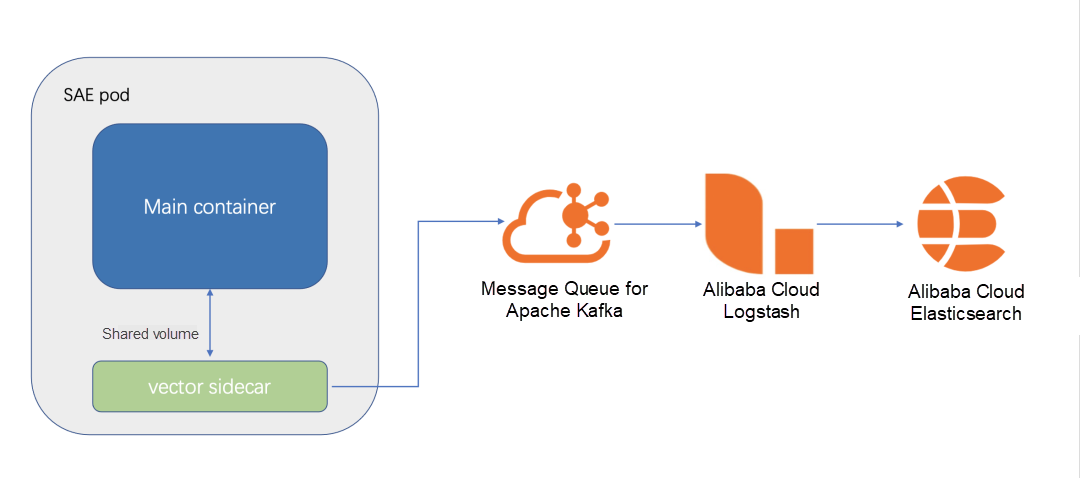
SAE mounts a Logtail (vector collector) sidecar to the pod.
Then, the files or paths configured by the customer to be collected are shared with the service container and the vector sidecar in the form of volume.
The vector sends the collected log data to Kafka at regular intervals. Vector has relatively rich parameter settings, and you can set the collection data compression, data transmission interval, collection indicators, etc.
The Kafka collection is a supplement to the SLS collection. Some customers in the production environment have very strict control over permissions. You may only have SAE permissions but do not have SLS permissions. Therefore, you can choose the Kafka log collection solution if you need to collect logs to Kafka for subsequent viewing or do secondary processing of logs.
The following is a basic vector.toml configuration:
data_dir = "/etc/vector"

[sinks.sae_logs_to_kafka]
type = "kafka"
bootstrap_servers = "kafka_endpoint"
encoding.codec = "json"
encoding.except_fields = ["source_type","timestamp"]
inputs = ["add_tags_0"]
topic = "{{ topic }}"

[sources.sae_logs_0]
type = "file"
read_from = "end"
max_line_bytes = 1048576
max_read_bytes = 1048576
multiline.start_pattern = '^[^\s]'
multiline.mode = "continue_through"
multiline.condition_pattern = '(?m)^[\s|\W].*$|(?m)^(Caused|java|org|com|net).+$|(?m)^\}.*$'
multiline.timeout_ms = 1000
include = ["/sae-stdlog/kafka-select/0.log"]

[transforms.add_tags_0]
type = "remap"
inputs = ["sae_logs_0"]
source = '.topic = "test1"'

[sources.internal_metrics]
scrape_interval_secs = 15
type = "internal_metrics_ext"
[sources.internal_metrics.tags]
host_key = "host"
pid_key = "pid"

[transforms.internal_metrics_filter]
type = "filter"
inputs = [ "internal_metrics"]
condition = '.tags.component_type == "file" || .tags.component_type == "kafka" || starts_with!(.name, "vector")'

[sinks.internal_metrics_to_prom]
type = "prometheus_remote_write"
inputs = [ "internal_metrics_filter"]
endpoint = "prometheus_endpoint"
Analysis of some important parameters:
The multiline.start_pattern is that when the row that conforms to this regular expression is detected, it will be treated as a new piece of data.
The multiline.condition_pattern is that when the row that conforms to this regular expression is detected, it will be merged with the previous row and treated as one.
The following are some monitoring charts of metadata collected by vector configured to Prometheus and metadata collected by vector configured in Grafana's monitoring dashboard:

In actual use, you can choose different log collection methods based on your business requirements. The log collection policy of logback needs to limit the file size and the number of files. Otherwise, it is easier to fill up the disk of the pod. Let’s take JAVA as an example. In the following configuration, a maximum of seven files are retained, each with a maximum size of 100 MB.
    <appender name="TEST"
              class="ch.qos.logback.core.rolling.RollingFileAppender">
        <file>${user.home}/logs/test/test.log</file>
        <rollingPolicy class="ch.qos.logback.core.rolling.FixedWindowRollingPolicy">
            <fileNamePattern>${user.home}/logs/test/test.%i.log</fileNamePattern>
            <minIndex>1</minIndex>
            <maxIndex>7</maxIndex>
        </rollingPolicy>

        <triggeringPolicy
                class="ch.qos.logback.core.rolling.SizeBasedTriggeringPolicy">
            <maxFileSize>100MB</maxFileSize>
        </triggeringPolicy>

        <encoder class="ch.qos.logback.classic.encoder.PatternLayoutEncoder">
            <charset>UTF-8</charset>
            <pattern>%d{yyyy-MM-dd HH:mm:ss}|%msg%n</pattern>
        </encoder>

    </appender>
This configuration of log4j is a common log rotation configuration.
There are two common log rotation methods: one is the create mode, and the other is the copytruncate mode. Different log collection components have different levels of support for these two modes.
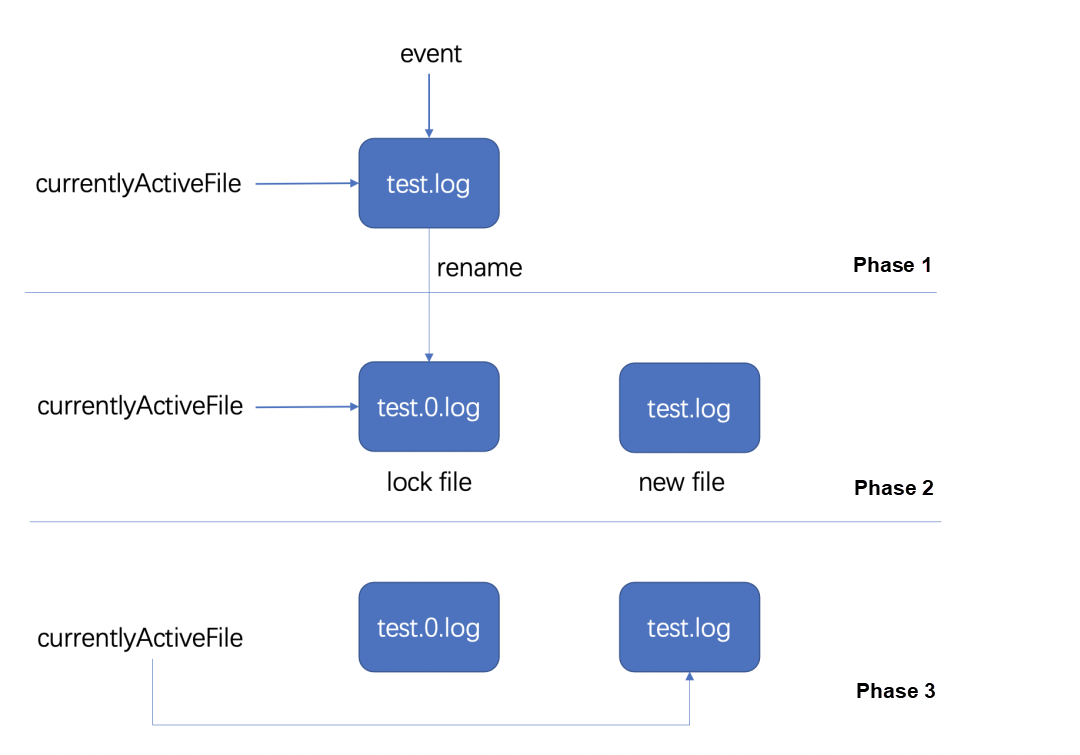
The create mode is to rename the original log file and create a new log file to replace it. Log4j uses this mode. The detailed steps are shown in the following figure:
The idea of copytruncate mode is to copy out the log being output and then truncate the original log.
Currently, the support for the two modes by mainstream components is listed below:

The following introduces some real scenarios in the customer's actual production environment.
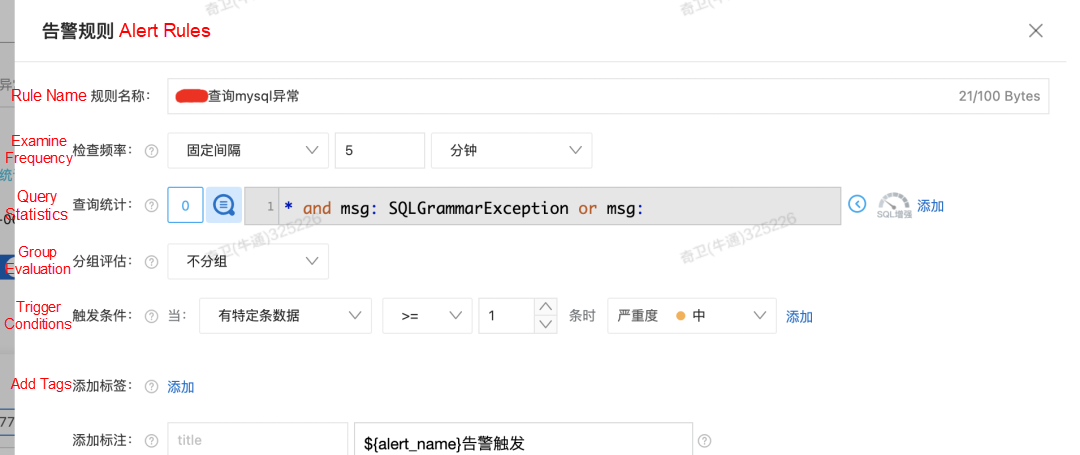
Customer A uses log rotation to set the program logs and collects the logs to SLS. Customer A also uses keywords to configure related alarms and monitoring dashboards.
First, through the configuration of log4j, a maximum of 10 log files can be kept, each 200 MB in size, and the disk can be monitored. The log files are stored in the /home/admin/logs path.
Then, the SLS log collection function of SAE is used to collect logs to SLS.
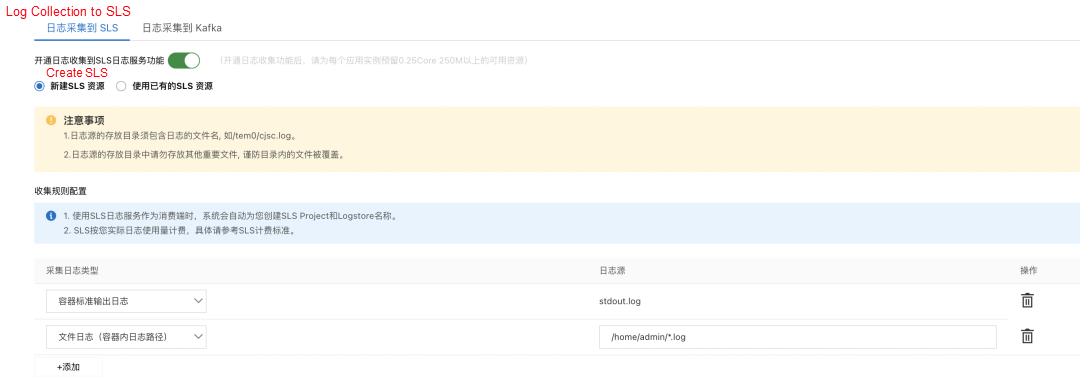
Finally, the alarm is configured using some keywords of the logs in the program or some other rules, such as the 200 status code.
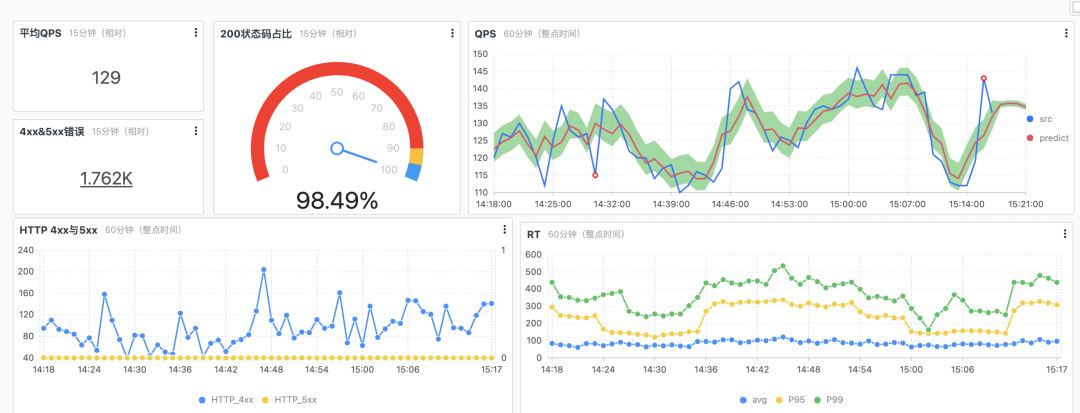
Configure the monitoring dashboard using Nginx logs.
In many cases, we need to collect logs, not just one line at a time, but merge multiple lines of logs into one line for collection, such as JAVA exception logs. At this time, the log merging function is needed.
There is a multi-line collection mode in SLS. This mode requires users to set a regular expression for multi-line merging.
Vector collection also has similar parameters. The multiline.start_pattern is used to set the regular expression of a new row. If a row conforms to the regular expression, it is considered a new row. The multiline.start_pattern can be used in conjunction with the multiline.mode parameter. Please see the vector website for more parameters.
Regardless of the SLS collection or the vector collection to Kafka, the CheckPoint information will be saved locally to ensure the collected logs are not lost. In case of abnormal situations (such as unexpected server shutdown or process crashes), the data will be collected from the last recorded location to ensure the data will not be lost as much as possible.
However, this does not guarantee the log will not be lost. Log collection loss may occur in some extreme scenarios, such as:
For scenarios 2 and 3, you need to check whether your applications have printed too many unnecessary logs or whether the log rotation settings are abnormal. These situations will not occur under normal circumstances. For Scenario 1, if the requirements for logs are very strict, and logs cannot be lost even after the pod is rebuilt, you can use the mounted NAS file system as the log storage path. This way, logs will not be lost even after the pod is rebuilt.
This article focuses on various log collection solutions provided by SAE, as well as related architectures and features of usage scenarios. In summary, there are three points:
Lagou Uses Function Compute to Build an Online Programming System
99 posts | 7 followers
FollowKidd Ip - October 9, 2025
Aliware - March 19, 2021
Alibaba Developer - February 1, 2021
Alibaba Cloud Native Community - April 15, 2025
Alibaba Cloud Serverless - November 27, 2023
Alibaba Cloud Native - October 9, 2021
99 posts | 7 followers
Follow Simple Log Service
An all-in-one service for log-type data
Learn More Log Management for AIOps Solution
Log into an artificial intelligence for IT operations (AIOps) environment with an intelligent, all-in-one, and out-of-the-box log management solution
Learn More Message Queue for Apache Kafka
A fully-managed Apache Kafka service to help you quickly build data pipelines for your big data analytics.
Learn More Storage Capacity Unit
Plan and optimize your storage budget with flexible storage services
Learn MoreMore Posts by Alibaba Cloud Serverless