In the process of rapid iteration of business, Xianyu is facing the test of stability, and the problem of application non-response (ANR) is particularly prominent. On the public opinion platform, users can occasionally see feedback that says the Xianyu App is stuck. When ANR occurs, the system will show a pop-up box to guide the user to close the application or close the application process, which affects the user experience and even causes user loss.
The difficulty of the ANR problem is that it is extremely difficult to reproduce offline. There is almost no feedback on the ANR problem in the normal testing process. However, when it comes online, the ANR problem occurs in the face of Android fragmented models, system running status, and user operating habits. Therefore, we must rely on monitoring and troubleshooting to solve the problem.
This article mainly expounds on the thinking of Xianyu on the ANR problem handling from the aspects of ANR monitoring, troubleshooting system, and optimization cases.

To solve the ANR problem, you need to understand why ANR occurs first. The Android system monitors the response capability of the components (Activity, Service, Receiver, Provider, and Input) of the application process. If the application process has not completed the task after the predetermined time, the ANR system warning will be triggered.
The reasons for the ANR problem can be divided into two categories:
Use FileProvider to monitor changes to /data/anr/traces.txt files and capture and report the changes directly. However, since the system file permissions for Android 6.0 or above are tightened, there is no permission to read this file. Our previous use of this monitoring scheme resulted in a large number of unreported ANR problems on higher-version devices.
Open a subthread to post a message to the main thread at regular intervals (for example, 5 seconds) to monitor whether the message is consumed. If it is not processed, the main thread is stuck, and ANR may have occurred. Then, the error information of the current process is obtained through the system service to determine whether ANR has occurred.
However, there will be a large number of missing reports, and the performance of the polling solution is not good.
After ANR is triggered, the system service sends a SIGQUIT signal to the application process to trigger dump traces. On the application side, we can monitor the SIGQUIT signal to determine whether ANR has occurred. You need to obtain the error information of the current process through system services to filter further and eliminate false positives caused by the ANR of other processes.
The third solution has high accuracy and low performance loss. It is also the mainstream app monitoring solution in the industry.
After selecting the appropriate monitoring scheme, a perfect troubleshooting system is needed to analyze the ANR problem attribution.
After detecting the SIGQUIT signal, the Crash SDK calls the interface of the dump stack inside the art virtual machine to obtain ANR traces information, including the stack of all threads in the ANR process. Based on this, it can analyze any problems, such as long main thread duration, deadlock, main thread waiting for lock, and main thread sleep.
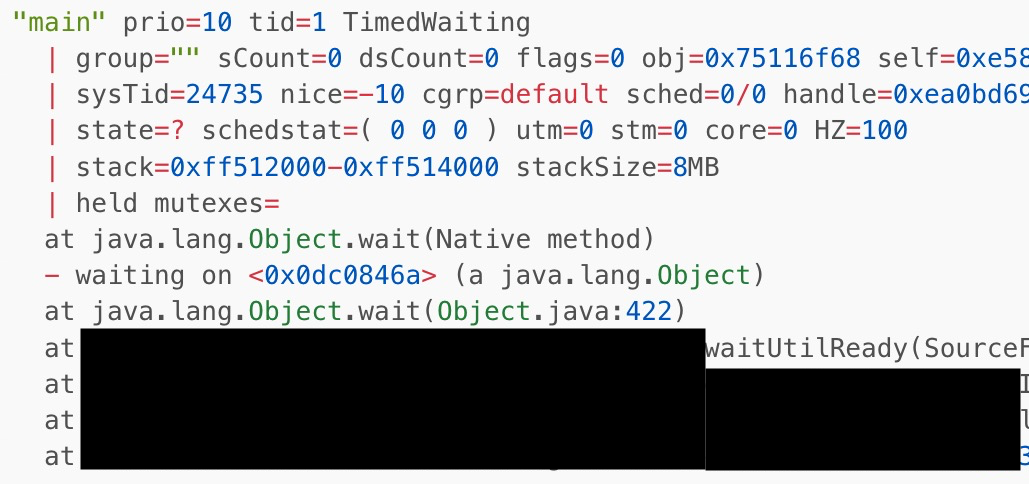
The following figure shows ANR stuck in the album scenario. You can use the trace file to locate the cause of the main thread waiting for the subthread.

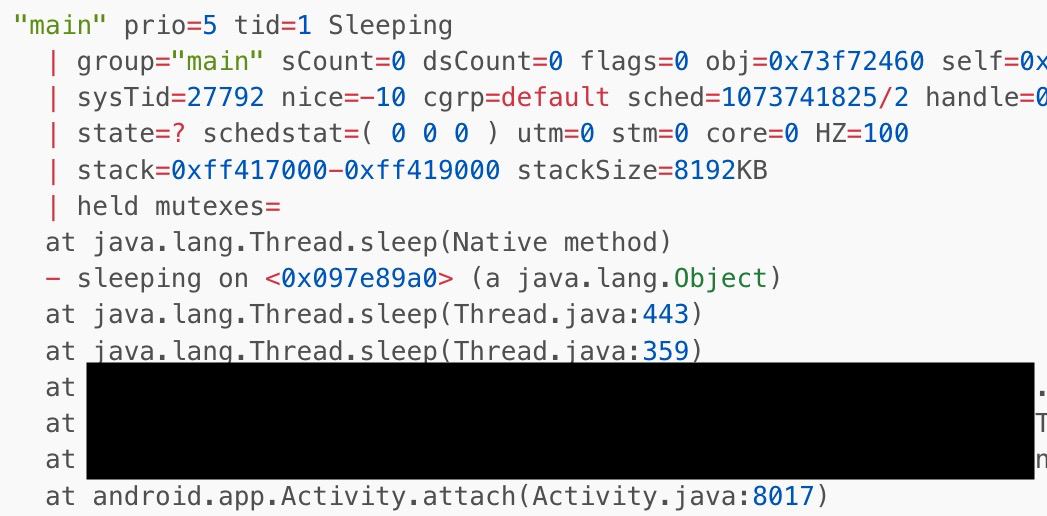
The following figure shows ANR in the webview scenario. You can use the trace file to locate the cause of the active loop sleep of the main thread and wait for the resource initialization to complete.

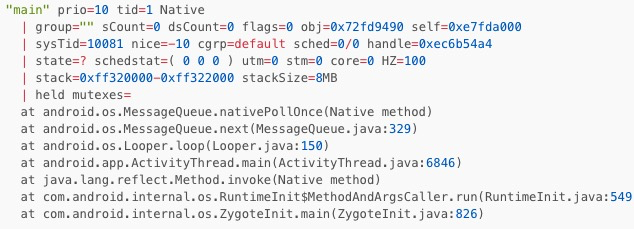
After relying on ANR traces information to fix the problem with a clear stack, the remaining problem is nativePollOnce. The stack is listed below:

The stack contains the source code of the system MQ, and there is no business code, which seems to be difficult to locate and analyze.
The nativePollOnce problem occurs in the following scenarios:
nativePollOnce to wait for wake up.For the second case, you can use the hook MQ to detect whether there is a synchronization barrier leak. We did not find such problems with small-scale online sampling tracking points.
For the third case, you can monitor the historical messages MQ by the main thread before ANR occurs and actively report them when time-consuming messages occur. When ANR occurs, historical messages, current messages, and messages waiting for queues are reported to the cloud through crash SDKs.
You can set the Printer of the Looper of the main thread to monitor the scheduling of each message and record the target, callback, what and time stamp, as well as the current timestamp.
A subthread is enabled at the same time. If a message is processed, the stack of the main thread is collected at regular intervals. The stack is associated with the message using a timestamp. This allows you to know the stack of the main thread when each message is executed.
public final class Looper {
    public static void loop() {
        ......

        for (;;) {
            ......
            final Printer logging = me.mLogging;
            if (logging != null) {
                logging.println(">>>>> Dispatching to " + msg.target + " " +
                        msg.callback + ": " + msg.what);
            }
            ......
            try {
                msg.target.dispatchMessage(msg);
            } finally {
                ...
            }
            ......
            if (logging != null) {
                logging.println("<<<<< Finished to " + msg.target + " " + msg.callback);
            }
        }
        ......
    }
}
Due to frequent string splicing, there is a certain loss in performance, and only small-scale online sampling is enabled.
While monitoring the MSMQ, we can see that one message takes 155ms to execute, and the wallclock takes 411ms. While observing the stack, we can see that the reason is the main thread calls resource-consuming initialization operations, and there are cross-process calls. Once the execution of messages (such as Receiver and Service) are blocked, the system service ANR warning will be triggered.


After having perfect and accurate monitoring and troubleshooting capabilities, let's look at some optimization cases.
Judging from the traces data of online ANR, the ANR problems caused by SP are mainly concentrated in three categories:
After testing MMKV and SP online and comparing performance data, we found that MMKV can solve these three problems perfectly.
On the first installation, we tested the read/write performance of MMKV and SP. We obtained the sum for 1000 cycles. Each key and value are different:
| Write int | Read int | Write a string | Read string | |
| SP | 137.2 ms | 1.3 ms | 430.6 ms | 2.8 ms |
| MMKV | 20.1 ms | 1.6 ms | 18.3 ms | 2.6ms |
On the second start, only one value of the KV component is read:
| loadfromfile | Read the first int value | Read string afterwards | |
| sp | 1ms (starting the subthread load file) | 14.6ms (reading the first value will block waiting for the subthread to load) | 0ms (taken directly from memory) |
| mmkv | 1ms (establishing file to memory mapping) | 1.9ms (reading the first value triggers a page missing exception) | 0ms (taken directly from memory) |
We take over all getSharedPreferences interface calls in the compiler in a facet manner and return the MMKV implementation or the SharedPreferencesImpl implementation of the original system according to the whitelist configuration. This does not affect the use of the business layer.
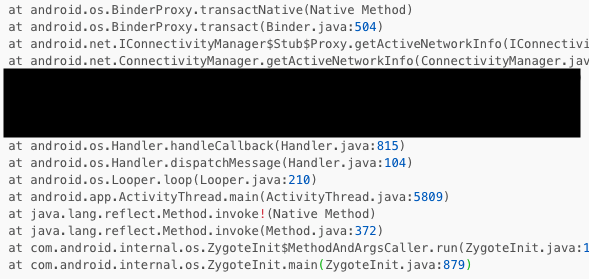
Judging from the traces data of online ANR, there are many getActiveNetworkInfo IPC calls. Through tracking points, we found that IPC cross-process communication is time-consuming. Also, there are too many broadcast listeners monitoring the network status. Each call will be repeated to query the network status. Each accumulation causes the duration to increase. Once the scheduling and execution of key messages are blocked, ANR will be triggered.
The optimization scheme is to use the dynamic proxy IConnectivityManager interface, intercept the proxy getActiveNetworkInfo method, and prioritize the use of the cache.
The unified global network broadcast listener obtains network information in the asynchronous thread IPC to update the cache. The cache can be used later to avoid multiple IPC calls.
A serial task in the Application#onCreate phase will prevent the main thread from executing. In this case, ANR will occur if the key messages sent by the system are not scheduled by the main thread.
The core idea of repair is to avoid registering the receiver, service, and other components during the startup phase or delay the registration until all onCreate is executed.
public class MyApplication extends Application {

      @Override
    public void onCreate() {
      // Time-consuming serial task...
      isInitDone=true;
    }

    @Override
    public Intent registerReceiver(final BroadcastReceiver receiver, final IntentFilter filter) {
        if (isInitDone) {
            return super.registerReceiver(receiver, filter);
        }

        mainHandler.post(new Runnable() {
            @Override
            public void run() {
                MyApplication.super.registerReceiver(receiver, filter);
            }
        });

        return null;
}
}After the problems related to ANR monitoring and troubleshooting capabilities are improved, the ANR rate is reduced by more than half after implementing a series of optimization solutions, bringing a better user experience. I hope the content of this article can inspire developers to handle ANR and maximize the performance of our application code.
We will consider the following two aspects in the follow-up:
Flutter Architecture Design and Application in Streaming Scenarios

56 posts | 4 followers
FollowAlibaba Cloud Native Community - December 10, 2025
XianYu Tech - November 22, 2021
Alibaba Clouder - December 22, 2020
Alibaba Cloud Native Community - December 24, 2025
XianYu Tech - June 22, 2020
XianYu Tech - May 20, 2021

56 posts | 4 followers
Follow EMAS Superapp
Build superapps and corresponding ecosystems on a full-stack platform
Learn More Web App Service
Web App Service allows you to deploy, scale, adjust, and monitor applications in an easy, efficient, secure, and flexible manner.
Learn More Managed Service for Prometheus
Multi-source metrics are aggregated to monitor the status of your business and services in real time.
Learn More Web Hosting Solution
Explore Web Hosting solutions that can power your personal website or empower your online business.
Learn MoreMore Posts by XianYu Tech