By Jianli from Xianyu Technology
Many business scenarios on Xianyu require algorithms to implement classification, such as image classification, component identification, product layering, and dispute category prediction. In these scenarios, an algorithm model is often required to provide interpretable identification results. In other words, the model needs to identify the categories and make the apparent category hierarchies and sources used in the identification process. Therefore, implementing interpretable image classification has become a project development requirement. To this end, I conducted a survey on Neural-Backed Decision Tree (NBDT) algorithms.
NBDT is a model that was introduced in a recent paper published by UC Berkeley and Boston University in April 2020. As you may have noticed, the letter "B" in NBDT does not stand for "Boosting," but it stands for "Backed" instead. Therefore, readers that are familiar with GBDT should not misunderstand NBDT as a new type of gradient boosted decision tree. NBDT is only one decision tree rather than multiple trees.
NBDT is characterized by a neural network (NN) that is integrated into the decision tree before the decision tree. The NN is usually a convolutional neural network (CNN). To my knowledge, the structure of an NBDT is roughly composed of a CNN followed by a decision tree (DT).
Currently, NBDT is used for image classification. Its advantage does not lie in the accuracy. In the author's experiment, its accuracy was slightly lower than the CNN at the front. Its real advantage lies in its capability of balancing model accuracy and model interpretability. Specifically, NBDT can achieve much higher classification accuracy than any tree model by slightly sacrificing the accuracy of the CNN. In addition, with a decision tree, NBDT can also explicitly and progressively demonstrate the basis for model inference. For example, NBDT not only can identify an image of a dog, but it can also make each step in the identification process explicit. At first, NBDT identifies the image as an "animal" with a probability of 99.49%. Then, it identifies the image as a "chordate" with a probability of 99.63%. Next, it identifies the image as a "carnivore" with a probability of 99.4%. Finally, it identifies the image as a "dog" with a probability of 99.88%. This inference method enhances the interpretability of the model.
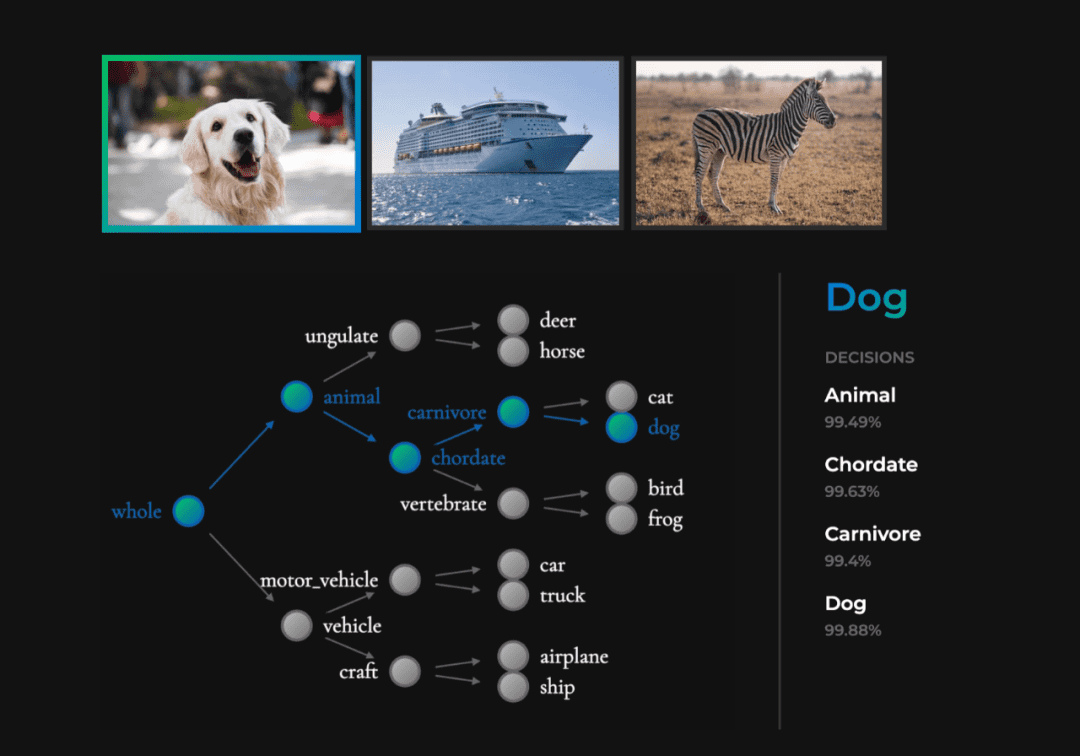
Figure 1: Dog Classification (Referenced From Official Demo)
NBDT uses a pre-training + fine-tuning framework. The overall process is roughly divided into the following three steps:
For example, use cifar10 (an image classification dataset with 10 categories, including "cat" and "dog") to train a resnet18 CNN. The last layer of such a CNN is usually a fully-connected (FC) layer. Assume that the vector dimension output by the second-to-last layer is d. Then, the dimension of the FC layer W is W. This way, each column vector of W corresponds exactly to a category, which can be regarded as a hidden vector of each category. This approach is similar to Word2Vec.
In the article, this tree structure is called "induced hierarchy." First, we implement hierarchical clustering for the hidden vectors of categories, which can be achieved in the source code by directly calling the AgglomerativeClustering class of the sklearn module. After the clustering hierarchy is established, we encounter two problems:
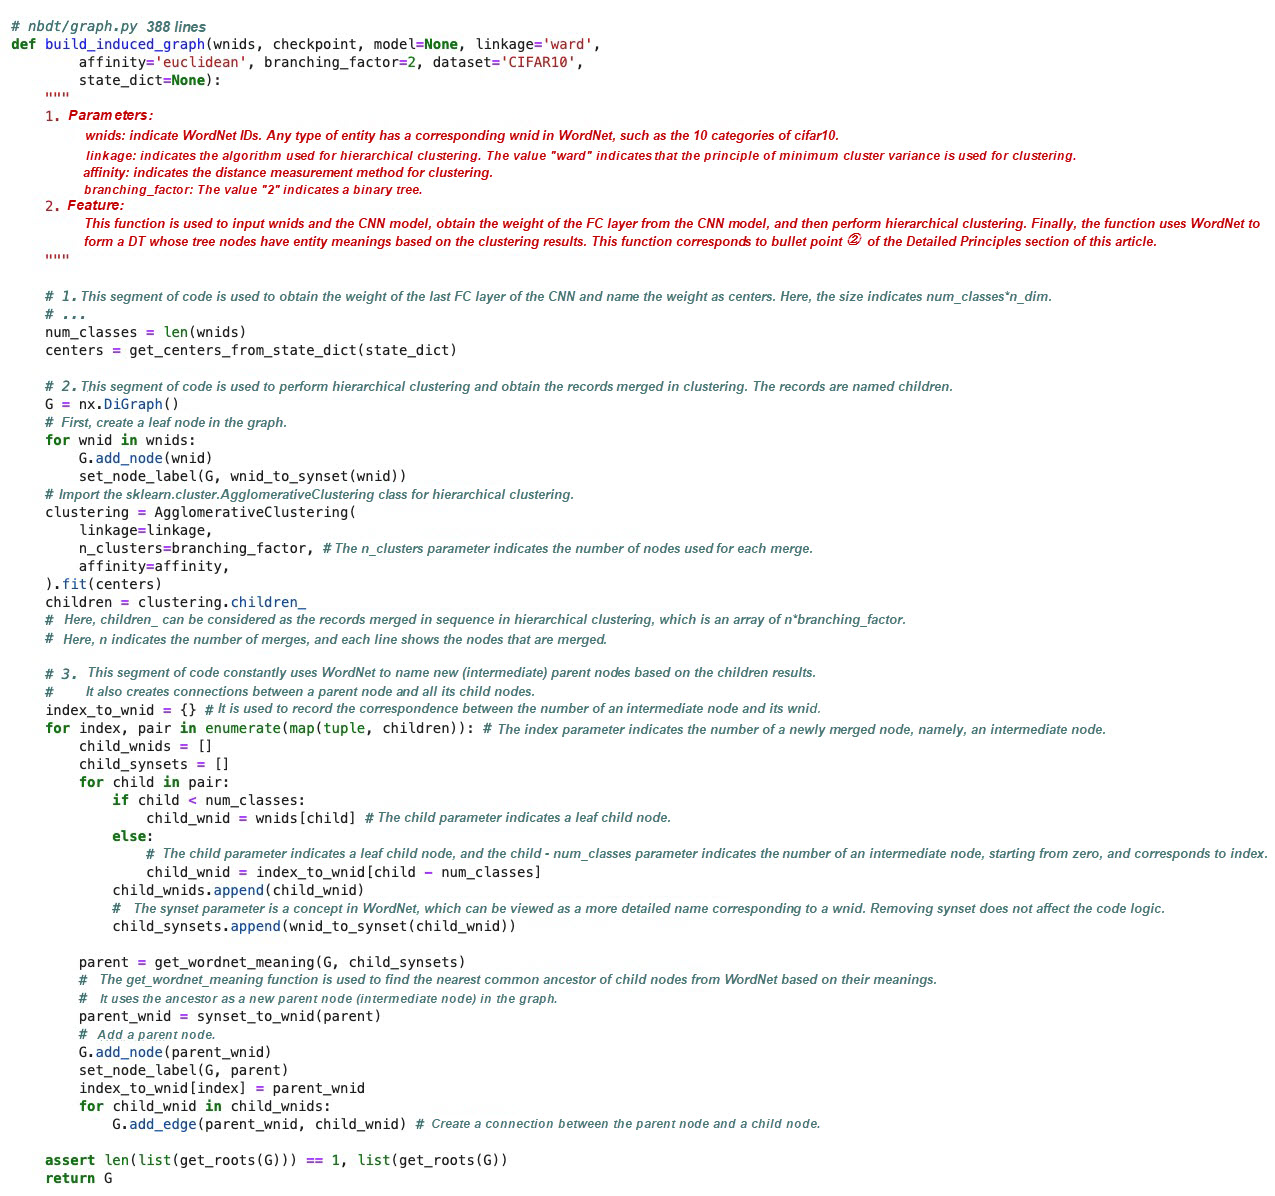
To solve the first problem, the author used WordNet, which is a word network that contains hyponymic and hypernymic relations between nouns. In Python, the WordNet module can be directly imported into the NLTK module, where it can be called. Since a leaf node has an entity description, such as the 10 categories of cifar10, the nearest common ancestor of the two leaf nodes can be found through WordNet. The nearest common ancestor of cat and dog in WordNet is the word carnivore. Therefore, carnivore is used as the parent node of the words cat and dog. The parent nodes can be named from bottom to top according to the results of hierarchical clustering until there is only one root node. This way, an induced hierarchy is formed, as described in Step 1 of Figure 2. The induced hierarchy is also the decision tree used for dog classification in Figure 1.

Figure 2: Training and Inference (Referenced From the Original Paper)
To solve the second problem, the author used the mean value of child nodes' hidden vectors to represent the hidden vector of a parent node. See the description of Step C in Figure 3.
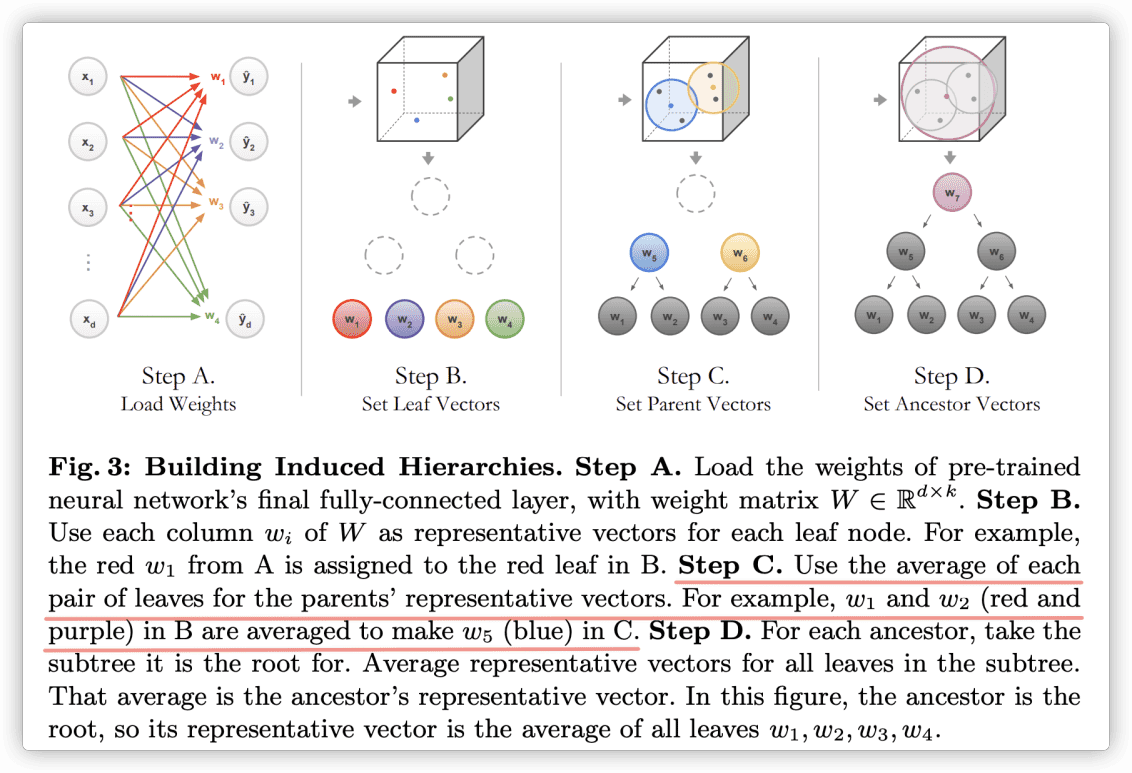
Figure 3: Building Induced Hierarchies (Referenced From the Original Paper)
After the induced hierarchies (tree structure, hereinafter referred to as DT) are established, the complete model is no longer a CNN, but CNN + DT. To force the model to predict new samples based on the tree structure from the root node to the leaf nodes, we need to add the classification loss of the tree structure to the total loss and fine-tune the model.
First, we need to understand the prediction method used by the complete model: I feel that the author's thinking goes right to the essence of the matter. When a new sample (an image) enters the model, the image first arrives at the CNN. Before the image arrives at the last FC layer W, the CNN outputs a d-dimensional vector x to the image.
Then, matrix multiplication is performed for x and W (essentially the inner product with each column vector) to obtain the logits distribution of the sample in each category. If the softmax parameter is set, the probability distribution can be obtained. Since each column vector of W represents the hidden vector of a DT leaf node, this DT can completely replace W. This means no matrix multiplication is directly performed for x and W, but the DT is traversed from the root node to calculate an inner product for x and each child node of the DT in sequence. There are two ways to traverse DT nodes: Hard and Soft. Assume that the DT is a binary tree. If Hard mode is used, inner products are calculated for x and the two child nodes on the left and right, respectively. Each time, x is classified into the child node with the larger inner product until x arrives at the last leaf node, which indicates the final category to which x belongs. If Soft mode is used, all intermediate nodes are traversed, and inner products are calculated for x. The final probability of the leaf nodes is the probability product of all intermediate nodes along the path by which x arrives at the leaf nodes. Ultimately, the category to which x belongs is determined based on a comparison of the final probabilities of all leaf nodes.
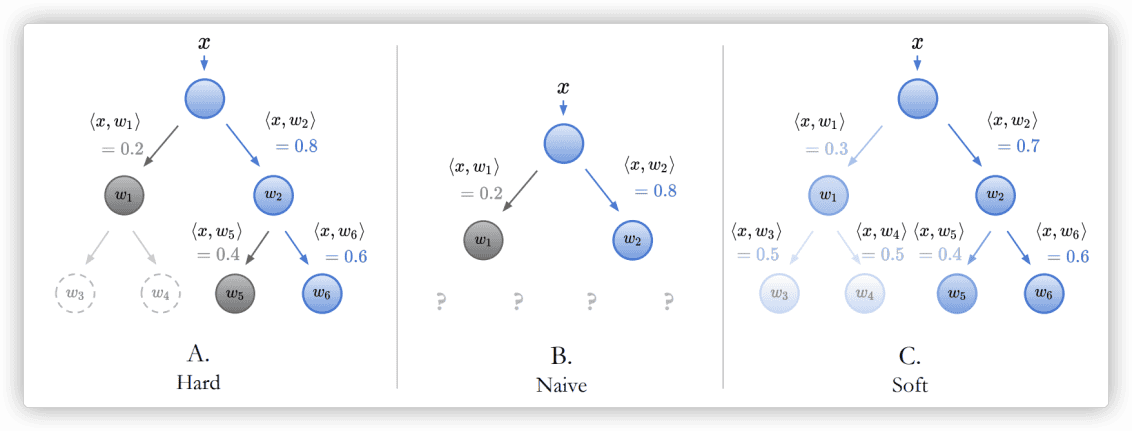
Figure 4: Node Probability Calculation (Referenced From the Original Paper)
After gaining an understanding of the prediction details of the complete model, we can explain the classification loss of induced hierarchies (tree structures). Correspondingly, the Loss function also has two modes: Hard and Soft, as shown in Figure 5. If Hard mode is used, the Loss function adds up the classification losses (at certain weights) of the leaf nodes to which a sample belongs along the real path in the DT. Nodes not along the real path (dotted w3 and w4 in Figure A) are not taken into account. The classification loss of each node is calculated based on the cross entropy. If Soft mode is used, the cross entropy between the final probability distribution on leaf nodes and the real one-hot distribution is directly calculated as the loss. In short, the Loss function in Hard mode calculates the cross entropy of the path, while the Loss function in Soft mode calculates the cross entropy of leaf nodes. In Pytorch, the cross entropy is calculated like this:

CrossEntropy(x,class)=-log(exp(x[class])Σjexp(x[j]))=-x[class]+log(Σjexp(x[j]))
The total loss of the final model also considers the classification loss of the original CNN (Lossoriginal). Therefore, the total loss to be fine-tuned is listed below:

Losstotal=Lossoriginal+Losshard or soft
Based on my understanding of the source code, when the Loss function performs backpropagation (BP), it still optimizes the network weight of the CNN. The Loss function forces the output of the preceding CNN to meet the expectations of the following DT. This way, the predicted category output by the sample according to the inference path of the DT conforms to the real category as much as possible.
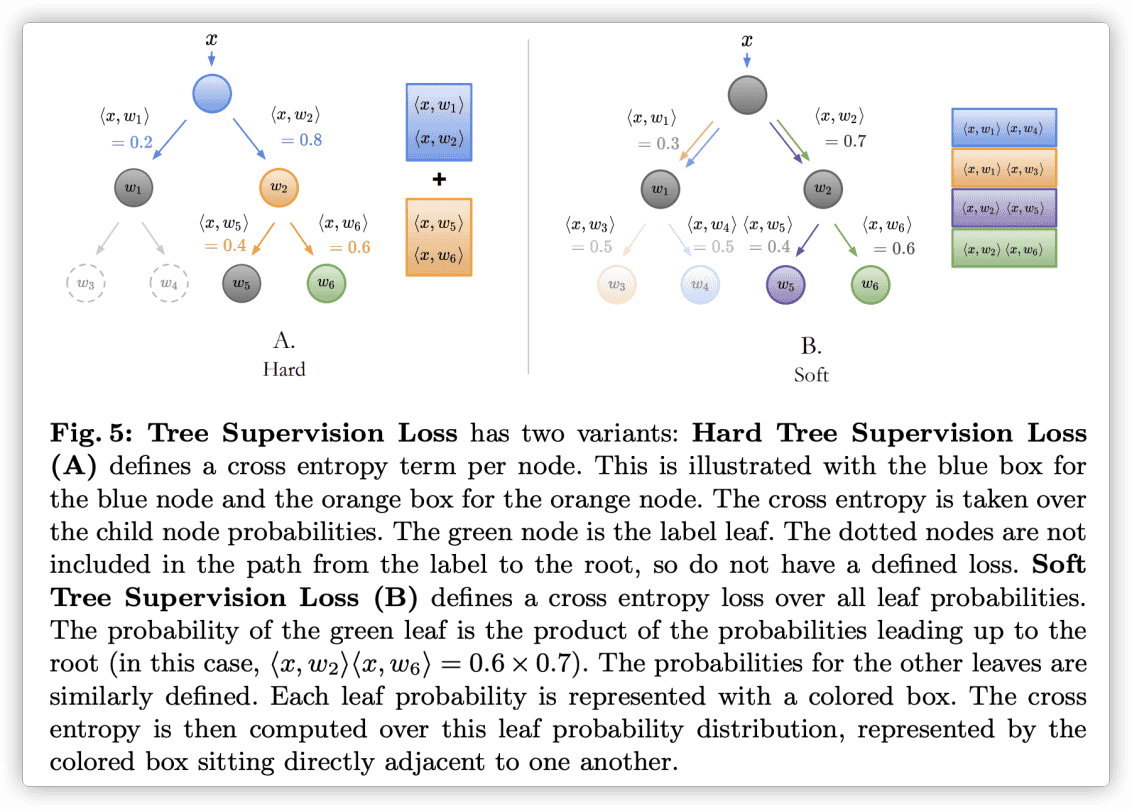
Figure 5: Loss in Hard and Soft Modes (Referenced From the Original Paper)
The Python code of NBDT is open source on GitHub. In general, the code is implemented with Pytorch and Networkx. There are more than 4000 lines of code in total, and the four core scripts are model.py, loss.py, graph.py, and hierarchy.py. The code has almost no annotations or parameter interpretations, so it is not easy to read. The following figure shows the analysis of several core segments of code.
The core function is build_induced_graph, which is used to input the WordNet IDs and CNN model of leaf nodes. Then, the function obtains the FC weight from the CNN model, performs hierarchical clustering, and uses WordNet to "name" the clustering result. This forms a DT whose nodes have entity meanings. This function corresponds to bullet point 2 in the Detailed Principles section of this article. This function is described below:
As mentioned earlier, after a new sample enters the model, it first arrives at the CNN. Before the sample arrives at the FC layer, the model outputs the d-dimensional vector x and then calculates the inner products of x and the hidden vectors of DT nodes. The hidden vector of a DT node is equal to the mean value of the hidden vectors of its child nodes. The get_node_logits method is optimized: Since the inner product of the mean values of vectors is equal to the mean value of the inner products of the vectors (as shown in the formula below), it is not necessary to explicitly solve hidden vectors and calculate their inner products. Instead, the mean value of the logits of all child nodes of a node can be used as the logits of the node itself. The specific code is below:


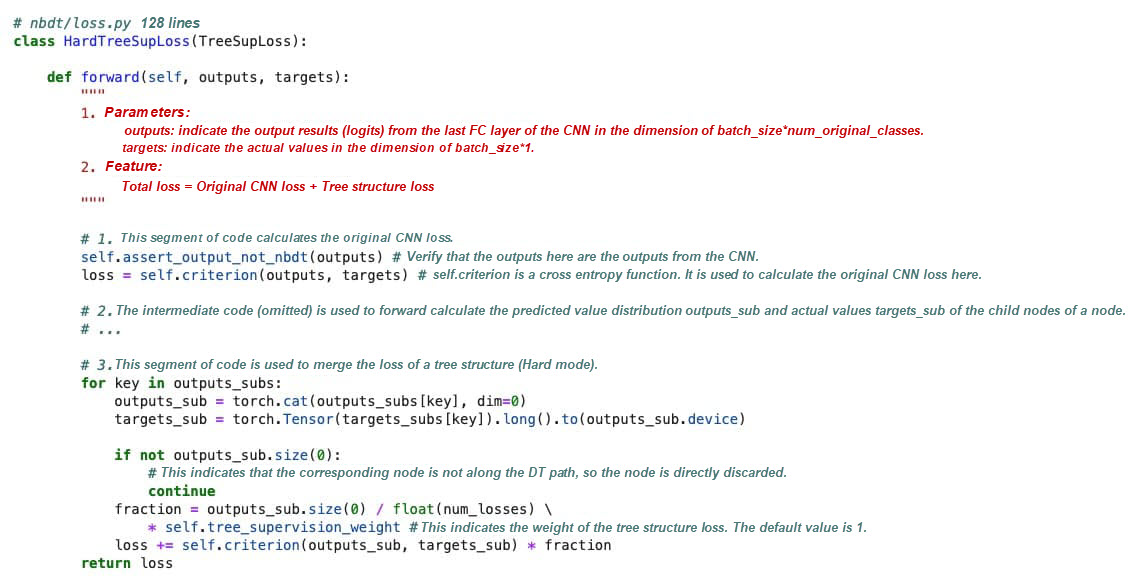
As mentioned earlier, the total loss is equal to the sum of the original CNN's loss and the tree structure's loss. Let's use the Hard mode as an example. The following code explains how to calculate the loss of the tree structure along the DT path and then merge the loss into the total loss.
The author compares the original CNN (WiderResnet28×10) with multiple interpretable neural network models on multiple datasets. The following table shows that the accuracy of the NBDT is slightly lower than the original CNN but far surpasses the other models. This indicates that NBDT has reached state-of-the-art status. In NBDT, the score when using Soft mode is higher than that of Hard mode. This is easy to understand because Soft mode considers global optimization, while Hard mode considers consecutive local optimizations.
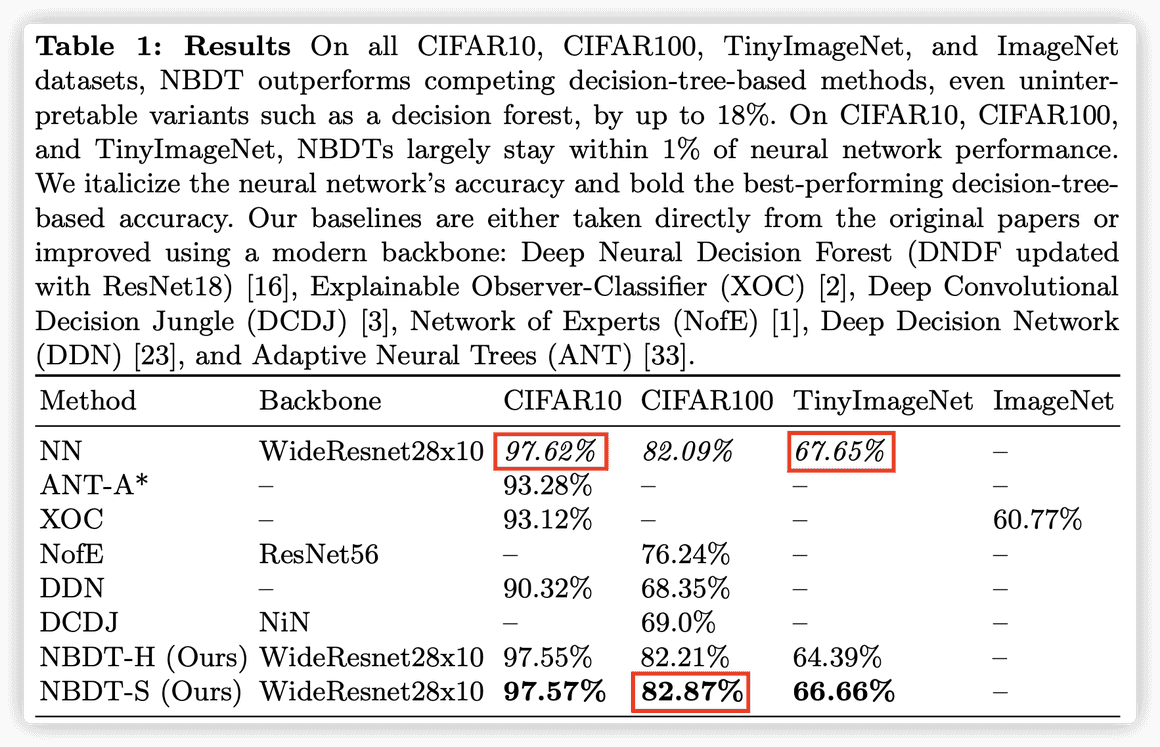
Figure 6: Experimental Results (Referenced From the Original Paper)
For more information about installation and usage, see the official GitHub page. This article only summarizes common use methods.
You can directly run the nbdt command, followed by the image path (URL or local path). During the first execution, you must download WordNet and the official pre-training model. The pre-training model applies to the cifar10 dataset. Therefore, it is better to input an image that is in one of the 10 categories. The output shows that the prediction is performed step-by-step.


The goal of NBDT research is to find a method that makes classification interpretable. Such an interpretable method can be used in any scenario where a DT is required during classification. Although this article focuses on an image classification scenario, any classification process can be interpreted using NBDT as long as the preceding CNN is replaced with other networks. For example, in Xianyu's high-quality product layering project, we can build induced hierarchies of products based on our business knowledge. For example, the first layer could classify inputs into professional sellers and individual sellers, and the second layer could classify inputs into high, medium, and low sales rates. Then, the last layer could classify inputs into different levels of high-quality products. Then, we can train an NBDT based on these hierarchies to perform classification.
Another typical example is image classification, where a seller uploads an image to Xianyu. Here, the seller hopes that the algorithm can automatically identify the category of the product he wants to sell. The seller might upload an image of a chair or a table, but the correct category is "furniture." The hierarchy-based NBDT can automatically identify the product published by the seller as "furniture." Alternatively, an NBDT can also provide recommended options, allowing sellers to select their categories. This eliminates the need for manual filling. In the future, NBDTs may be used for these are other tasks.
From Nothing to Something: Xianyu's Path to Integration with Flutter

56 posts | 4 followers
FollowApsaraDB - March 3, 2020
Alibaba Clouder - July 17, 2019
Alibaba F(x) Team - July 28, 2022
- January 17, 2018
Alibaba Clouder - March 8, 2017
Alibaba Clouder - September 17, 2020

56 posts | 4 followers
Follow Platform For AI
A platform that provides enterprise-level data modeling services based on machine learning algorithms to quickly meet your needs for data-driven operations.
Learn More Epidemic Prediction Solution
This technology can be used to predict the spread of COVID-19 and help decision makers evaluate the impact of various prevention and control measures on the development of the epidemic.
Learn More CT Image Analytics Solution
This technology can assist realizing quantitative analysis, speeding up CT image analytics, avoiding errors caused by fatigue and adjusting treatment plans in time.
Learn More Offline Visual Intelligence Software Packages
Offline SDKs for visual production, such as image segmentation, video segmentation, and character recognition, based on deep learning technologies developed by Alibaba Cloud.
Learn MoreMore Posts by XianYu Tech