By Yijun
In the previous preliminary sections, we roughly learned how to troubleshoot problems from the perspectives of common error logs, system and process metrics, and the core dump when problems occur with Node.js application on the server. This leads to the next question: If we know that the load of CPU and Memory for the process is high, or if we obtain the core dump file after the process crashes, how do we analyze and locate the specific JavaScript code segment?
In fact, the DevTools that comes with Chrome provides a good native analysis for the above-mentioned CPU and Memory problems of JavaScript code. This section will introduce some practical functions and metrics (based on Chrome v72, and differences exist in the usage between different versions).
This manual is first published on GitHub at https://github.com/aliyun-node/Node.js-Troubleshooting-Guide and will be simultaneously updated to the community.
When we find that the CPU usage of the current Node.js application is extremely high through the system and process metric check mentioned in the first section, we first need to dump the JavaScript code running status of the current Node.js application for some time, using some methods to analyze and understand the reason why the CPU usage is high. Fortunately, the V8 engine implements a CPU Profiler to help us export the JS code running status for a period of time. And at present, many mature modules or tools are also available to help us accomplish such operations.
v8-profiler is an established performance analysis tool for Node. js applications, which can help developers easily export the JS code running status. We can install this module in the project directory by executing the following command:
npm install v8-profiler --saveThen, the JS code running status within 5s can be obtained in the code as follows:
'use strict';

const v8Profiler = require('v8-profiler');
const title = 'test';
v8Profiler.startProfiling(title, true);
setTimeout(() => {
    const profiler = v8Profiler.stopProfiling(title);
    profiler.delete();
    console.log(profiler);
}, 5000);
We can see that the running status of the code exported by the v8-profiler module is actually a large JSON object. We can serialize the JSON object into a string, and store it in the file: test.cpuprofile. Note that the suffix of the file name here must be .cpuprofile, otherwise Chrome DevTools cannot recognize it.
Note: v8-profiler has not been maintained for a long time. It cannot be compiled and installed correctly on Node.js 8 and Node.js 10. If you want to use it in v8 or v10 projects, you can try v8-profiler-next.
After obtaining the JS code running status of the Node.js application for a period of time with v8-profiler, we can import it into Chrome DevTools for analysis.
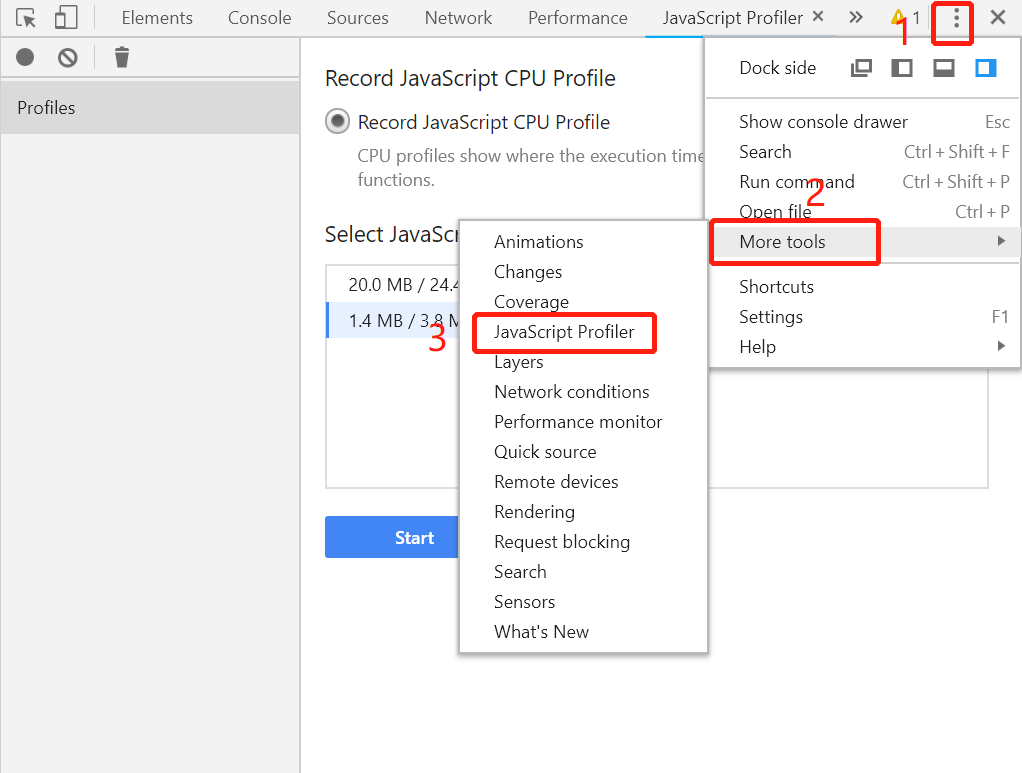
In Chrome 72, the method for analyzing the CPU profile that we dumped is different from the previous method, and the analysis page of the CPU profile is not displayed in the default toolbar. We need to click the More button on the right side of the toolbar, and then select More tools -> JavaScript Profiler to enter the analysis page of CPU, as shown in the following figure:
After selecting JavaScript Profiler, click the Load button on the page that appears, and then load the test.cpuprofile file saved just now to see the analysis results of Chrome DevTools:
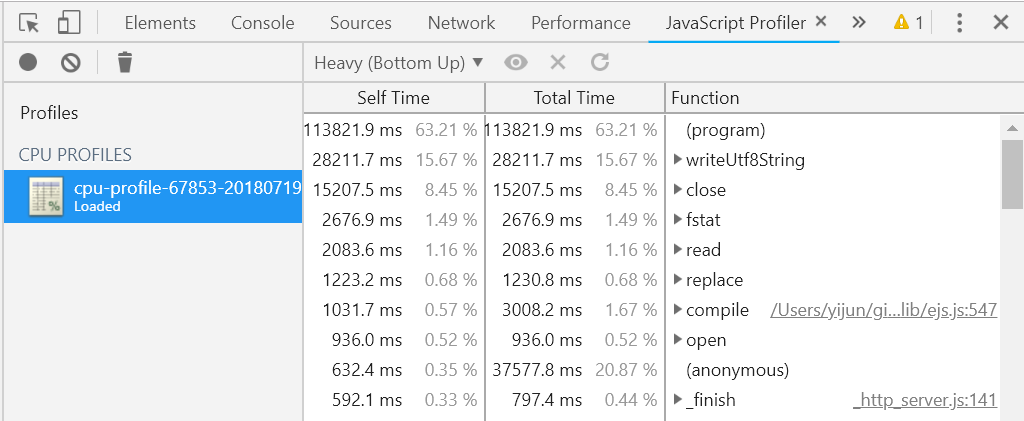
The default view here is the Heavy view. In this view, DevTools will list these functions from high to low based on their impact on your application. Click to expand to see the full path of these listed functions, which is convenient for you to check the corresponding positions in the code. The following are the explanations of two important metrics, which can enable us to perform more targeted troubleshooting:
As in the screenshot above, the EJS template should enable the cache online, so the compile method of the EJS template should not appear in the list. This is obviously a very suspicious performance loss point, and we need to find the cause.
In addition to the Heavy view, DevTools also provides a flame chart for more dimensions. Click on the upper left corner to switch:
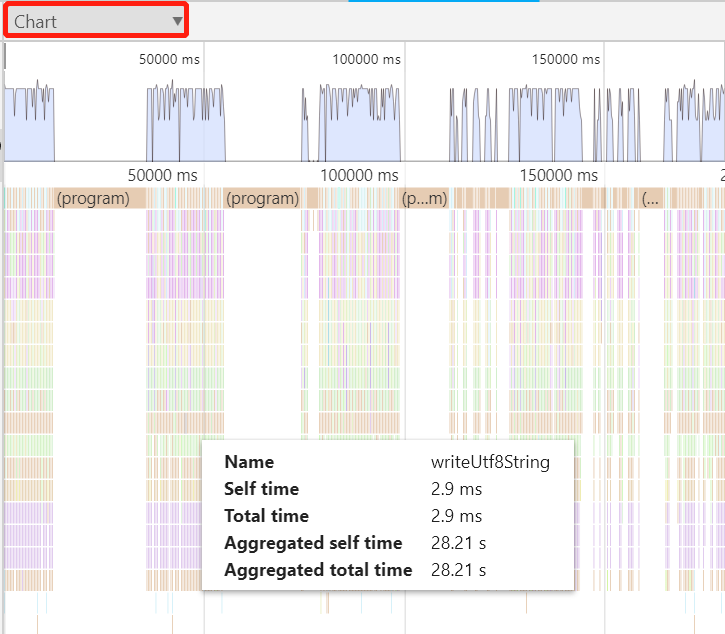
The flame chart is displayed according to the CPU sampling timeline, so it is easier for us to see the execution of JS code of the Node.js application during sampling. The meanings of the two newly added metrics are as follows:
In summary, with the help of Chrome DevTools, and the module that can export the current running status of JavaScript code of the current Node.js application, we are able to troubleshoot and analyze the high CPU usage of the corresponding Node.js process that is located when the application service is abnormal. In production practice, this part of JS code performance analysis is often performed in the performance stress test before the launch of new projects. If you are interested, you can study it in depth.
In my experience, memory leakage is one of the most serious problems that occur when Node.js is running online. In particular, the memory leakage caused by third-party library bugs or improper use by developers may make many Node.js developers feel helpless. This section first introduces the situation that the application has a great possibility of memory leakage.
In fact, it is also very easy to determine whether online Node.js applications are experiencing memory leaks: With the help of some systems and process monitoring tools in your company, if it is found that the total memory footprint curve of the Node.js application shows a trend of only increasing for a long time, and the heap memory breaks through 70% of the heap limit according to the trend, then basically, the memory of the application is very likely to be leaking.
However, this is not necessarily the case. If the access volume (QPS) of the application is actually also increasing, then it is normal for the memory curve to only increase. If the heap memory exceeds 70% or even 90% of the heap limit due to continuous QPS growth, then we need to consider expanding the server to alleviate the memory problem.
If a memory leak has been confirmed in the Node.js application, then we need to export the JS memory snapshot (heap snapshot) for analysis using some methods, just like the above CPU problem. The V8 engine also provides an internal interface to directly export JS objects distributed on the V8 heap for analysis by developers. Here, we use the heapdump module. First, run the following command to install the module:
npm install heapdump --saveThis module can then be used in the code as follows:
'use sytrict';

const heapdump = require('heapdump');
heapdump.writeSnapshot('./test' + '.heapsnapshot');
In this way, we obtain a heap snapshot file under the current directory: test.heapsnapshot. After opening this file with the text editing tool, we can see that it is also a large JSON structure. Similarly, the suffix of this file here must be .heapsnapshot, otherwise Chrome DevTools cannot recognize it.
Select Memory in the toolbar of Chrome DevTools to enter the analysis page, as shown in the following figure:
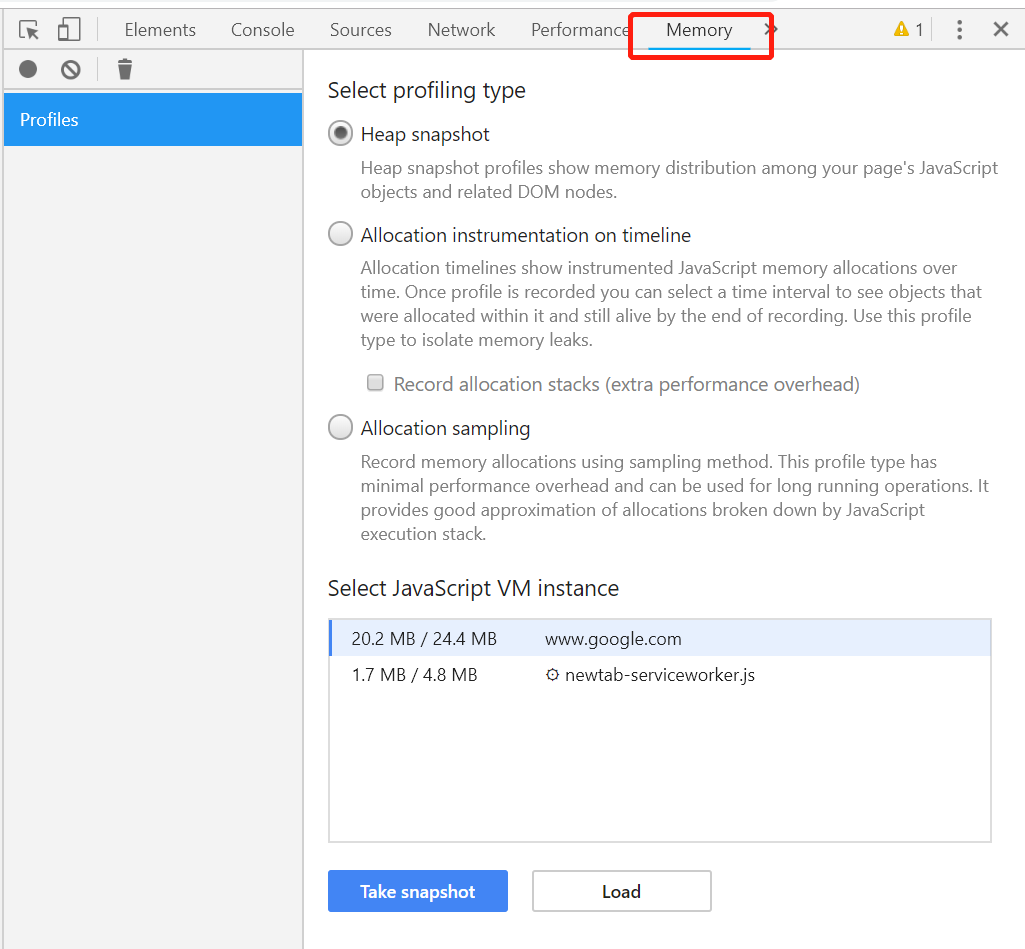
Then, click the Load button on the page, and select the test.heapsnapshot file we just generated to see the analysis results, as shown in the following figure:

The default view is actually a Summary view. The constructors here are the same as the constructors when we write JS code. They all refer to the objects created by the constructor. The new version of Chrome DevTools also adds the * number information after the constructor, which represents the number of instances created by this constructor.
In fact, in the analysis view of heap snapshots, two important concepts need to be understood, otherwise it is very likely that even if we obtain the heap snapshot and look at the analysis results, we still do not know what they mean. The two concepts are Shallow Size and Retained Size. To better understand these concepts, we need to first understand the Dominator Tree. First, let's look at the simplified memory relationship diagram described in the heap snapshot as follows:
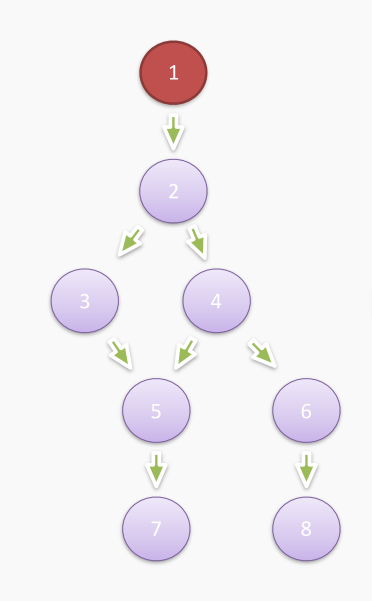
Here, 1 is the root node, that is, the GC root. For object 5, if we want to collect object 5 (that is, make it unreachable from the GC root), it is not enough to simply remove the reference of object 4 or object 3 to object 5, because it is clear that root node 1 can traverse from object 3 or object 4 to object 5 respectively. Therefore, only by removing object 2 can object 5 be collected, so in the above figure, the direct dominator of object 5 is object 2. Based on this idea, we can use some algorithms to convert the previously simplified heap memory relationship diagram into a dominator tree:
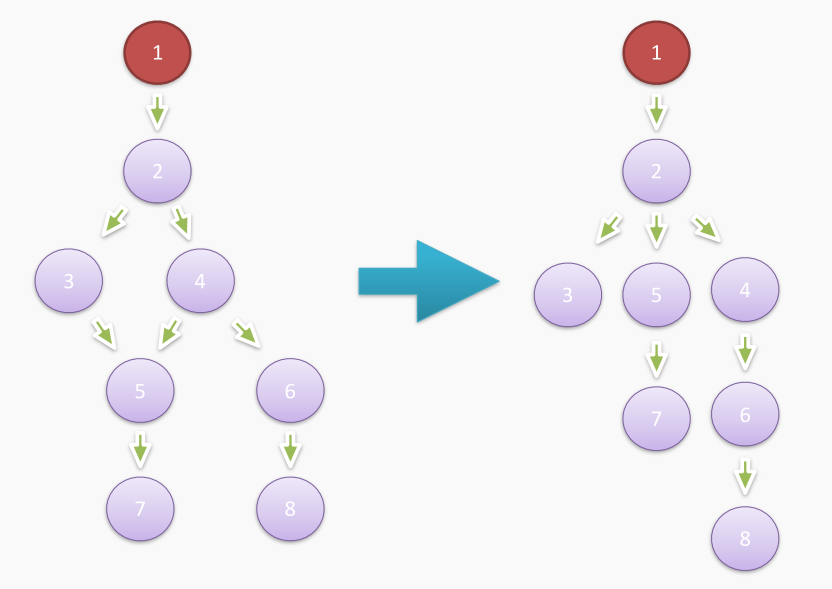
The dominance relationship between objects from 1 to 8 is described as follows:
Now, we can explain what Shallow Size and Retained Size are. In fact, the Shallow Size of an object is the size allocated on the V8 heap when the object is created, combined with the above example, that is, the size of the object from 1 to 8. The Retained Size of an object is the amount of space that the V8 heap can release after Full GC is executed if the object is removed from the heap. Also combined with the above example, object 3, object 7 and object 8 are all leaf nodes of the dominator tree, and have no object directly under their domination, so their Retained Size is equal to Shallow Size.
The remaining non-leaf nodes can be expanded one by one. For convenience of description, SZ_5 indicates the Shallow Size of object 5, and RZ_5 indicates the Retained Size of object 5. Then the following results can be obtained:
It can be found that the Retained Size of the GC root is equal to the sum of the Shallow Size of all objects reachable from this root on the heap, which is in line with our understanding. After all, if the GC root is removed from the heap, all objects starting from the root should be cleared.
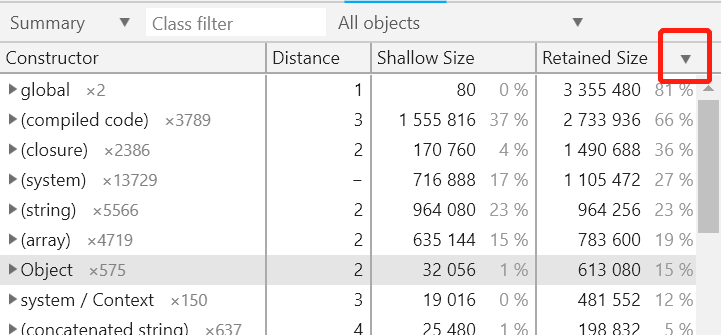
With this understanding, let's go back to the default overview view we saw at the beginning. Normally, the potential leaking objects tend to have a particularly large Retained Size. Therefore, we can sort the objects by the Retained Size in the window, to troubleshoot those objects that occupy most of the heap space:
If the suspicious object is confirmed, Chrome DevTools will automatically expand it for you to locate the code segment. The following takes the "vm" objected generated by the NativeModule constructor as an example:
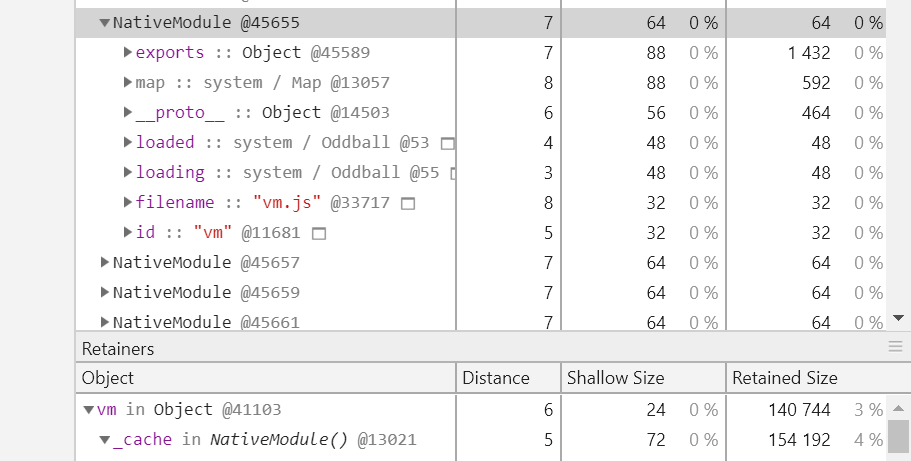
The upper part is the sequential reference relationship. For example, the "exports" attribute of the NativeModule instance @45655 points to the object @45589, and the "filename" attribute points to a string "vm. js". The lower part is the reverse reference relationship. For example, the "_cache" attribute of the NativeModule instance @13021 points to the Object instance @41103, while the "vm" attribute of the Object instance @41103 points to the NativeModule instance @45655.
If you are not quite able to understand the charts displayed in this section, you can take a closer look at the above example, because if you find a suspicious leaking object, you can see the attributes and values under this object and its parent reference chain in combination with the above figure. In this way, in most cases, we can locate the JS code segment that generated the suspicious object.
In fact, in addition to the default Summary view, Chrome DevTools also provides the Containment and Statistics views. You can select the upper left corner of the heap snapshot analysis page to switch views, and the Containment view is shown as the following figure:
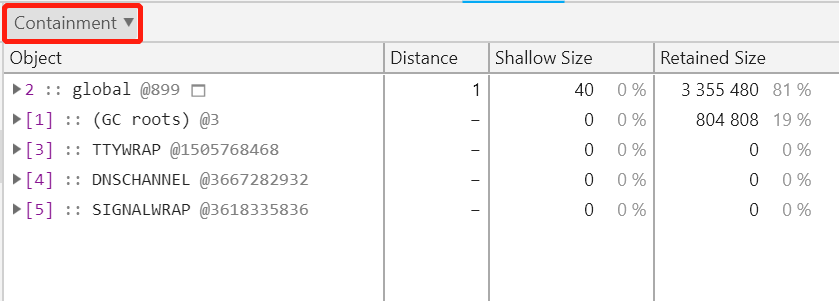
This view is actually a direct display of the memory relationship diagram parsed from the heap snapshot. Therefore, it is relatively difficult to directly find suspicious leaking objects from this view than the Summary view.
Chrome DevTools is actually a very powerful tool. This section only introduces its analysis capability for the CPU profile and heap snapshots, and the usage guidelines for its commonly used views. If you have read this section carefully, you will no longer panic when facing problems with Node.js applications located on the server, such as high CPU usage or memory leakage.
Node.js Application Troubleshooting Manual - Comprehensive GC Problems and Optimization
Alibaba Clouder - August 13, 2020
hyj1991 - June 20, 2019
hyj1991 - June 20, 2019
hyj1991 - June 20, 2019
hyj1991 - June 20, 2019
Prof - July 25, 2018
 ECS(Elastic Compute Service)
Elastic and secure virtual cloud servers to cater all your cloud hosting needs.
Learn More Mobile Testing
Provides comprehensive quality assurance for the release of your apps.
Learn More Web App Service
Web App Service allows you to deploy, scale, adjust, and monitor applications in an easy, efficient, secure, and flexible manner.
Learn More Elastic Desktop Service
A convenient and secure cloud-based Desktop-as-a-Service (DaaS) solution
Learn MoreMore Posts by hyj1991