By Zhenping
PolarDB Serverless originates from the paper published by the PolarDB team at SIGMOD 2021 and is the culmination of mature technologies. Leveraging high-performance Strict Consistency Cluster (SCC) and the hot standby architecture for failover in seconds, we have achieved industry-leading cross-machine scaling and switching.
This article aims to demonstrate the practical testing of PolarDB Serverless elasticity.
PolarDB Serverless instances are available in two types: a newly purchased Serverless instance and an original instance with the Serverless feature enabled, also known as a Serverless instance with a fixed specification. The former offers a larger scaling range and supports elastic billing based on Serverless. The latter allows the direct enablement of Serverless on the original instance and supports two billing modes: pay-by-specification and elastic billing. The current Serverless version supports 5.7, 8.0.1, and 8.0.2, with 5.6 still being supported. In this demo, we purchase an 8.0.1 instance for testing in Beijing zone K.
The elasticity upper and lower limits of read-only nodes are 0-7 PCUs, and for single nodes, the elasticity upper and lower limits are 1-32 PCUs. The resources of 1 PCU are about the resources of 1 CPU core and 2 GB of memory. We will align the computing capacity for different models, so there will be slight differences. These two configurations can be dynamically modified at any time after the instance is created, so you can select any one here.
For Serverless instances, a database proxy is created by default. Otherwise, read-only nodes cannot be used for horizontal elasticity. The database proxy will also be run in a Serverless mode. The range is 0.5-32 PCUs and is dynamically adjusted with the actual load. The no-activity suspension feature has a narrow target service type. When the load decreases, the Serverless instance is generally degraded to the lowest level of 1 PCU to run. If the no-activity suspension is enabled and the number of requests is completely reduced to 0, the instance is directly shut down to release resources. If new requests are sent later, they will be temporarily held and sent to the DB for execution after the instance is quickly pulled up. Storage types supported by Serverless instances include Polarstore Level 5 (PSL5) and PolarStore Level 4 (PSL4). Different specifications have different performance and costs, but I will not go into details here.
The preceding are some key options for the purchased Serverless instance. It takes about 5 to 10 minutes to create an instance. During this period, you can create an ECS instance in advance as a stress testing machine, preferably in the same zone as the Serverless instance. Since the theoretical maximum computing power of the PolarDB Serverless is 256 CPU cores (8 * 32 PCU), We recommend that you purchase an ECS instance with a large size. In this test, we select the ecs.g7.4xlarge instance type of 16 CPU cores and 64 GB of memory.
After you purchase an instance, log on to the PolarDB console, and it is displayed as Cluster Edition (Serverless). Next, configure the ECS endpoint in the whitelist, and create a polartest account and a database sbtest for stress testing. In the database proxy section, a primary endpoint and a cluster endpoint are created by default. You can use the cluster endpoint to perform the test. As read-only nodes of the Serverless instance are dynamically scaled, it is unnecessary to create custom endpoints. In the database node section, a 1 PCU primary node is initially generated by default. Click the Configure Serverless button in the upper right corner, and you can reconfigure the elasticity upper and lower limits of resources and read-only nodes. At the bottom is the storage section. The storage billing mode of the Cluster Edition is pay-as-you-go, which is the same as that of the PolarDB Enterprise Edition.
Click the Configure Serverless button. Set the elasticity upper and lower limits of single nodes to the maximum value of 32 and minimum value of 1 and set those of read-only nodes to 0. In this section, we use Sysbench to do the stress test, thus verifying that the specifications of the primary node can be autoscaled based on the load to achieve the Serverless capabilities.

Run the following command in Sysbench and use the oltp_read_write load to perform a stress test. Specify the cluster endpoint in mysql-host and configure --db-ps-mode=disable to ensure that all transaction queries are executed as original SQL statements.
sysbench /usr/share/sysbench/oltp_read_write.lua --mysql-host=xxxx.rwlb.rds.aliyuncs.com --mysql-port=3306 --mysql-user=xxxx --mysql-password=xxxx --mysql-db=sbtest --tables=128 --table-size=1000000 --report-interval=1 --range_selects=1 --db-ps-mode=disable --rand-type=uniform --threads=xxx --time=12000 runBefore the test, prepare the data for the sbtest library. In this example, 128 tables are selected, each with 1,000,000 rows of data. The preparation process may cause the instance to scale up. Therefore, after the data is prepared, we recommend that you wait 1 minute until the primary node drops back to 1 PCU before stress testing.
Let's briefly test the effect of 16 threads (--threads=16). From the output of the Sysbench, we can see that when the number of parallel threads is fixed at 16, the throughput (tps) gradually increases and the latency (lat) gradually decreases as time goes by, and they finally reach a stable value. This indicates that PolarDB Serverless improves performance after elasticity is triggered.

Click the Performance Monitoring tab on the left side of the console. Serverless metrics are displayed in the cluster monitoring section. If you set the time range to the last 5 minutes, the following monitoring information is displayed. The number of PCUs rises from 1 to 5 and remains stable. In the process of rising, the CPU usage gradually decreases with the scale-up of resources. Looking at the memory usage curve. Each scale-up causes a spike. This is because each time the PCU increases, the memory resource is scaled up, and the memory usage is instantly reduced. After that, the database starts to use the scaled memory resources to improve the computing capability, such as the buffer pool. Therefore, the usage gradually increases and eventually reaches a stable state.

Stop the Sysbench stress test, wait for a while, and then adjust the appropriate time range and refresh the monitoring. As the stress testing stops, the computing capacity decreases stepwise from 5 PCUs to 1 PCU. First, look at the CPU usage curve. The CPU usage instantly drops to nearly 0. Because the read and write test contains update requests, after the stress testing stops, PolarDB continues to purge undo, which is consistent with the original mechanism of MySQL, and therefore still consumes a few CPU resources. Then, look at the memory usage curve. With each scale-down, the memory usage immediately decreases and then increases by one step. This is because before scale-down, PolarDB first decreases the values of memory-related parameters, such as the buffer pool and the table open cache, triggering the recycling of these caches, and the usage is reduced immediately. After the parameters are adjusted to ensure that the memory resources have been released, the memory of the container will be reduced. When the upper limit of the memory is reduced, the denominator becomes smaller, and the calculated memory usage increases.

Let's try to increase the Sysbench stress by using 128 threads, and see how long it takes for the PolarDB to bounce to the 32 PCU maximum specification. From the output of the Sysbench, changes intps and lat are distinct. Similarly, after the stress testing stops for a while, the PCU automatically scales down. It takes about 42s to scale up from 1 PCU to 32 PCUs, but it takes about 220s to scale down, which is more gentle. Such a design can not only effectively address burst traffic but also prevent frequent scaling when encountering a business with large fluctuations.

Based on the SCC technology, PolarDB achieves high-performance global consistency, enabling lossless read scaling across nodes. Serverless instances enable SCC in all scaled read-only nodes by default For instances of traditional MySQL primary/secondary architecture that consists of one primary node and multiple read-only nodes, binary log-based replication latency exists in read-only nodes. Generally, the read of TP services is not forwarded, and only services that are not sensitive to global consistency are served, such as reports. In addition, as binary log replication only synchronizes the logs of committed transactions, read-only nodes cannot process read-after-write transactions.
In PolarDB, SCC scales read-only nodes with low latency through Commit Timestamp Store (CTS) and transaction status synchronization based on RDMA. At the same time, through SCC coupled with the advanced transaction splitting technology of Proxy, read-write requests cross-transaction, pre-transaction and post-transaction can be easily scaled to read-only nodes of PolarDB, and global consistency is guaranteed. Eventually, the resources saved by the primary node can support more write requests. With the support of SCC, PolarDB Serverless uses a unique cluster endpoint to access the instance. In this case, you are not troubled by cross-node read consistency issues, that is, you do not need to worry about whether the request is directly executed by the primary node or forwarded to the read-only node for execution.
In this section, we verify the effect of the multi-node elasticity. Click Configure Serverless, and change the elasticity upper limit of read-only nodes from 0 to 7. After the previous test ends, check that the PCU of the primary node drops to 1. Re-initiate the same Sysbench stress as in the previous section, that is, the oltp_read_write load with 128 threads. In the previous section, we have seen that the 128 concurrency is enough to allow the primary node to scale up to the maximum of 32 PCUs. Let's see what happens when we adjust the elasticity upper limit of read-only nodes.
sysbench /usr/share/sysbench/oltp_read_write.lua --mysql-host=xxxx.rwlb.rds.aliyuncs.com --mysql-port=3306 --mysql-user=xxxx --mysql-password=xxxx --mysql-db=sbtest --tables=128 --table-size=1000000 --report-interval=1 --range_selects=1 --db-ps-mode=disable --rand-type=uniform --threads=128 --time=12000 runFirst, on the homepage of the console, we can see that the system starts to automatically create read-only nodes after the stress test is executed for a period.

After a while, the system enters a stable state and no longer creates read-only nodes.
After entering the stable state, the output of the Sysbench is as follows. Compared with the result of the previous single-node test with the same stress, the performance is slightly reduced from 34-35w to 32-33w. Personally, I think this is the performance loss of globally consistent reads, which brings the benefit of releasing valuable resources of the primary node.

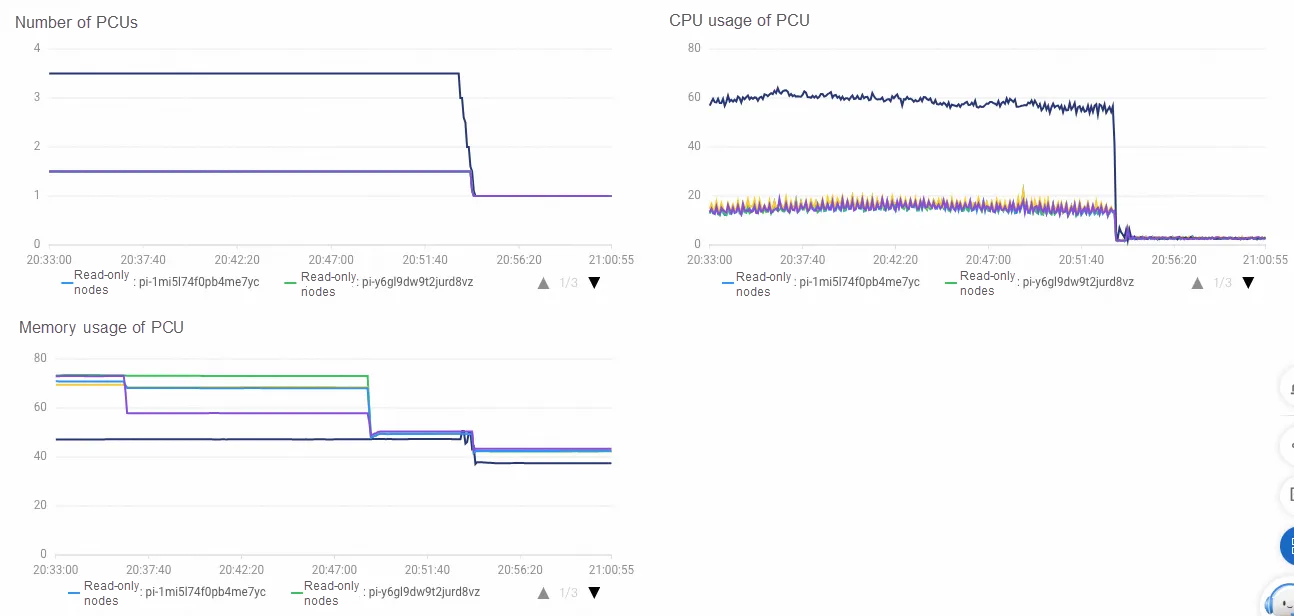
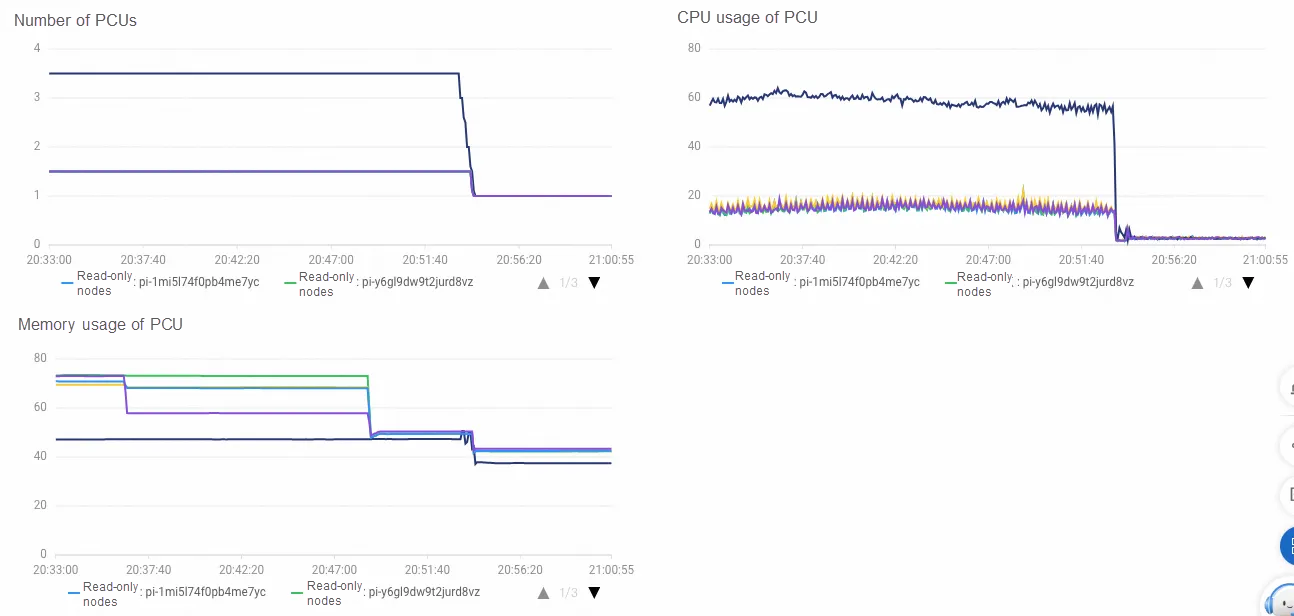
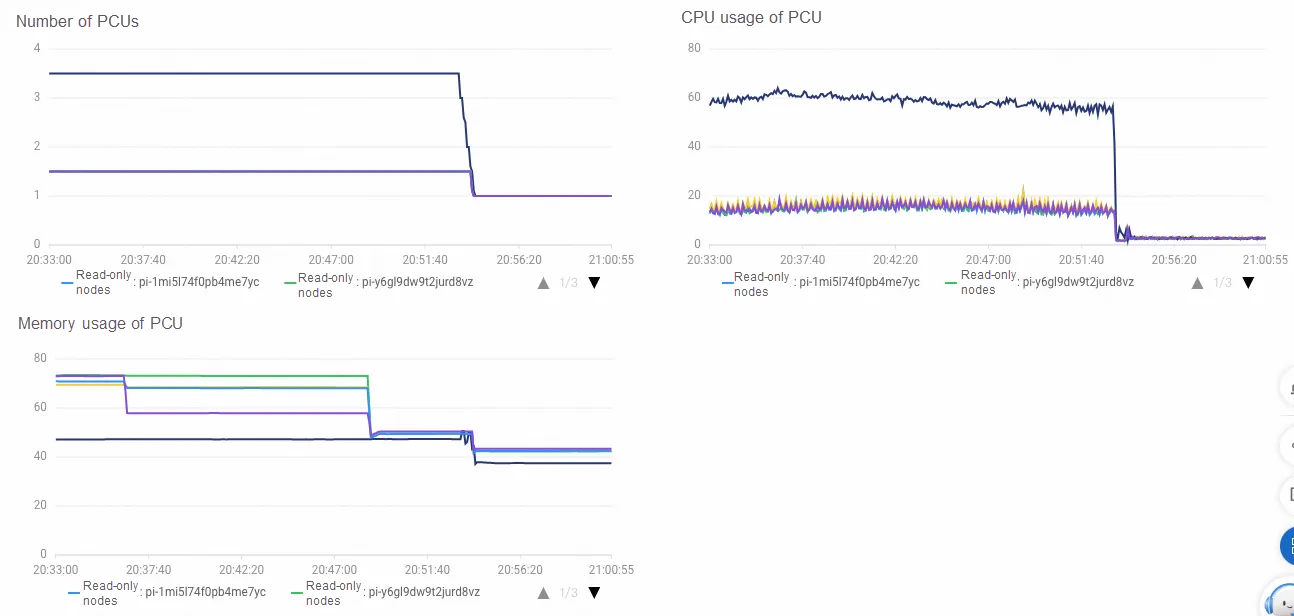
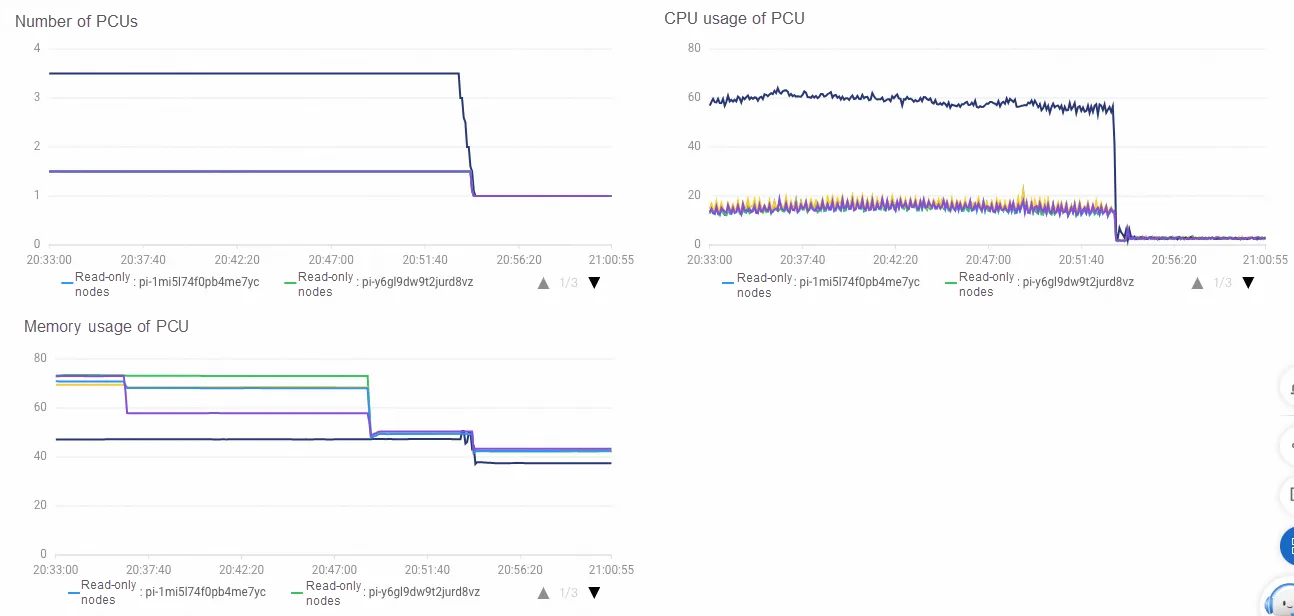
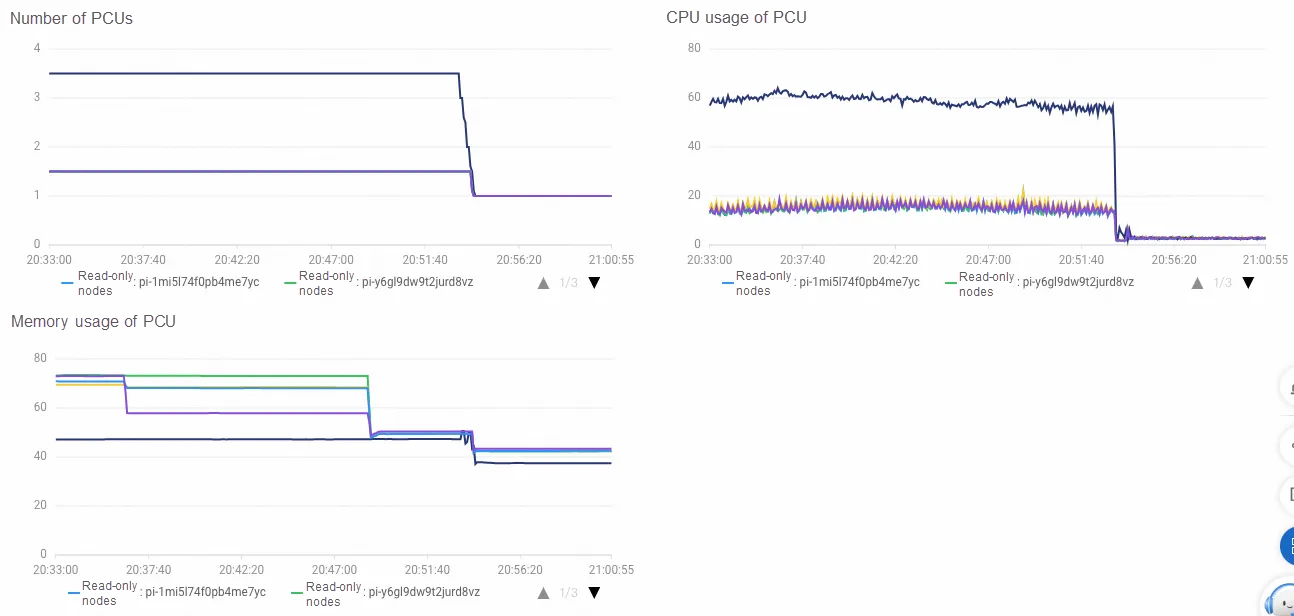
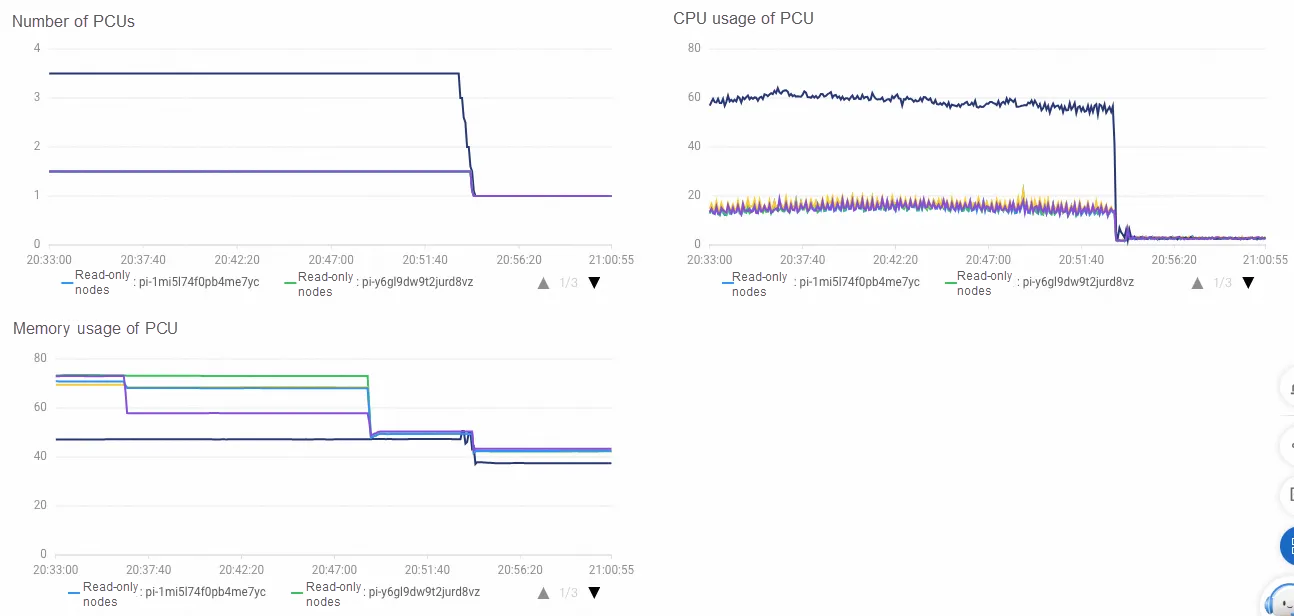
View the Serverless metrics on the monitoring page. The following curves are displayed. At first, the PCU of the master node scales up to 32 quickly. Then, the read-only node is created to bear some of the load, where the CPU usage of the primary node drops and the PCU scales down. As the CPU usage of the scaled read-only node does not exceed the elastic threshold of 80%, only one read-only node is scaled up under the stress.

Next, we try to double the concurrency, stop the Sysbench stress, and immediately execute the oltp_read_write load with 256 threads. Wait for a while, and you will find that the system starts to scale a large number of read-only nodes. At the same time, view the output of the Sysbench. The performance of oltp_read_write has also been greatly improved from 44-46w 32-33w. It has exceeded the maximum throughput of a single node in the previous section in terms of QPS. This means the successful verification of the Serverless scale-out effect.


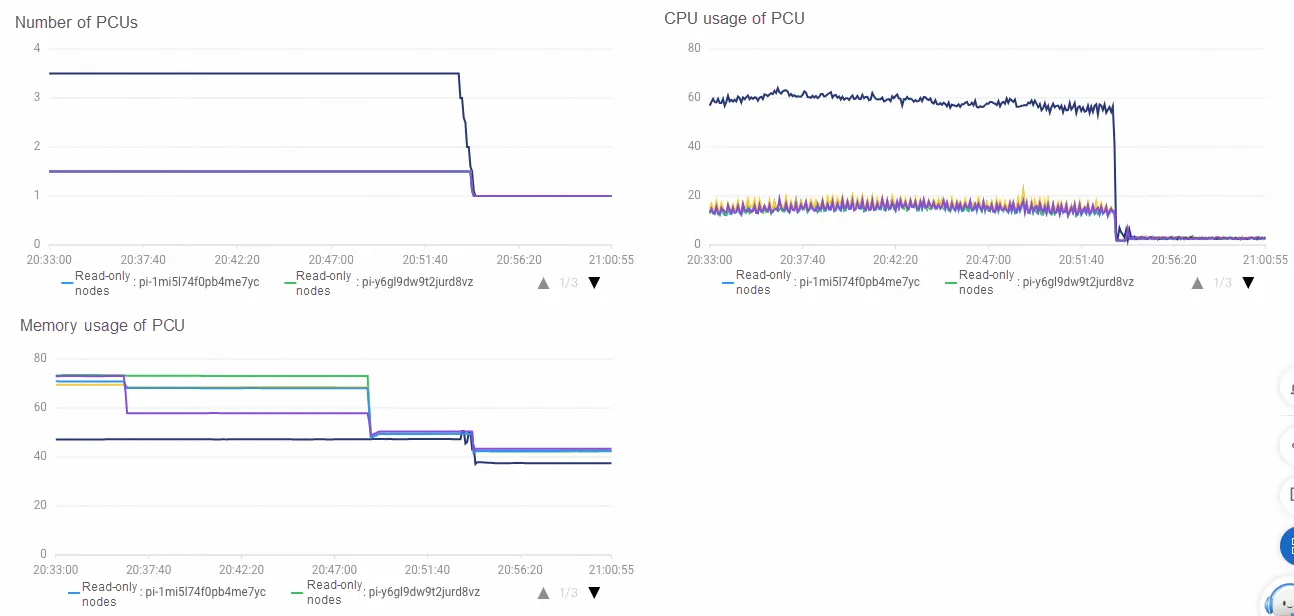
View the Serverless monitoring. Only the curve of multiple read-only nodes is displayed. A distinct phenomenon is that when the read-only nodes are scaled, the previous nodes gradually reduce the load until a rough balance is reached, which indicates that Proxy successfully balances the load to the scaled read-only nodes. Currently, to avoid frequent specification fluctuations in Serverless, the threshold of the scaling is a large range. In addition, the configuration downgrade has certain negative feedback on performance. Therefore, it is difficult to achieve a 100% balance in the Proxy. The final value of the PCU that is downgraded first will be lower.

After running for a period, stop the Sysbench stress testing. The PolarDB compute nodes will be automatically scaled down first, and will gradually reduce to the 1 PCU in about 1 to 2 minutes. After the stress stops, the CPU usage of read-only nodes will decrease immediately, while the primary node still needs to purge undo. It continues to consume CPU for a while, and eventually, the PCU drops to 1. After a long period of time, the scaled read-only nodes will be gradually recycled in 15 to 20 minutes. To avoid frequent elastic fluctuations of read-only nodes, Serverless does not choose to immediately recycle read-only nodes that are not loaded.

This is the end of the PolarDB Serverless elasticity exploration.
Experience PolarDB for MySQL Serverless now and feel free to share your user experience.
[Infographic] Highlights | Database New Feature in March 2024
Starter Guide | Build E-Commerce Web App Using MongoDB and Node.js in One Click
ApsaraDB - January 4, 2024
ApsaraDB - September 16, 2025
ApsaraDB - November 26, 2024
Alibaba Clouder - July 15, 2020
ApsaraDB - August 19, 2024
ApsaraDB - September 9, 2025
 PolarDB for PostgreSQL
Alibaba Cloud PolarDB for PostgreSQL is an in-house relational database service 100% compatible with PostgreSQL and highly compatible with the Oracle syntax.
Learn More PolarDB for Xscale
Alibaba Cloud PolarDB for Xscale (PolarDB-X) is a cloud-native high-performance distributed database service independently developed by Alibaba Cloud.
Learn More PolarDB for MySQL
Alibaba Cloud PolarDB for MySQL is a cloud-native relational database service 100% compatible with MySQL.
Learn More Database for FinTech Solution
Leverage cloud-native database solutions dedicated for FinTech.
Learn MoreMore Posts by ApsaraDB