This article is a part of the One-stop Big Data Development and Governance DataWorks Use Collection.
By Chen Zhen, Product Manager of DataWorks
Before introducing the Data Quality module, we need to understand the importance of data quality.
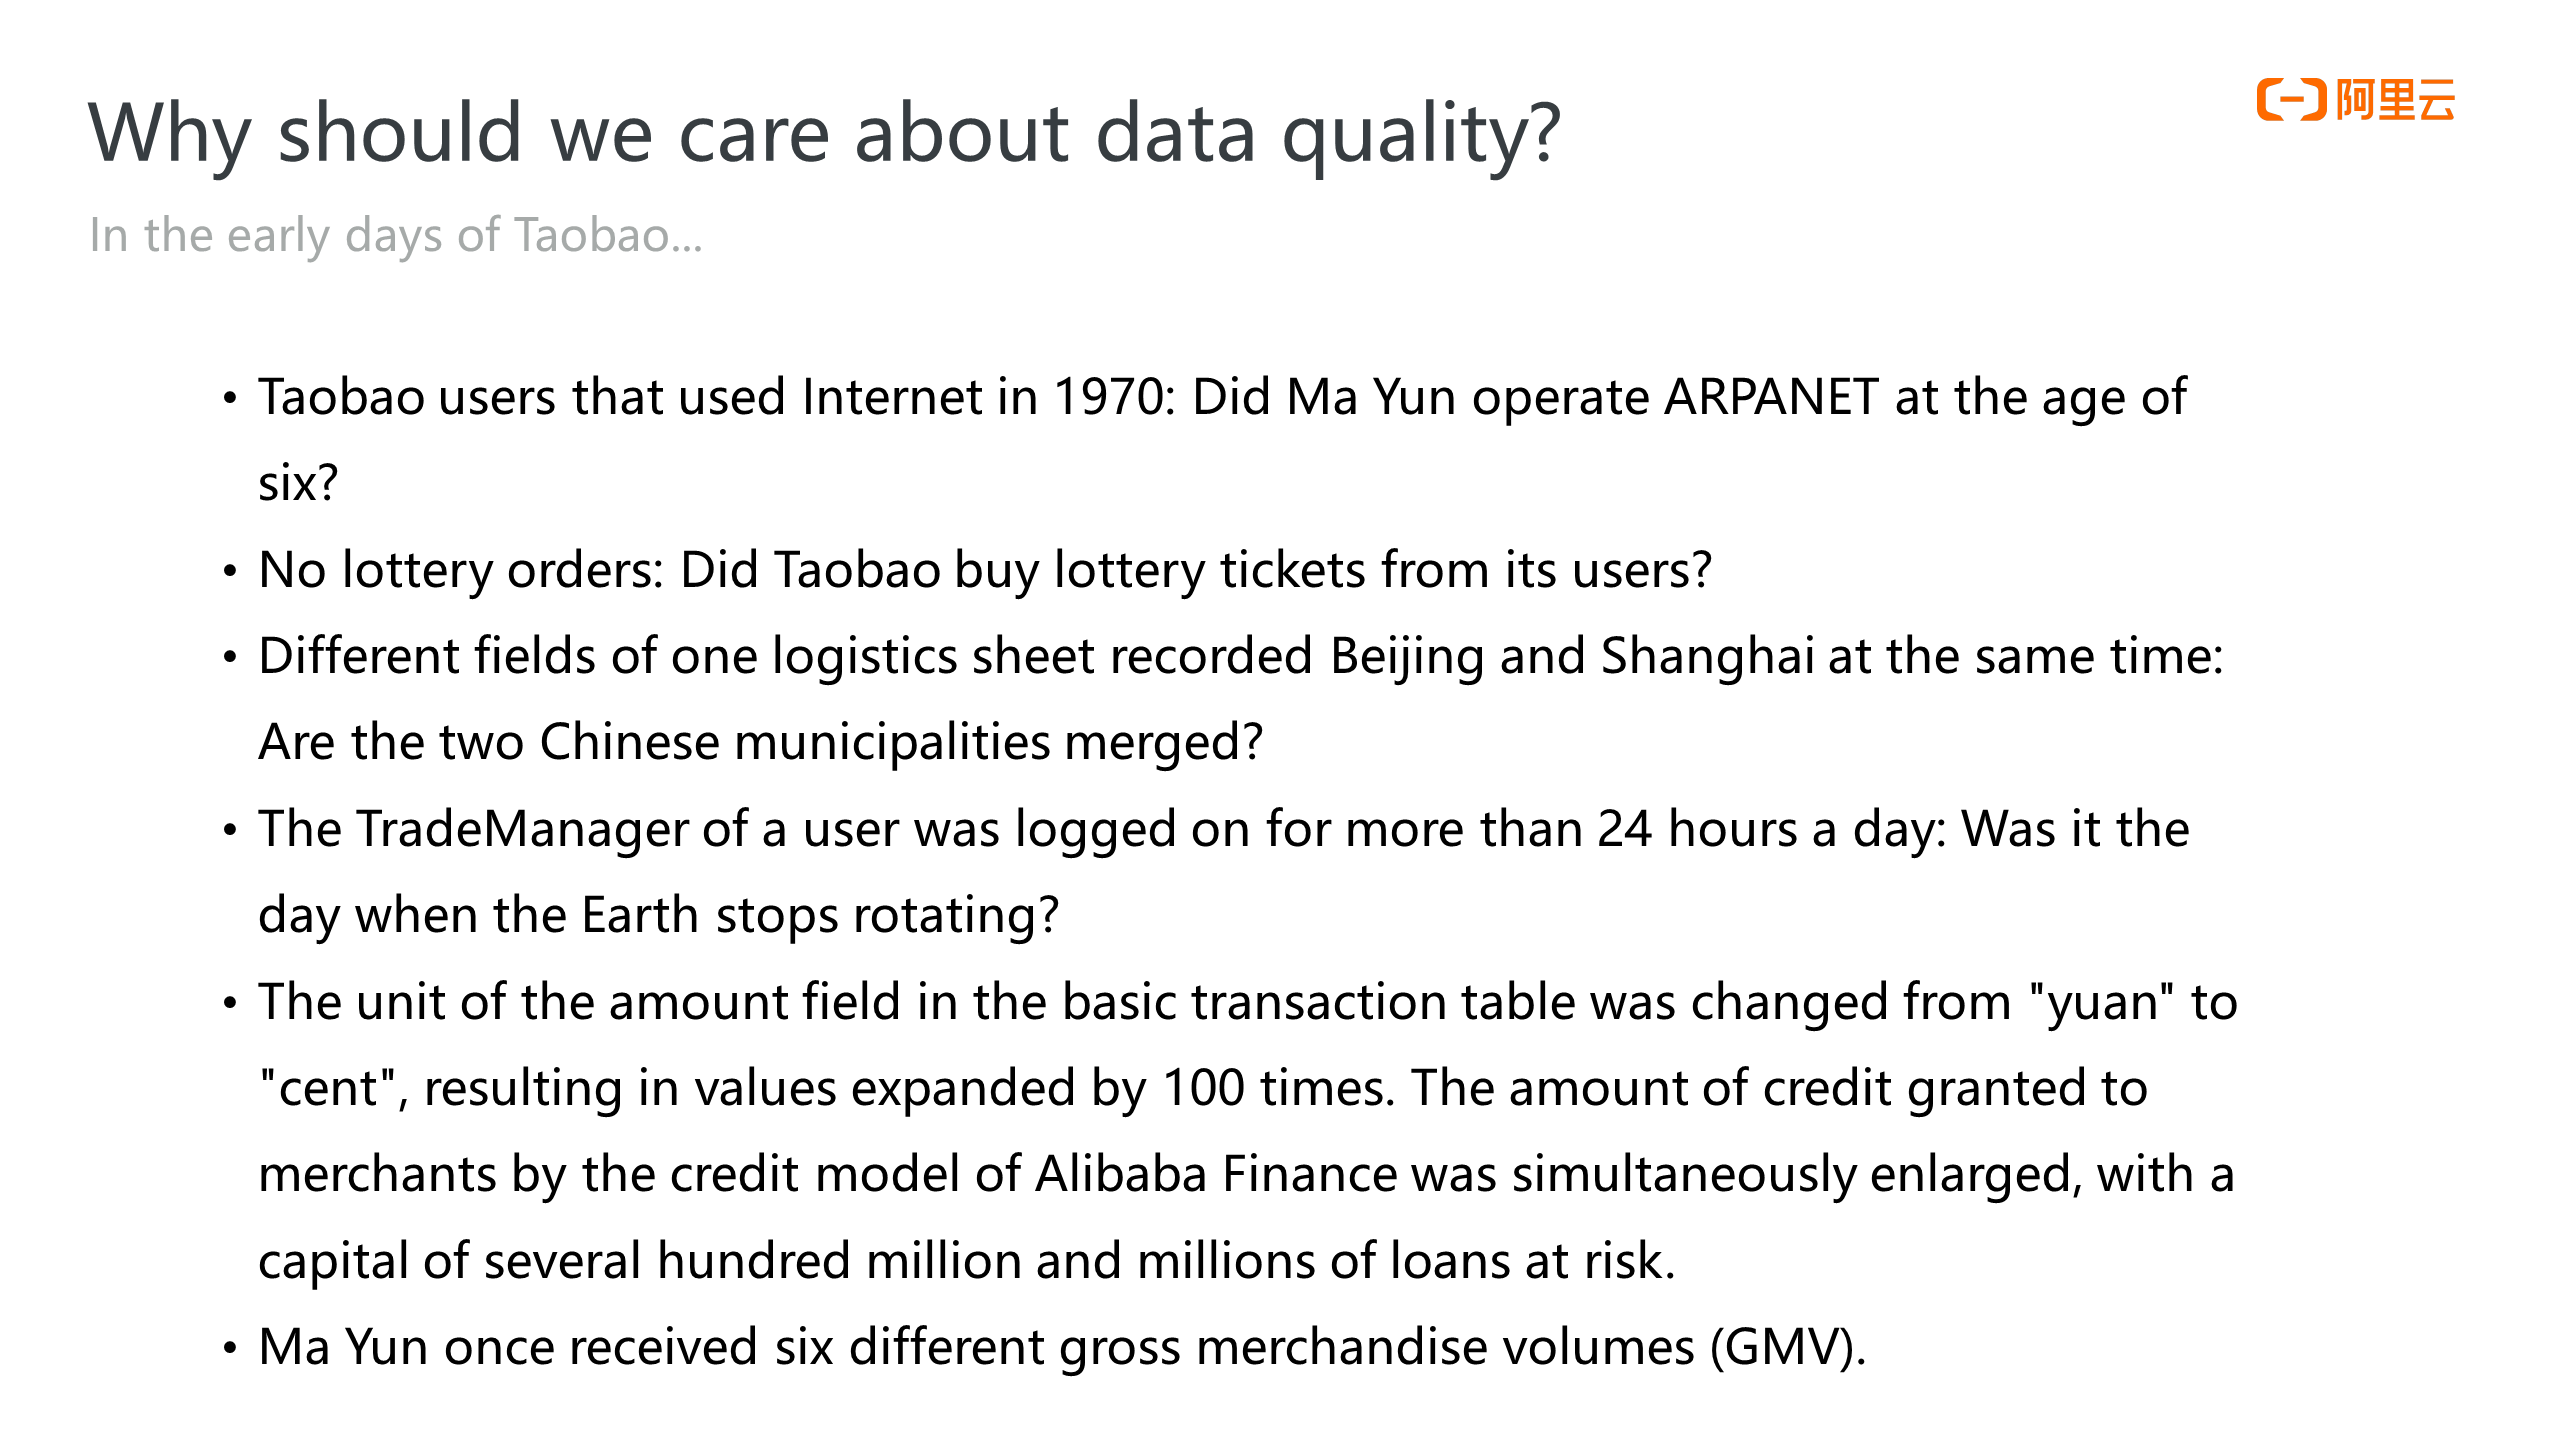
The figure above shows some examples of data quality problems encountered in the early days of Taobao. These examples have something in common; all small data quality problems lead to large errors in business. Some data quality problems are small from the point of view of a data engineer, but the impact on the business is huge. For example, if the unit of the amount field in the basic table turns from yuan to cent, the caliber of the downstream credit model is enlarged, which brings risks to the business.
Data quality problems are simple problems to data engineers, but they are serious problems for businesses. Therefore, data quality is an important part of the lifecycle of data development and governance. Data Quality is also one of the most important modules of DataWorks.
Multiple reasons can cause data quality problems. They can be caused by underlying systems, such as the business system generating dirty data. The data transfer and transformation between the business system and the data warehouse can also be problematic due to inconsistent systems. More often, problems may result from business modifications or different definitions of some data fields in frontend and backend business systems, such as the date format or the amount format. Business inconsistencies are not necessarily reported as errors, so engineers can hardly detect them at the technical level.
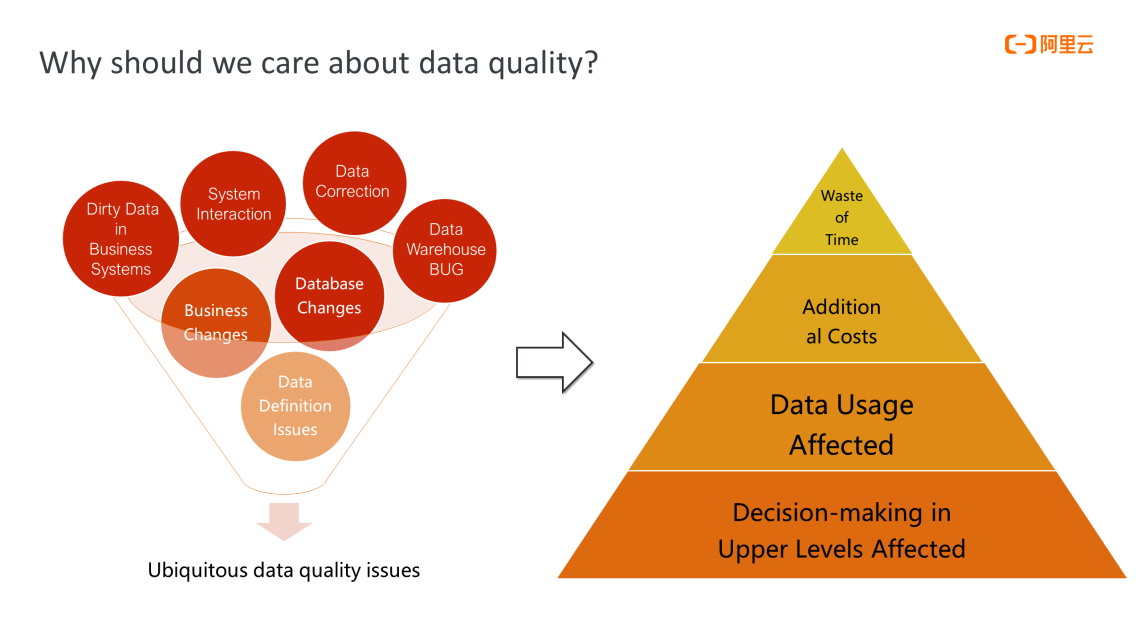
The consequences of data quality problems are serious, as shown in the figure above. Some lightweight problems may only cause a waste of time for data processing, affect the timeliness of data output, or cause waste of costs for data computing and storage. A more serious impact is that business decisions are affected when problematic data flows into upper-layer applications.
Data Quality is an important part of the DataWorks layout and the core of Data Governance. Data Quality relies on the underlying unified metadata services and task scheduling services.
The Data Quality module of DataWorks has three features:
1. It is deeply integrated with data development and scheduling, which differentiates it from other data quality products on the market.
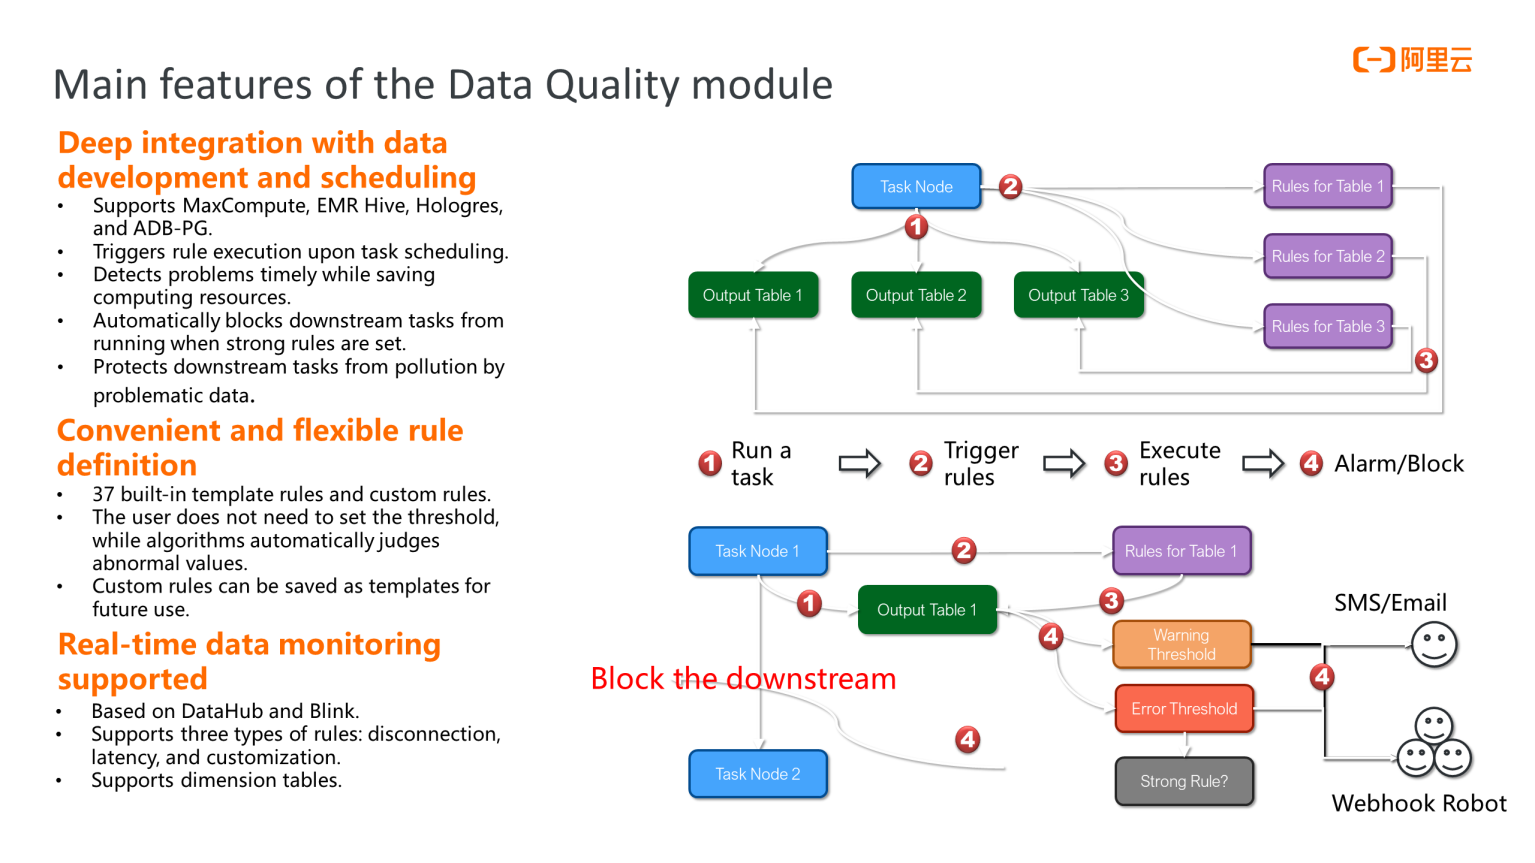
2. Data Quality supports convenient and flexible rule definition.
3. Data Quality supports real-time data monitoring.
The following figure shows the functional architecture of the Data Quality module, which is divided into two parts: offline and real-time.
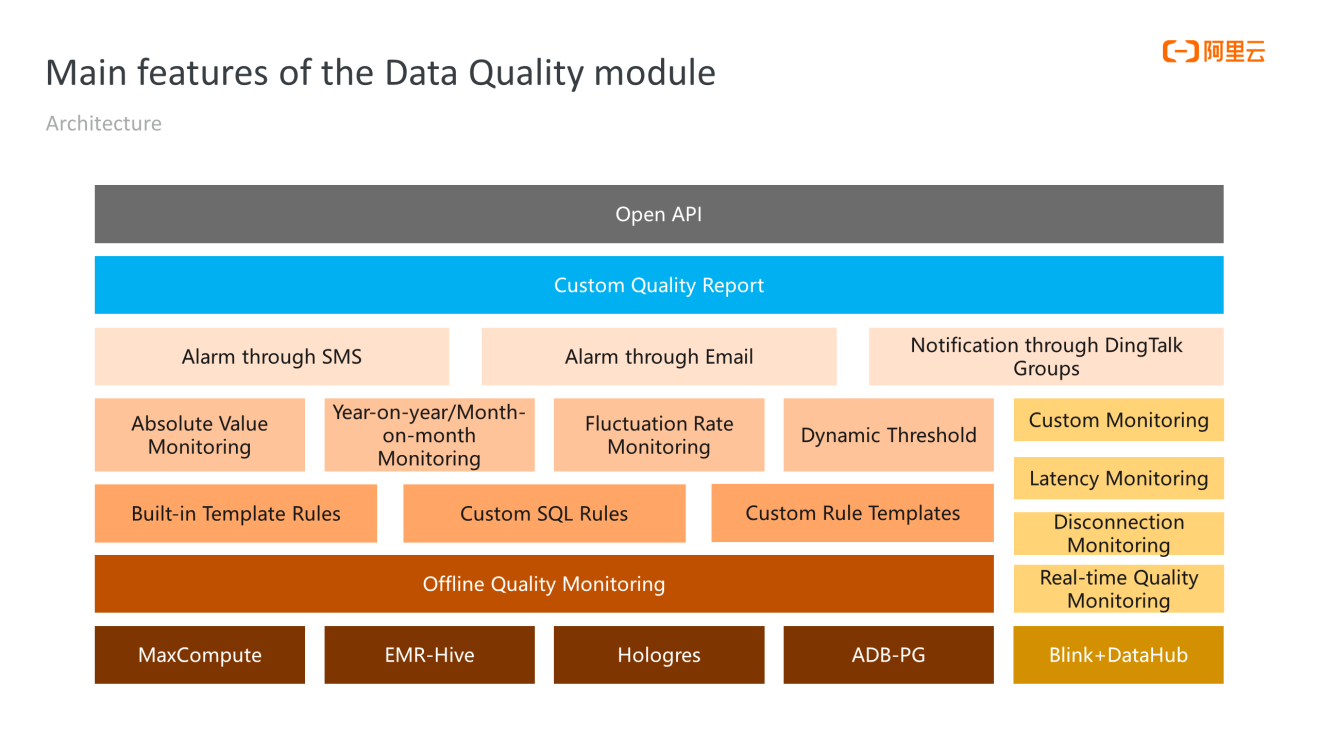
Offline data quality monitoring supports four engines: MaxCompute, EMR-Hive, Hologres, and ADB-PG. It supports built-in template rules, custom SQL rules, and custom template rules. All rules support four monitoring methods: absolute value monitoring, year-on-year/month-on-month monitoring (compared with the last business cycle), fluctuation rate monitoring, and dynamic threshold monitoring. Alerts about data quality problems can be received through SMS, email, and DingTalk groups. These problems and metrics are also aggregated into a custom quality report, which is sent periodically through email or displayed on the web page in real-time.
The Data Quality module supports the Open API. You can perform a set of operations, such as the CRUD of objects. This includes rules, partition expressions, and subscribers through the Open API.
Data quality rules are bound to scheduling tasks. How can we bind a rule to a task?
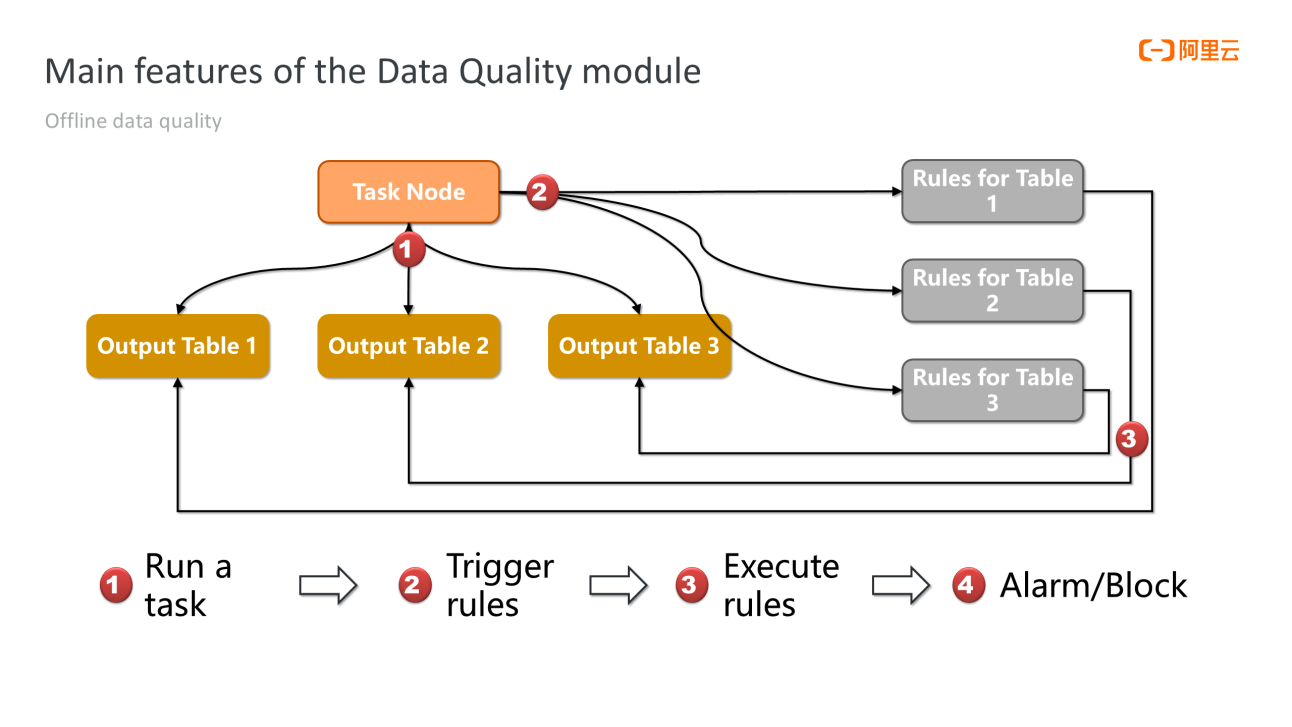
First of all, each rule has a table to be scanned. The rule needs to be bound to a specific task node. We recommend choosing the task node that produces the table. For example, the task is written by a certain SQL script. Data is written into the table through the task node every day or hour. Thus, we recommend binding the monitoring rule to the task so that the rule is automatically triggered and the table is scanned right after the task is executed. This is the best way. If a problem occurs with data, it can be detected as soon as possible. If the problem is serious, further measures will be taken. As shown in the following figure, when the task node is scanned, and a problem is detected, a warning or an error threshold is generated at the same time. Either threshold triggers an alert to be sent through SMS, email, or DingTalk. If it is an error threshold and the rule is strong, downstream task nodes are blocked to prevent the spread of problematic data and avoid the waste of computing resources.
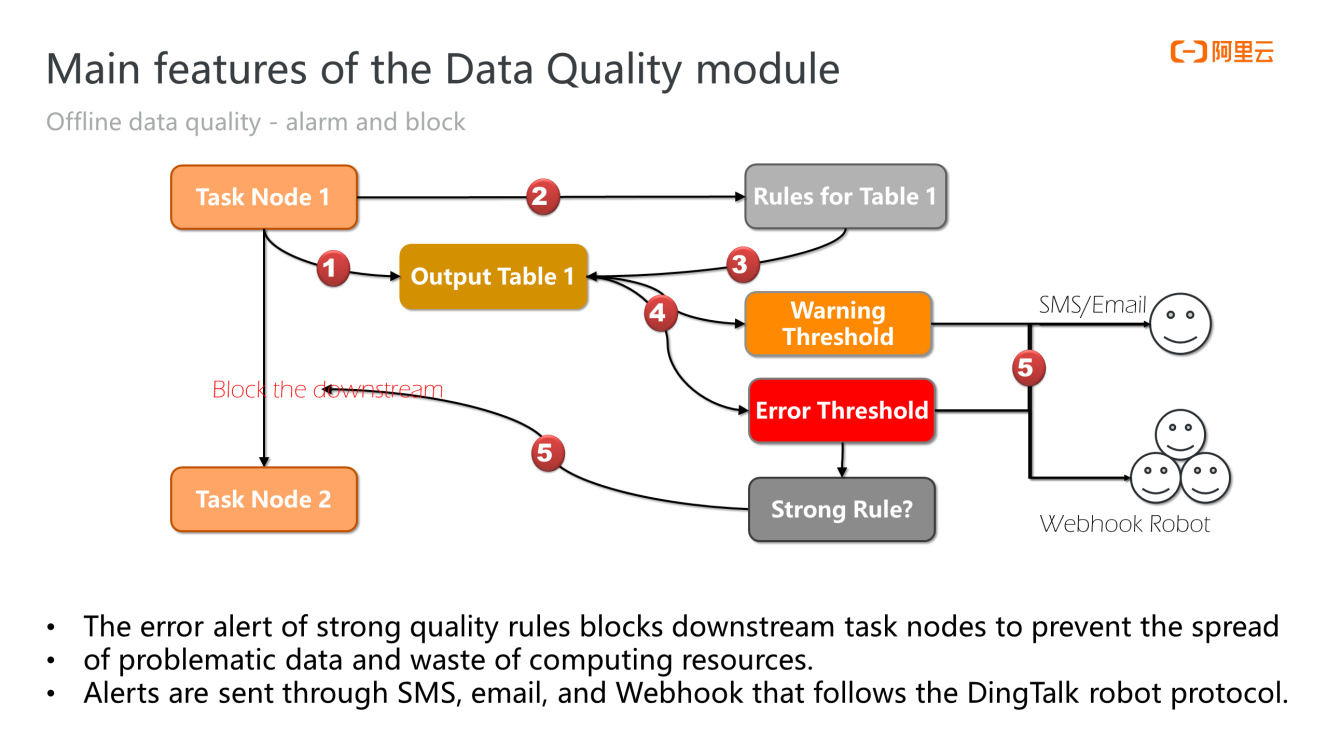
This is the unique feature of offline data quality monitoring.
The following figure shows 37 template rules supported by data quality monitoring. The template rules can be divided into the numeric type and the fluctuation rate type. The numeric type monitors a specific metric, such as the number of rows in the table, the maximum value of a field, or the minimum value of a field. A fluctuation rate rule compares with historical trends. Historical metrics are stored in the backend, which allows users to determine whether the metrics are abnormal based on historical fluctuations.
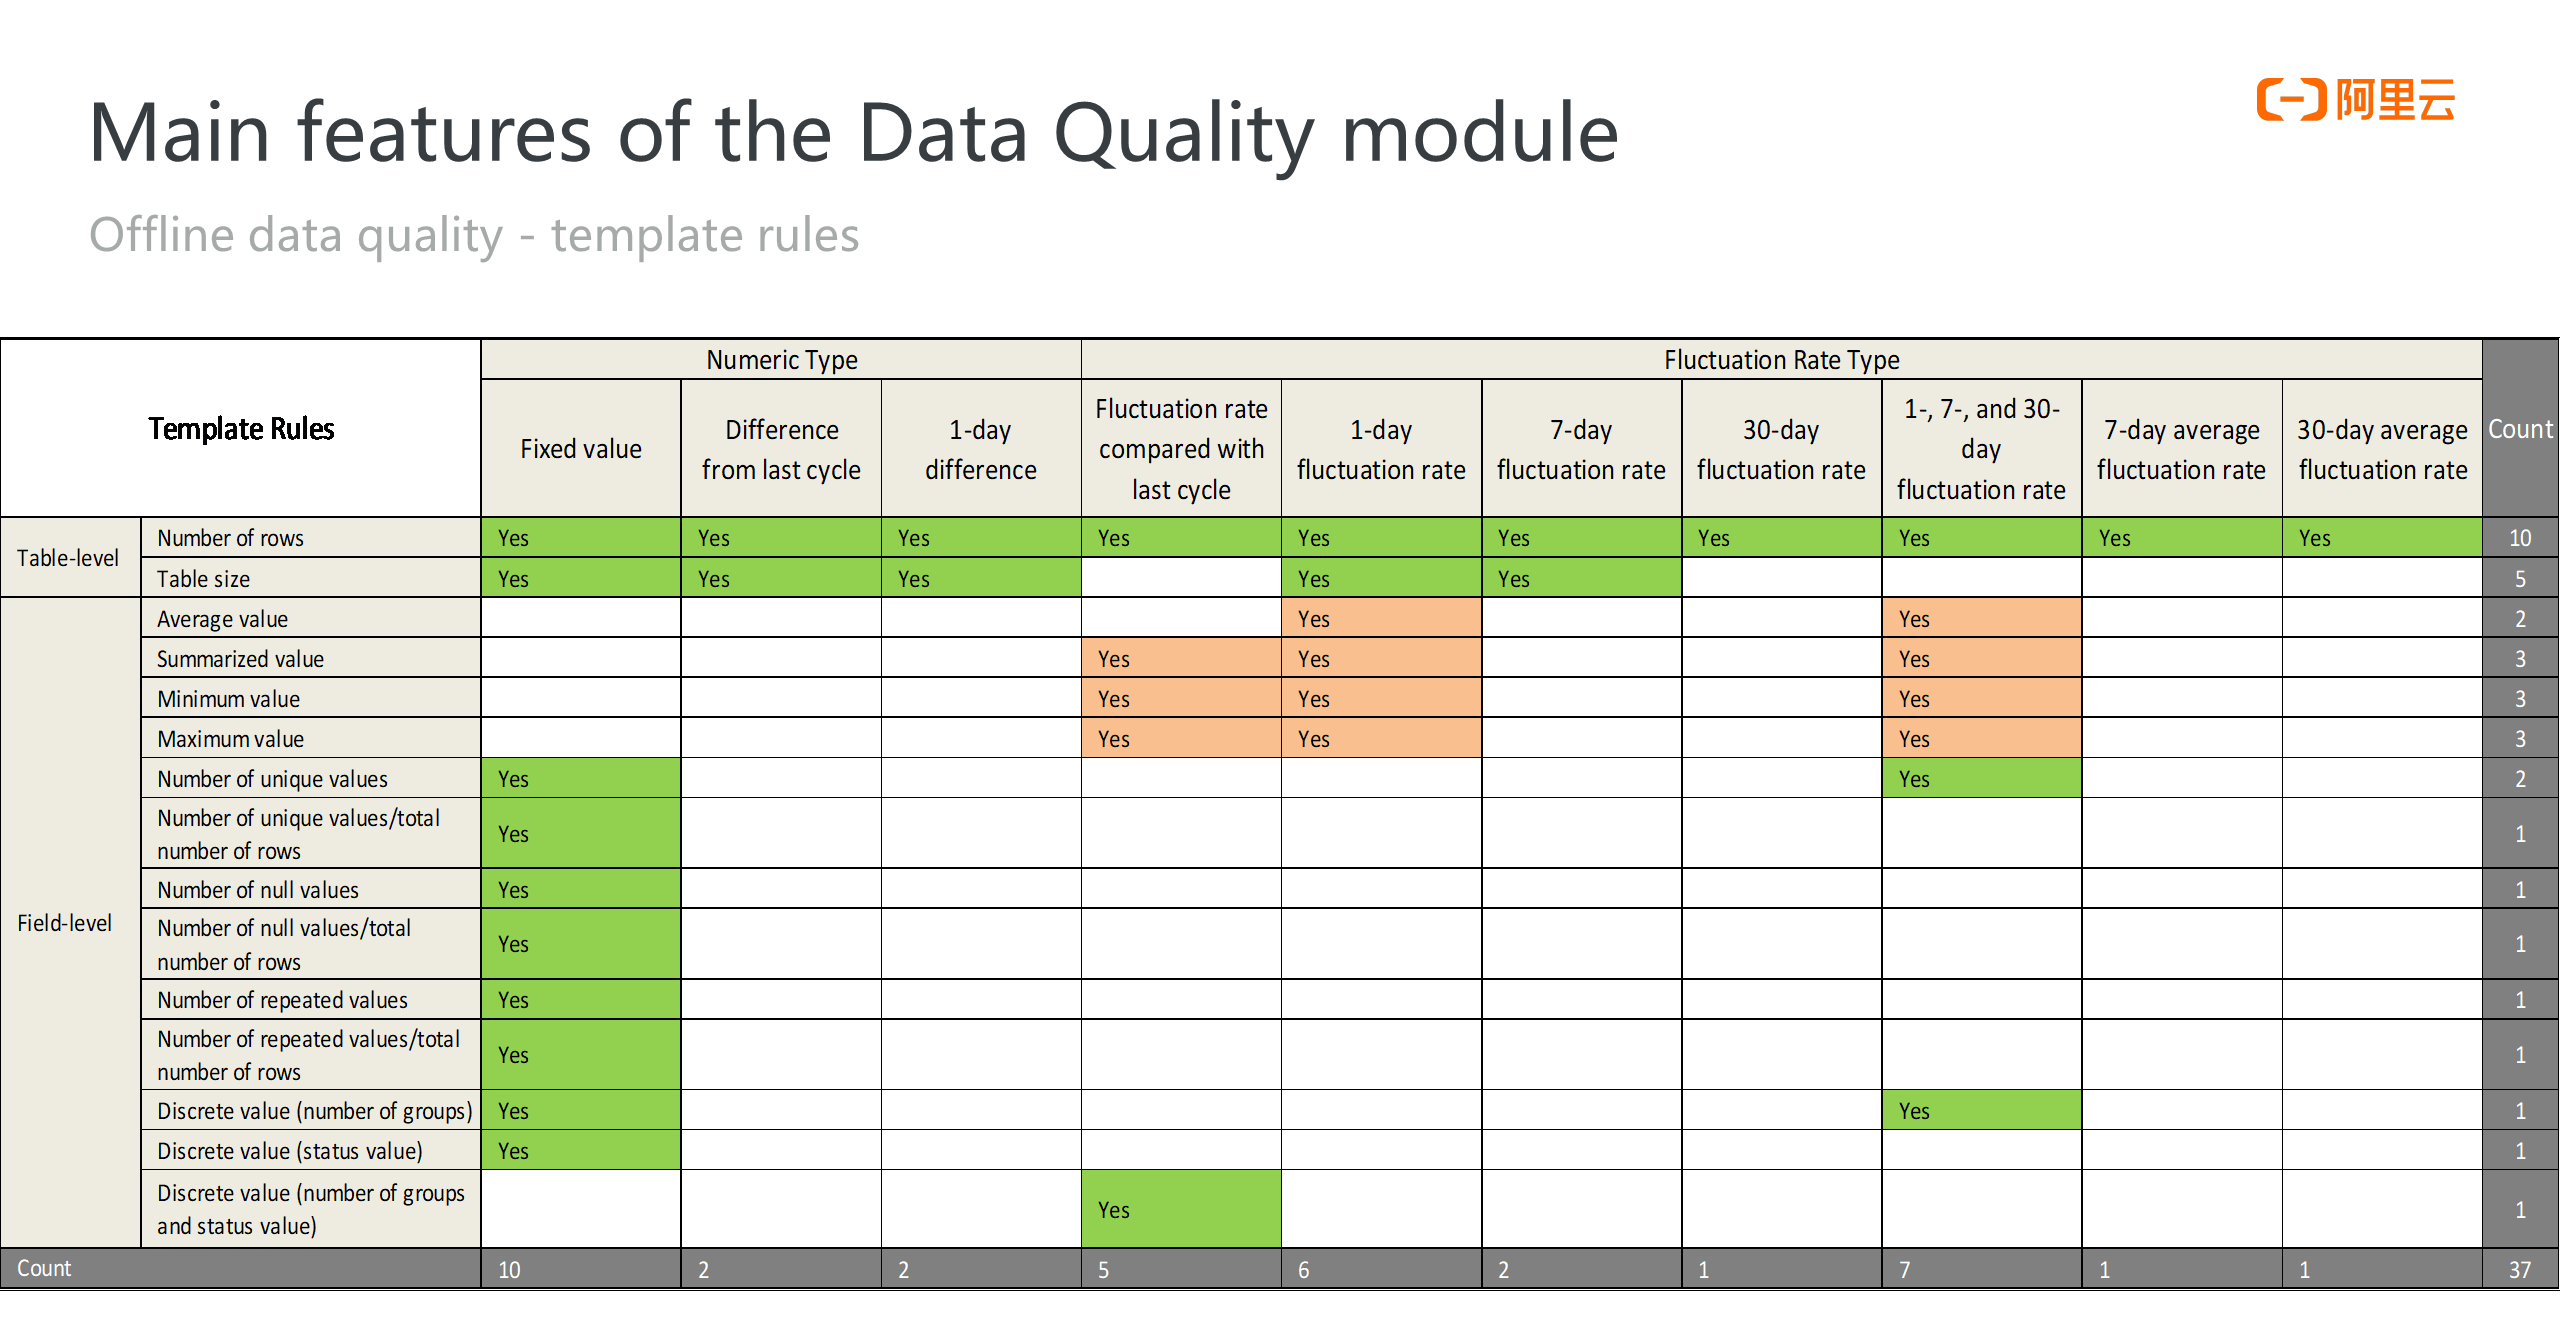
Data quality monitoring also supports custom SQL statements to define data quality rules. The defined rule supports verification for numeric and fluctuation rate types.
As businesses propose higher requirements for data timeliness, the concept of real-time data warehouses is becoming more popular. Problems in real-time data are much more difficult to troubleshoot and solve compared with those in offline data.
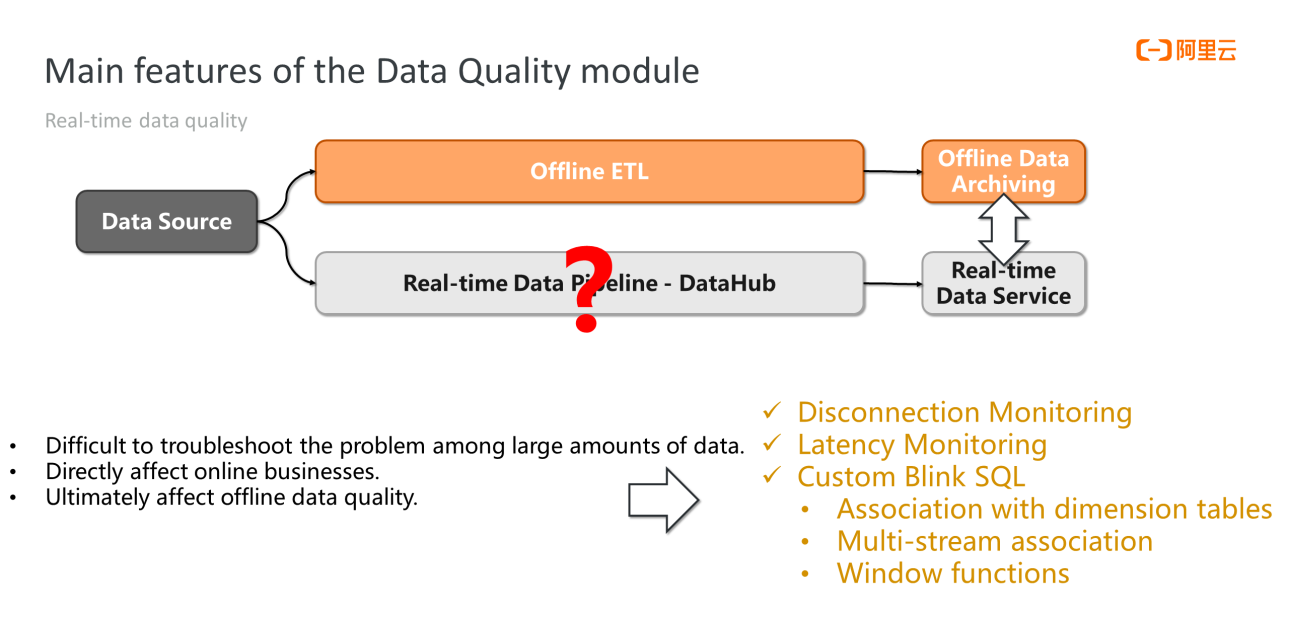
The throughput of real-time data is large. The problem is difficult to troubleshoot among large amounts of data. Therefore, an automated monitoring system is needed. In addition, quality problems of real-time data directly affect online businesses. Problems of offline data allow a buffer period to be repaired while real-time data problems are directly reflected in online businesses. Therefore, quality problems of real-time data are more sensitive than the problems of offline data. Since data is archived to offline data warehouses, quality problems of real-time data ultimately affect offline data quality.
The Data Quality module of DataWorks supports three methods to monitor real-time data quality. You can use Data Quality to monitor disconnections and latencies. You can also define data quality rules at the business layer with custom SQL statements.
A disconnection means the volume of data flowing in the data tunnel for a period of time is lower than expected. The user can set the threshold for the disconnection. When the difference between the value of the timestamp field in the data stream and the time displayed by the system clock is too large, the data is delayed, and the timeliness of the real-time system has been lost.
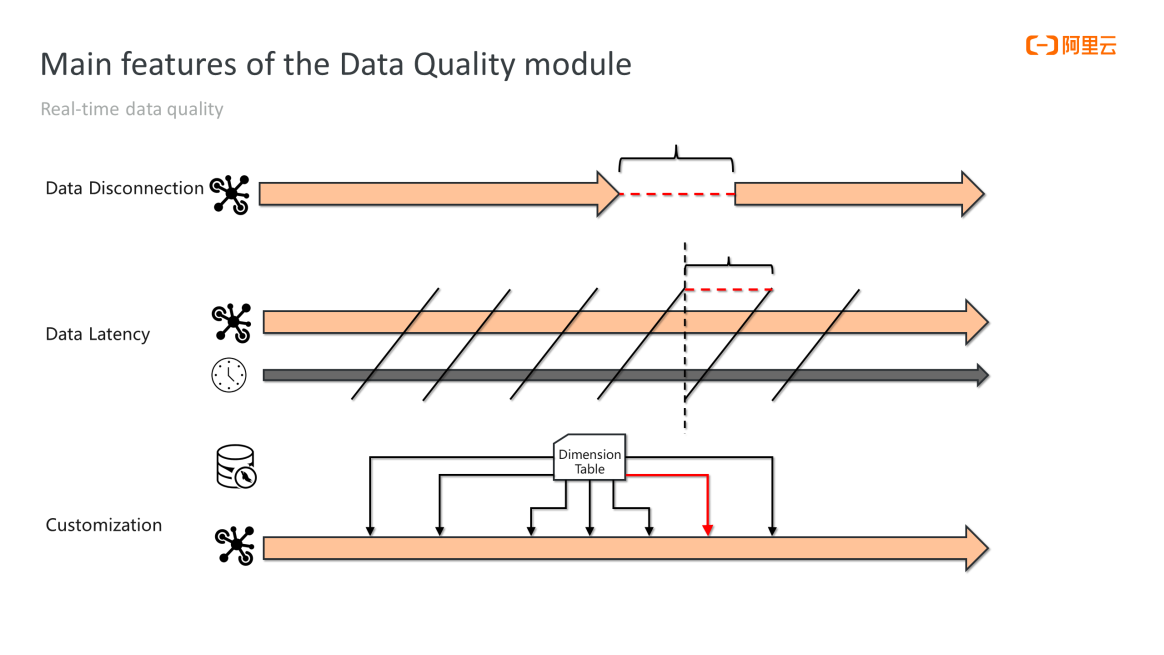
Custom SQL rules are more flexible. The user can reference a dimension table to associate with real-time data or reference two real-time data procedures for dual-stream or multi-stream join. Specifically, rules are related to the actual scenario of the business.
Offline quality check is performed on a graphical user interface.
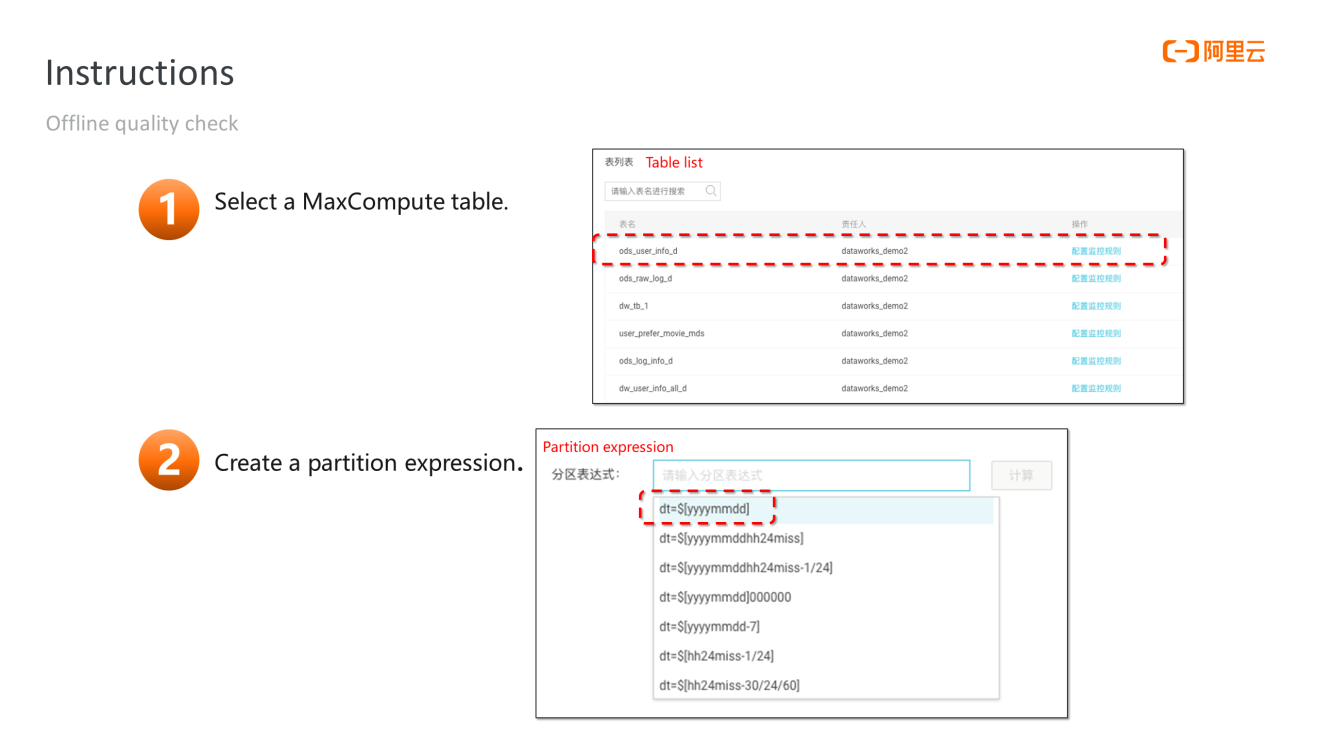
Let's take data monitoring on MaxCompute tables as an example. Select a table first and then define a special object value called partition expression. In an offline system, data is written to different partitions each time. In most cases, partitions are related to time or the date of business. Therefore, the latest data is only written to the latest partition. The purpose of defining partition expressions is to limit the quality monitoring scope so the system can only scan the latest partition every time. The name of the latest partition is defined differently in different tables, so a partition expression is required to define the latest partition name. This definition is flexible and has a complete variable system.
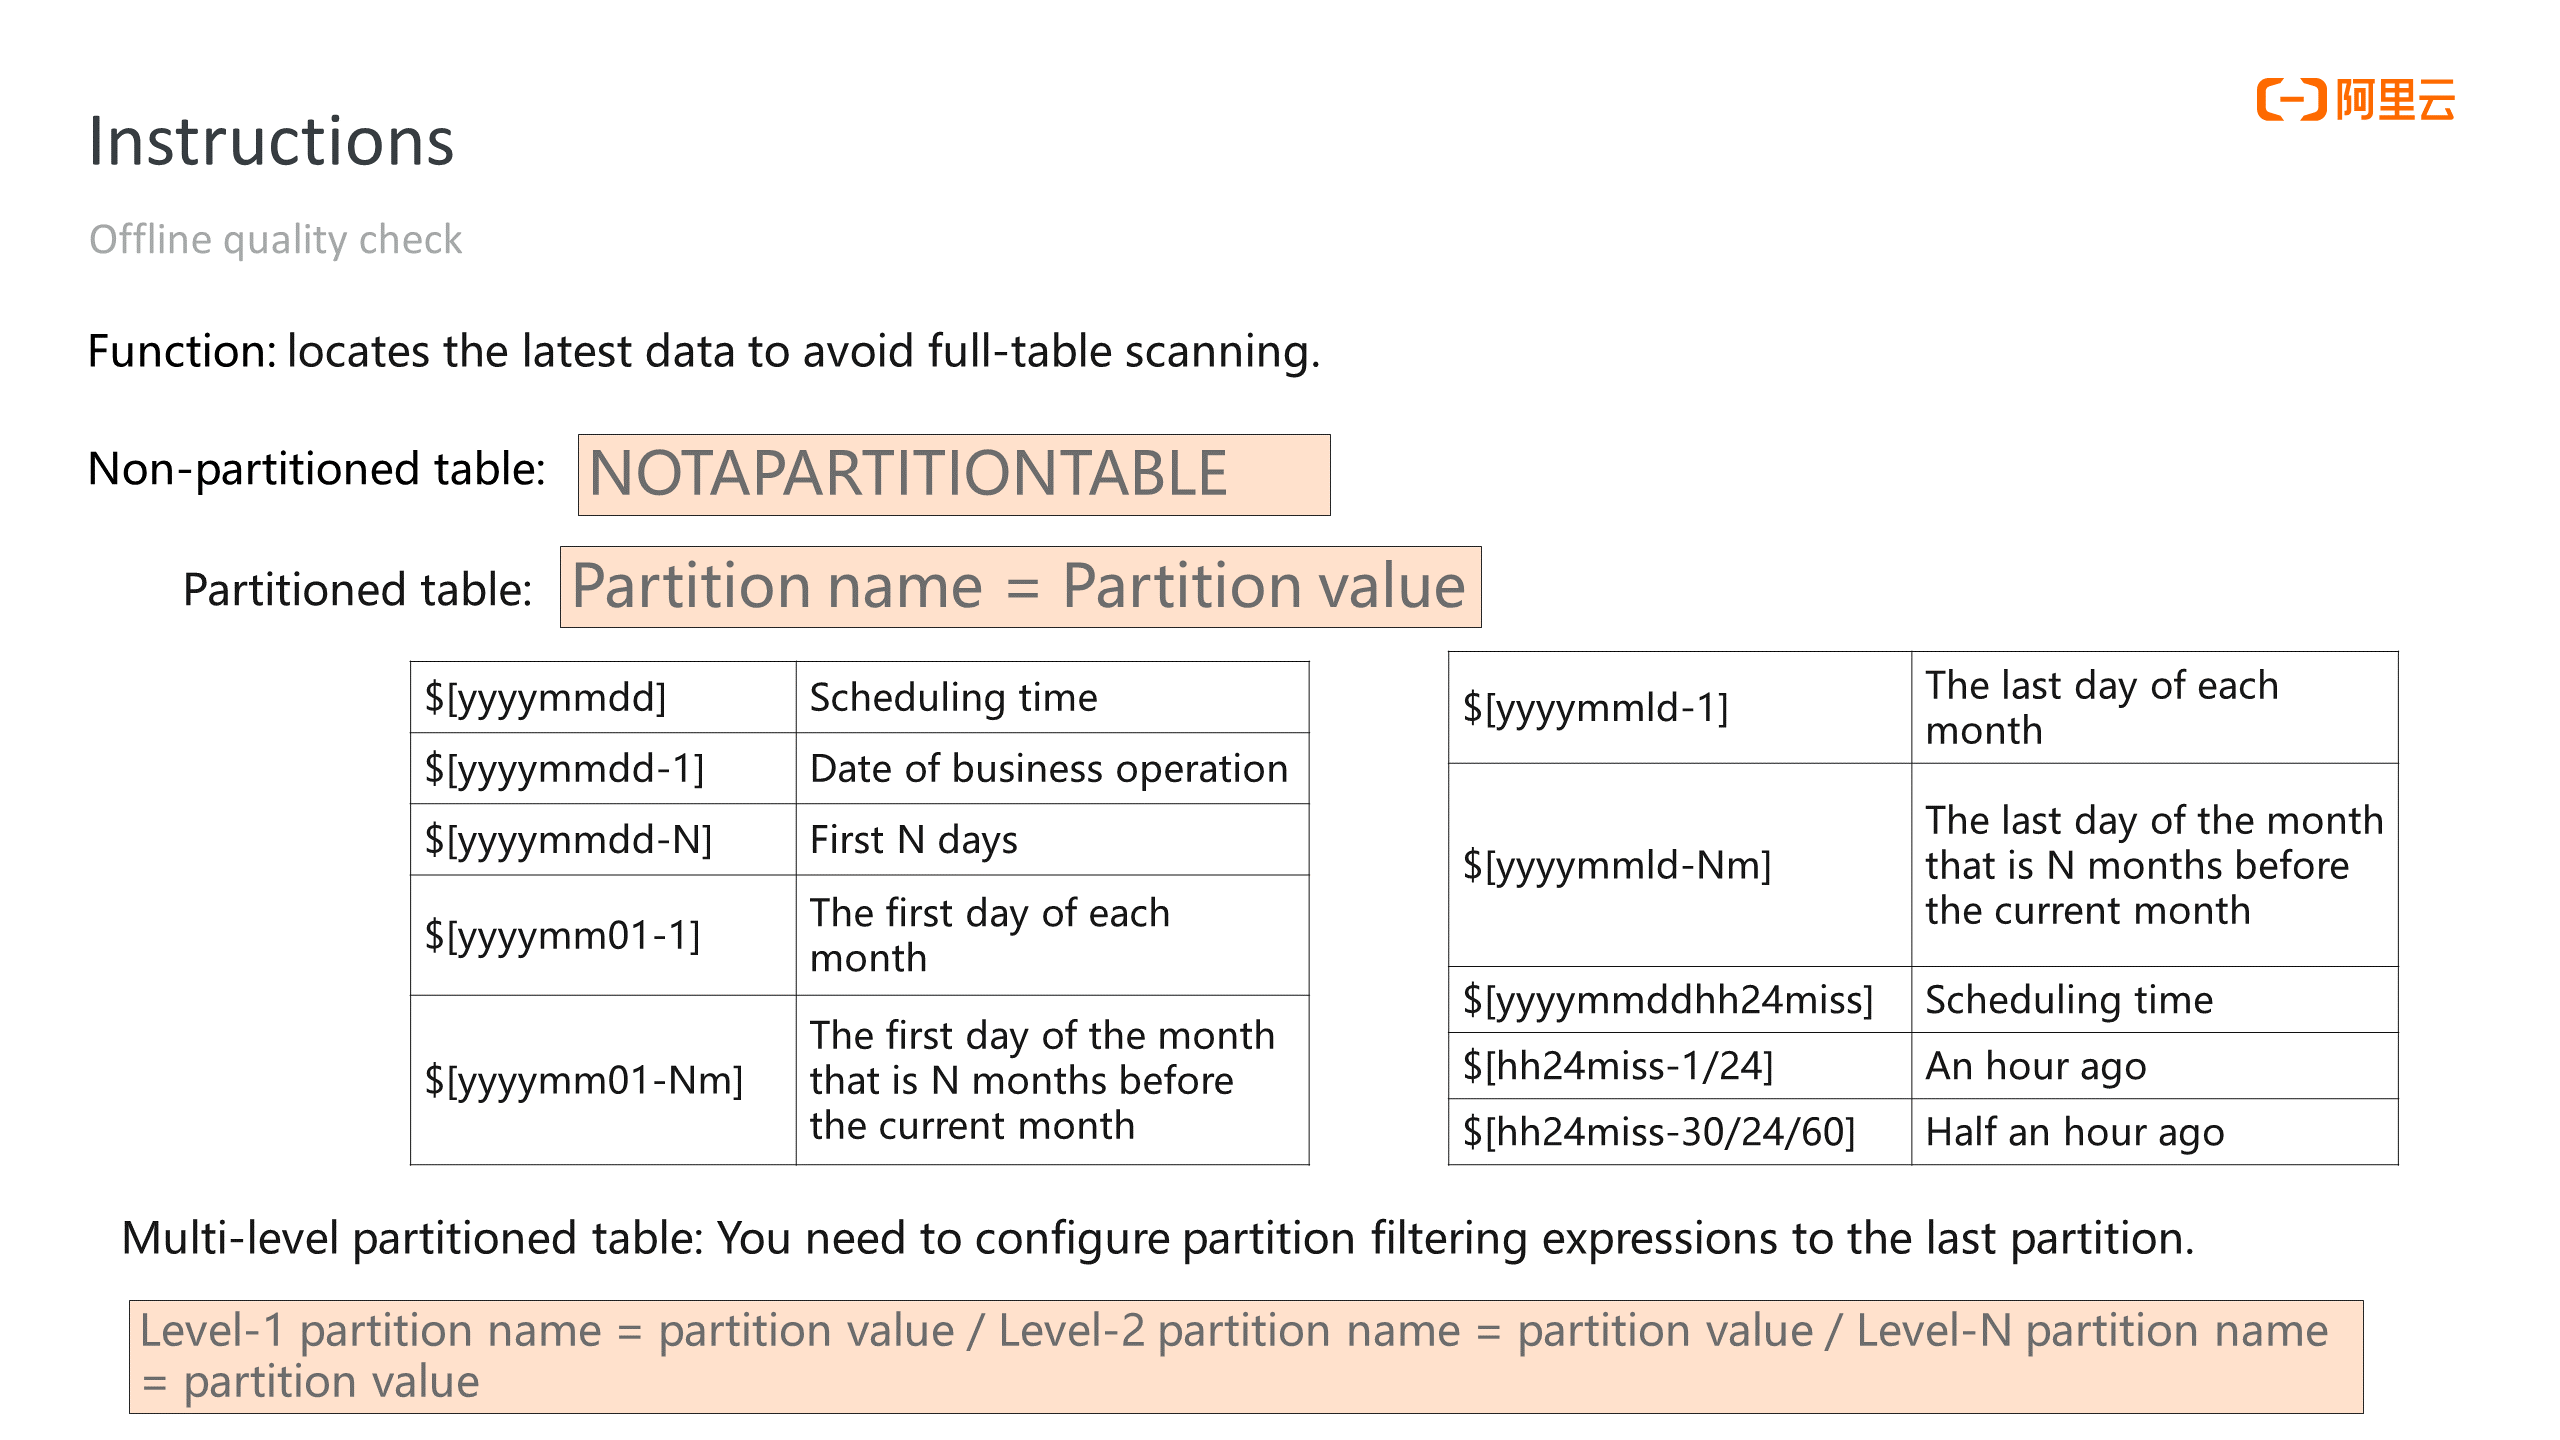
The most commonly used variable is $[yyyymmdd-1]. Full business data is usually processed the next day, so the partition name of the latest business date is the date of the previous day. The date is therefore reduced by 1. The hour variable is in the form of $[hh24miss-1/24], indicating the previous hour.
After the partition expression is created, the user can create a data quality monitoring rule under the corresponding partition expression.
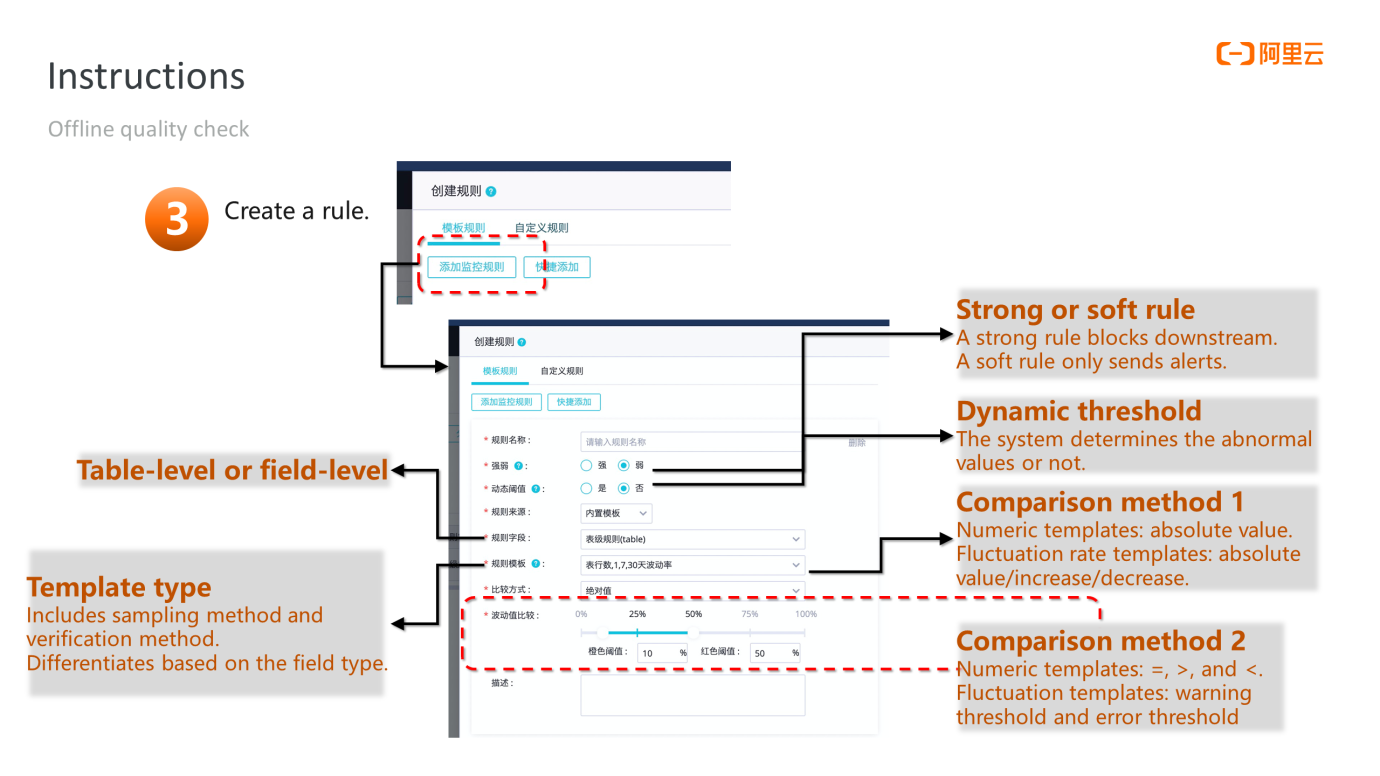
Click Add Monitoring Rule under Template Rules to add a built-in template rule. Detailed configuration items are shown in the figure above. Strong rules block downstream procedures, while soft rules only send alerts without blocking downstream procedures. Dynamic threshold indicates that you define whether the system determines abnormal values. The user can select Table-level or Field-level in the drop-down list of Rule Field. A field-level rule is a rule that can be accurate to a specified field.
Rule Template includes the sampling method and verification method, which can vary according to the field type. Comparison method 1 and comparison method 2 are the comparison methods of numeric templates and fluctuation rate templates.
If the template rule does not meet the requirements of the user, the user can set custom rules. Custom rules are easy to create. Select Custom Rules on the Create Rule page, write down your SQL statements (SQL statements that meet certain rules can be accepted), and add the rule description.
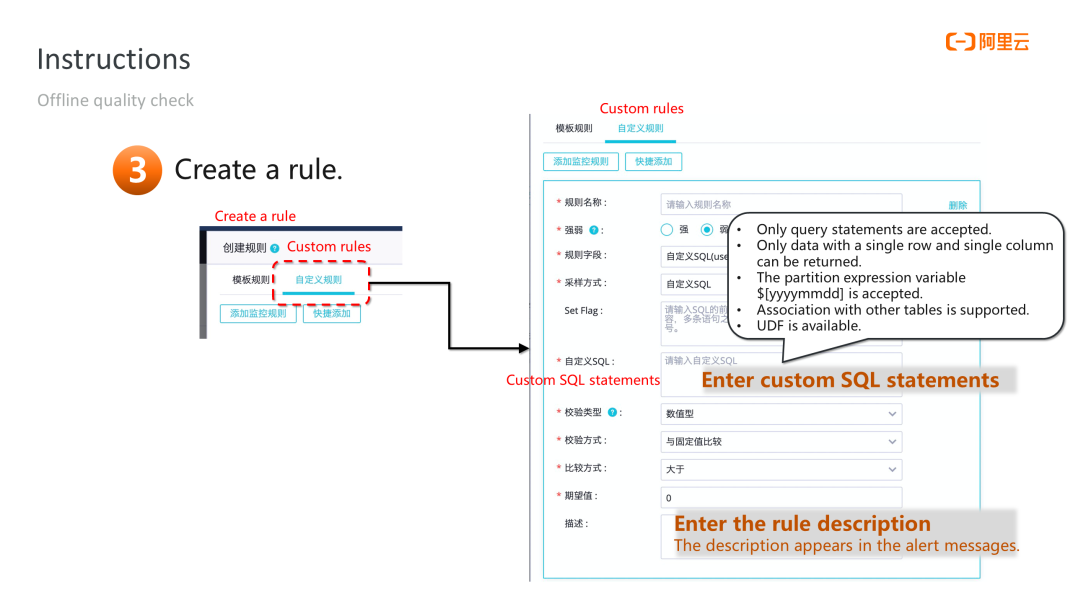
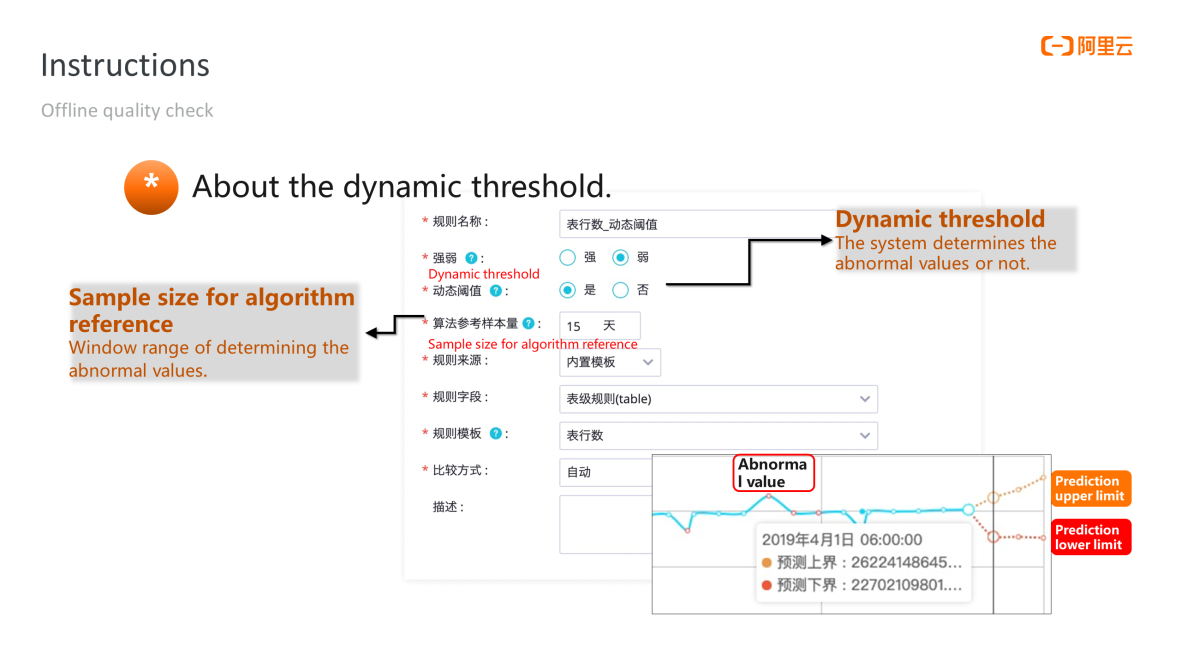
Two features of offline quality check:
The first is the dynamic threshold feature. If Yes is selected for Dynamic Threshold, the user needs to configure the rules of the dynamic threshold method. The user does not need to set a threshold value but the sample size for algorithm reference instead, which tells the system to pay attention to sample data within a certain number of days. Then, the smooth algorithm is used to determine whether the metric point is within the expected range. If yes, it is a normal value. Otherwise, it is a problematic value.
The second is the custom template feature, which is the advanced version of custom rules. We have explained how custom rules work. Consider the following scenario. The user needs to check a large number of tables with custom rules. The configuration workload is heavy, and the management of SQL statements for custom rules is also difficult. The feature rule template library is useful. It turns a custom rule into a template, which can be used as easily as a built-in template.
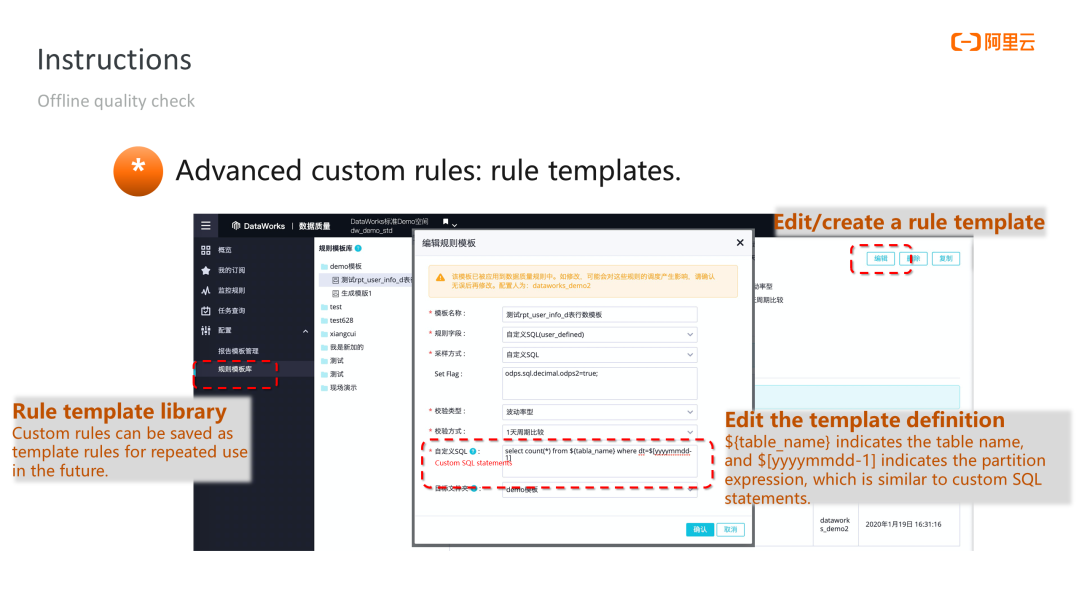
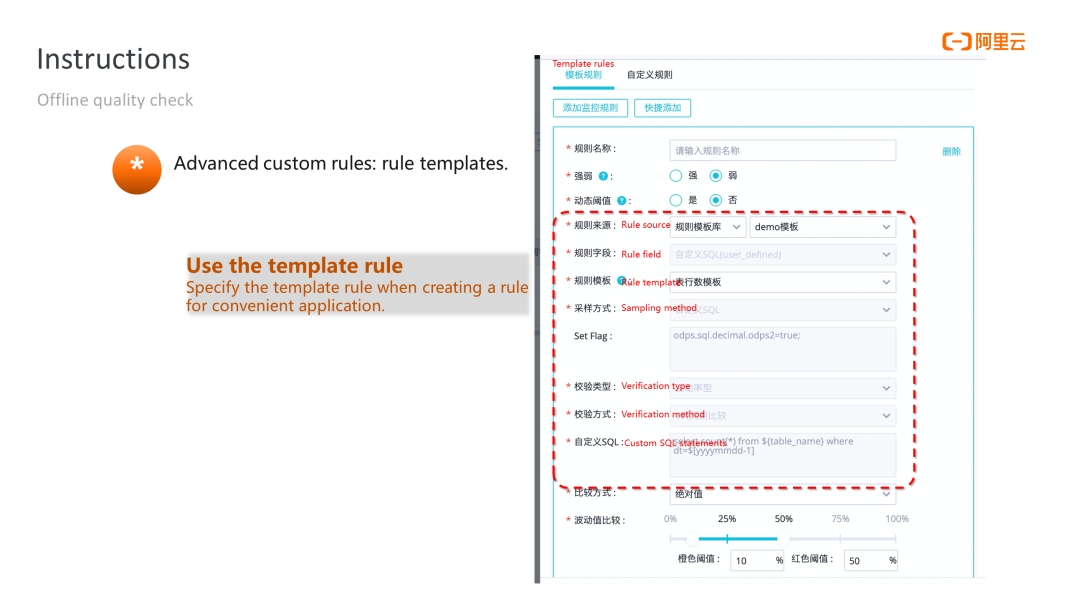
Go to the Data Quality page and click Rule Templates. The directory tree of the template library appears. Then, the user can create a rule template and configure it like configuring an SQL rule. The only difference is that ${table_name} and $[yyyymmdd-1] can be used to refer to the table name and the partition expression, respectively. When the user needs to use the rule template, select Rule Template Library and the rule template created from the Rule Source options.
The user needs to be notified of the scan results if the scan follows a template rule or a custom rule. A subscriber is required. If you want to manage a subscriber, click Subscription Management in the DataWorks console to configure notification methods for a recipient, such as SMS, email, and DingTalk.
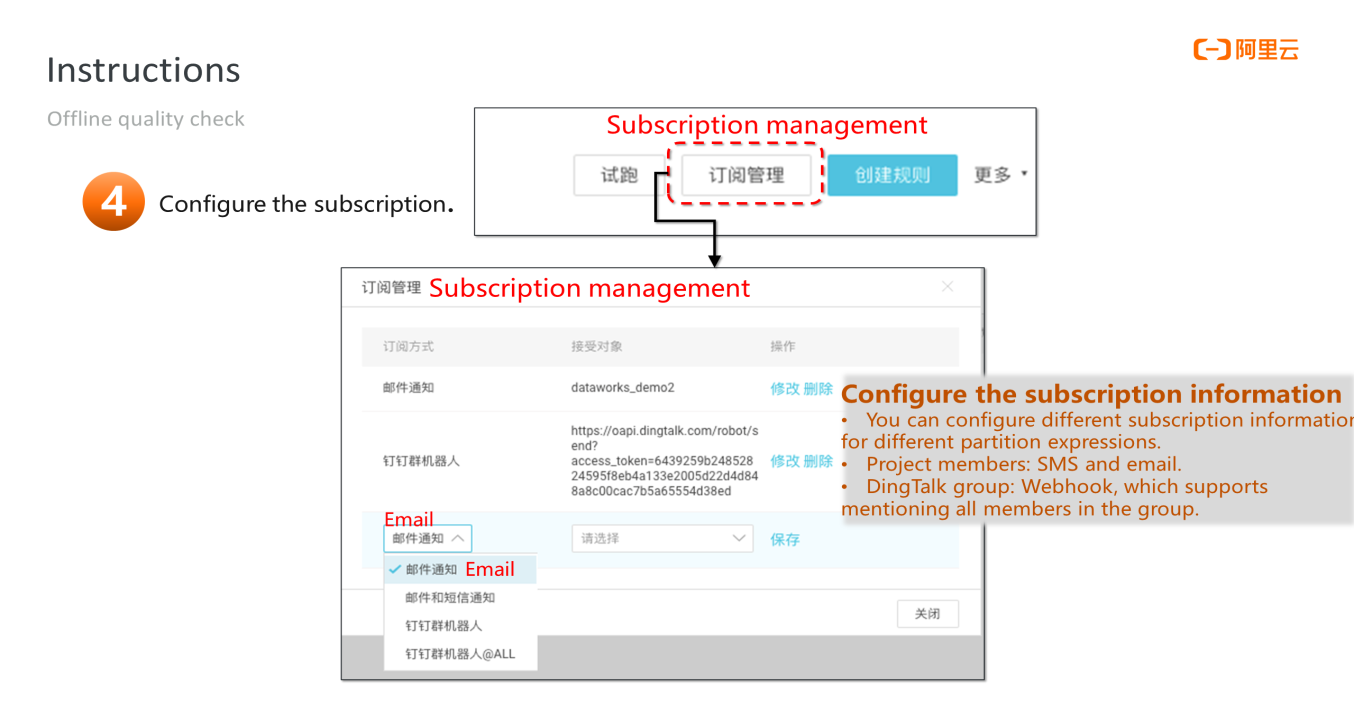
In addition, you can click Test and verify the correctness of the rule:
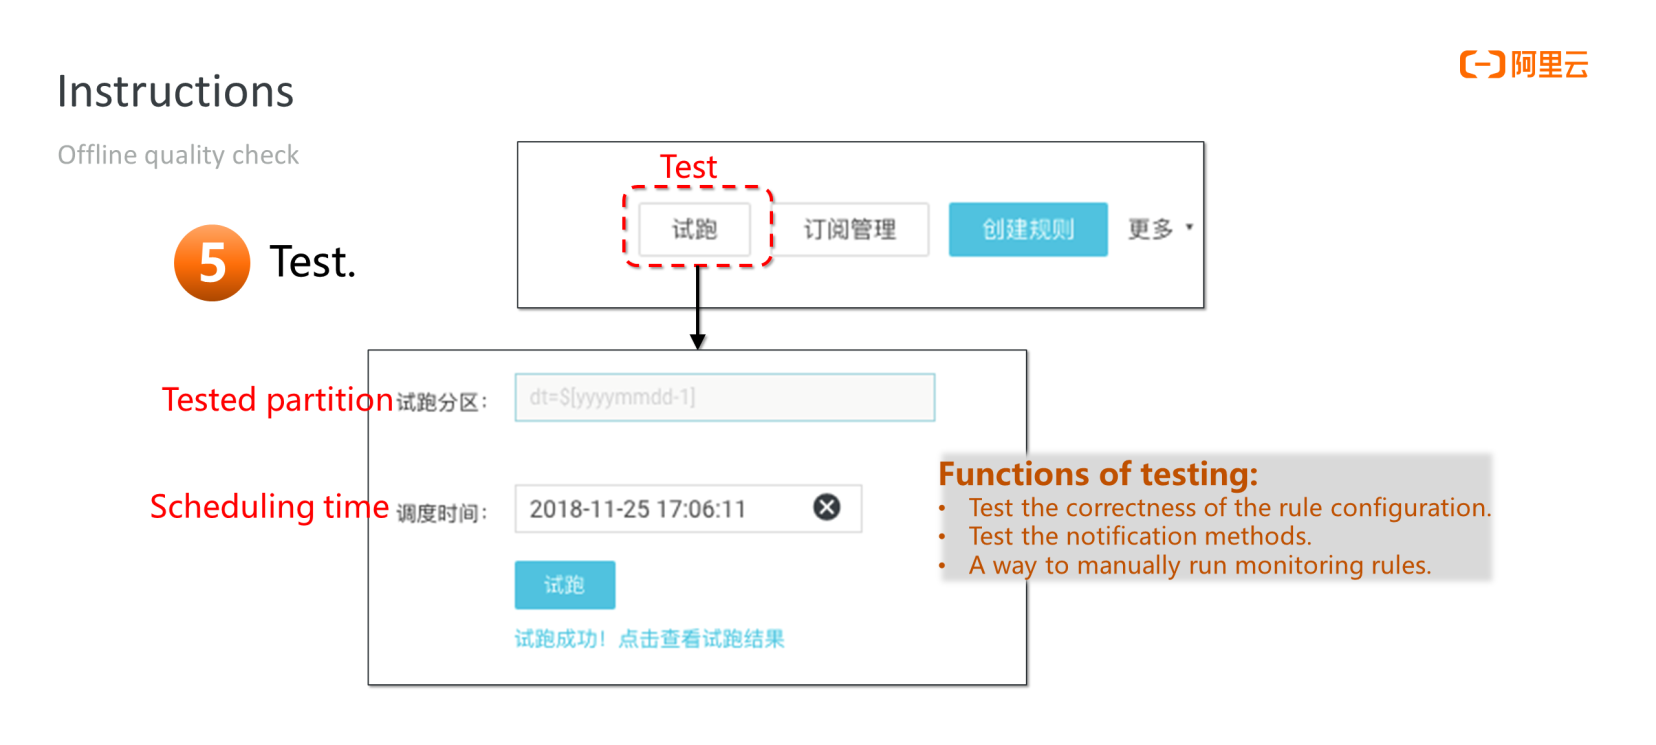
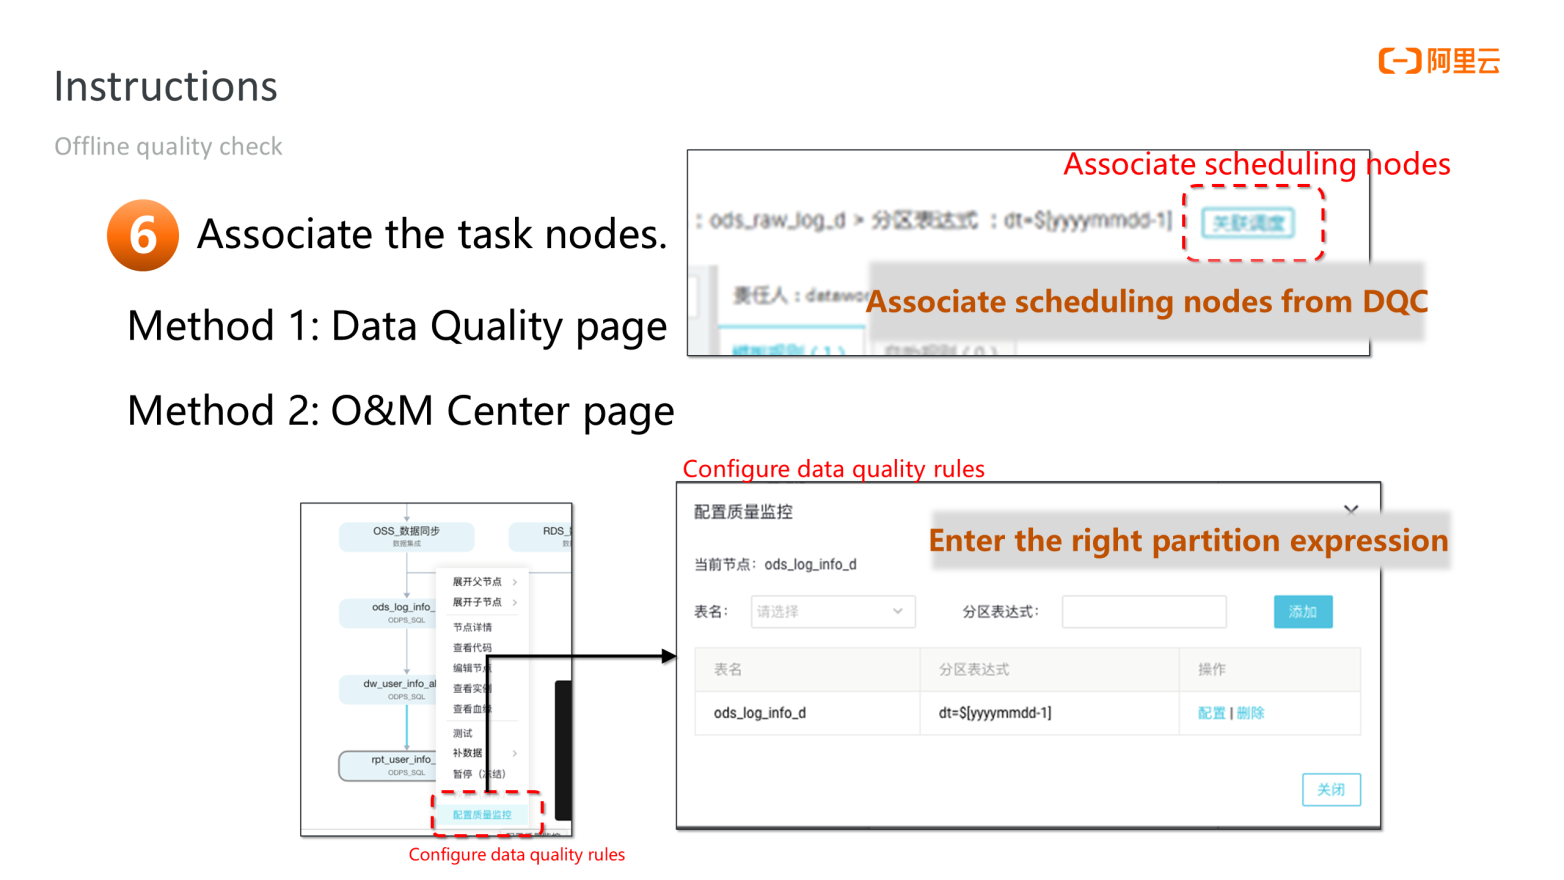
The user can bind a rule to a scheduling task on the Data Quality page. The user can perform the binding operation on the Data Quality page or the O&M Center page. After the binding is successful, rules and tasks are associated, and data development and data governance are connected in the process.
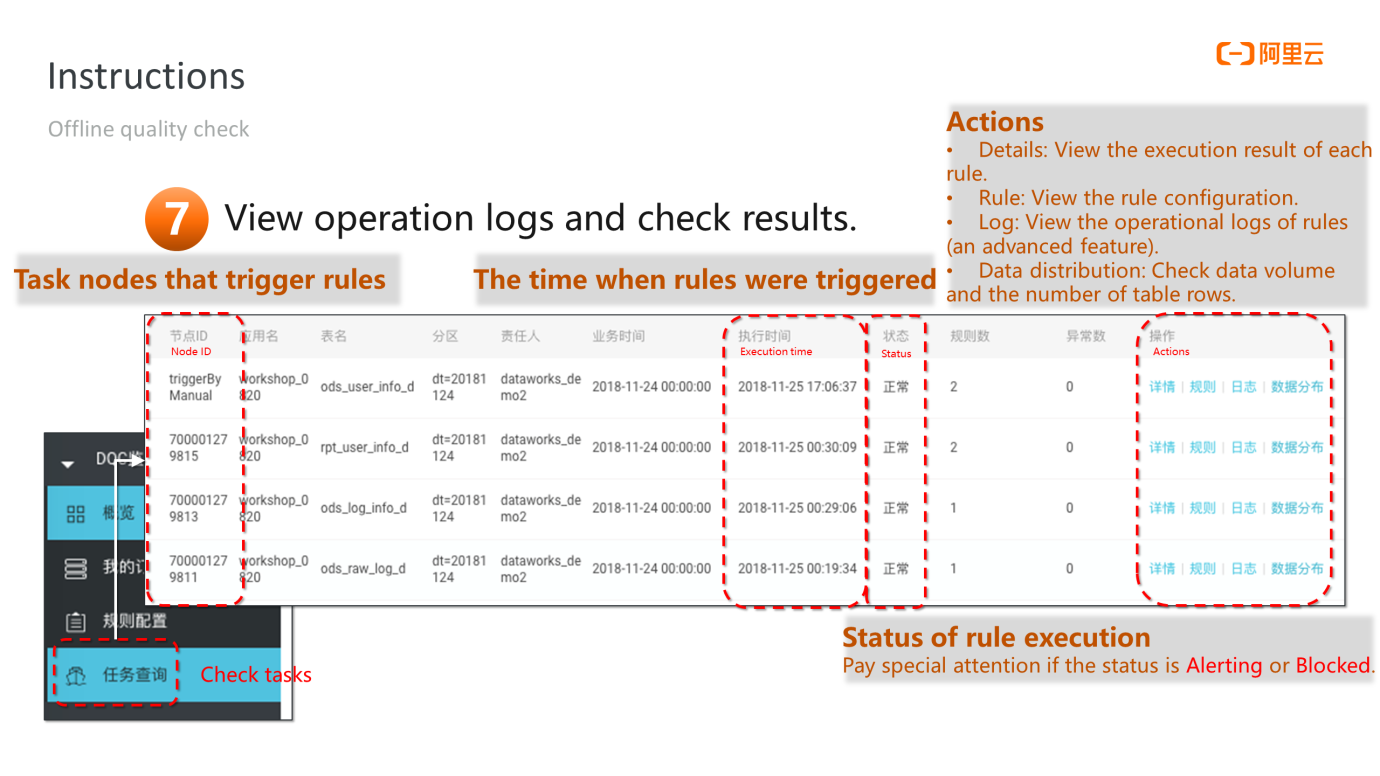
You can view the results of both scans manually run through the Test feature and the scans triggered by rules in View Results.
Real-time quality check is similar to offline quality check in terms of operations and concept definitions.
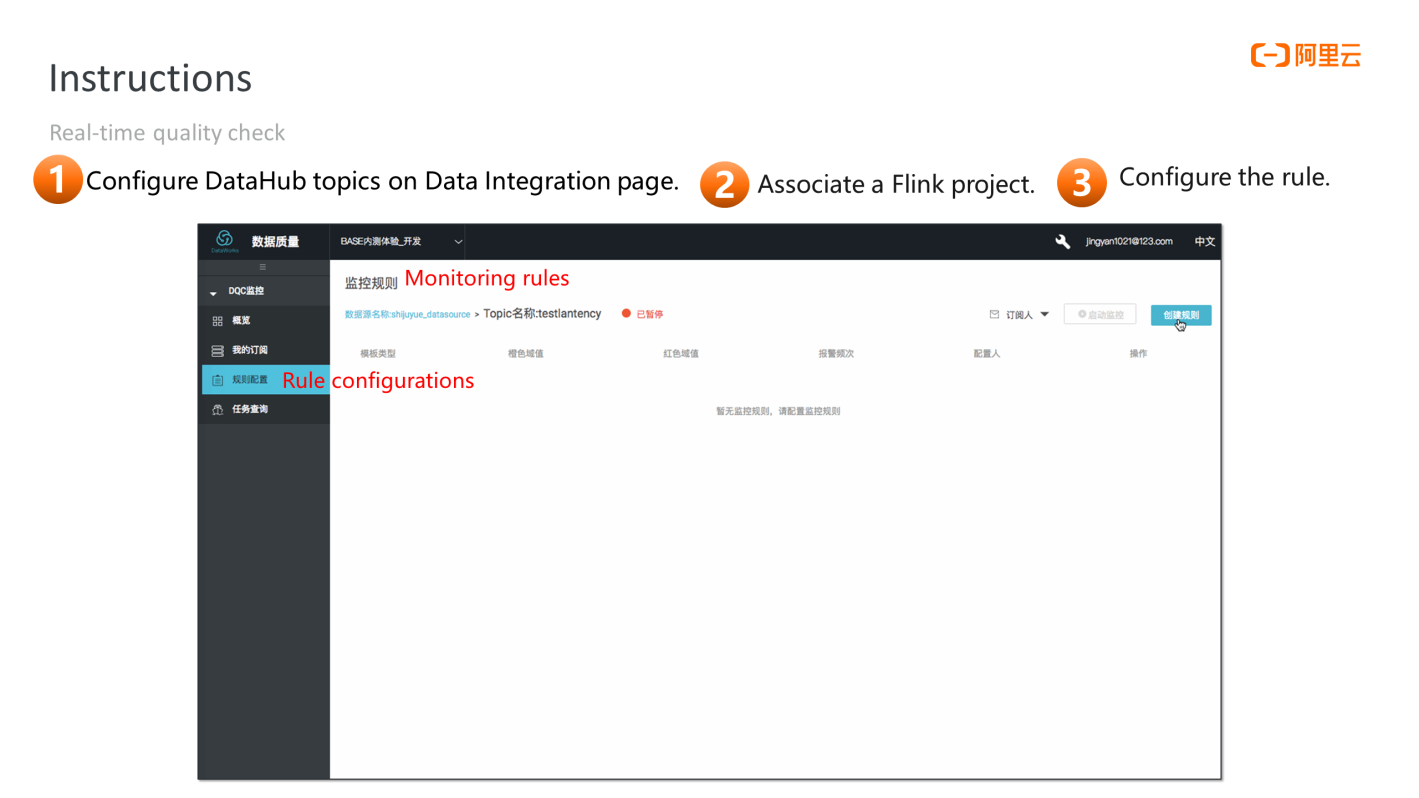
The user needs to select a DataHub topic on the Rule Configuration page. The system automatically determines that the user needs to configure a real-time quality check. The user needs to specify a Flink project, run the real-time quality check task on the project, and configure some rules to complete the process.
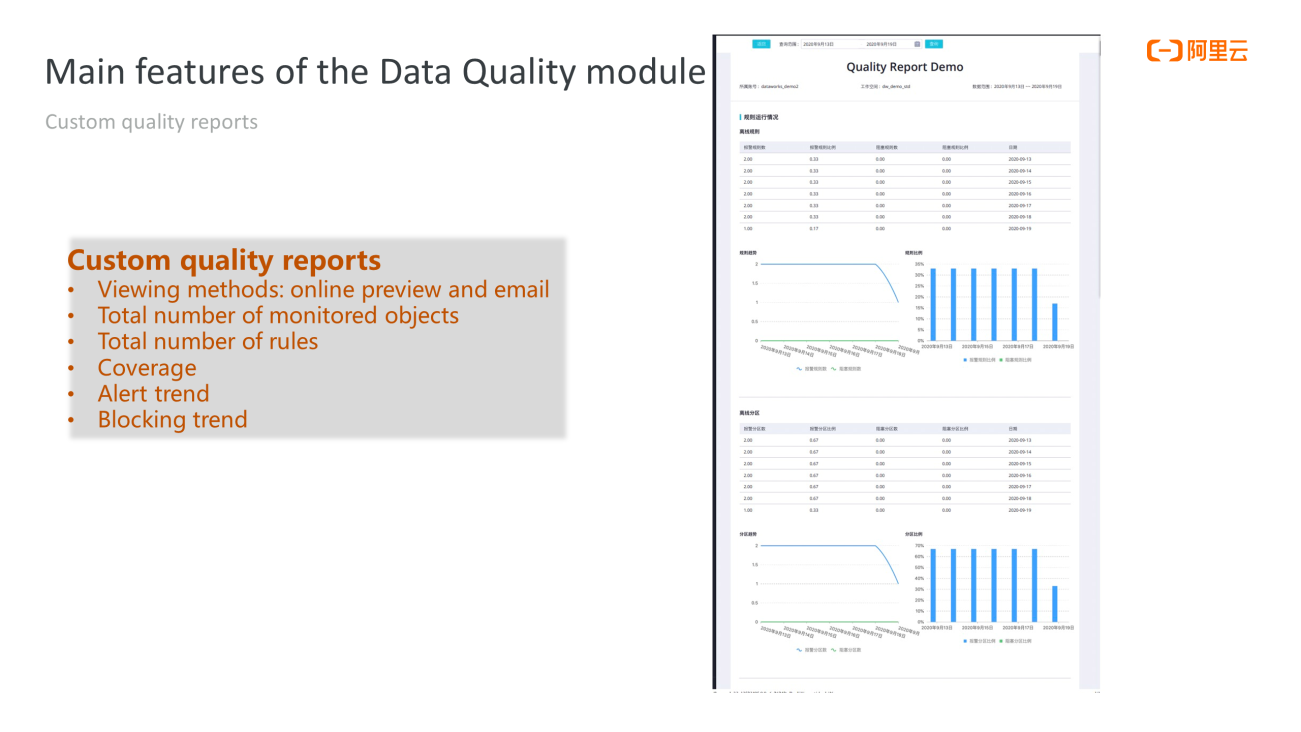
After the real-time and offline monitoring rules are configured, the user can receive data quality reports regularly. If you want to set up the quality report, go to Report Template Management from the navigation menu and create a report template to include the content you want to see in the report.
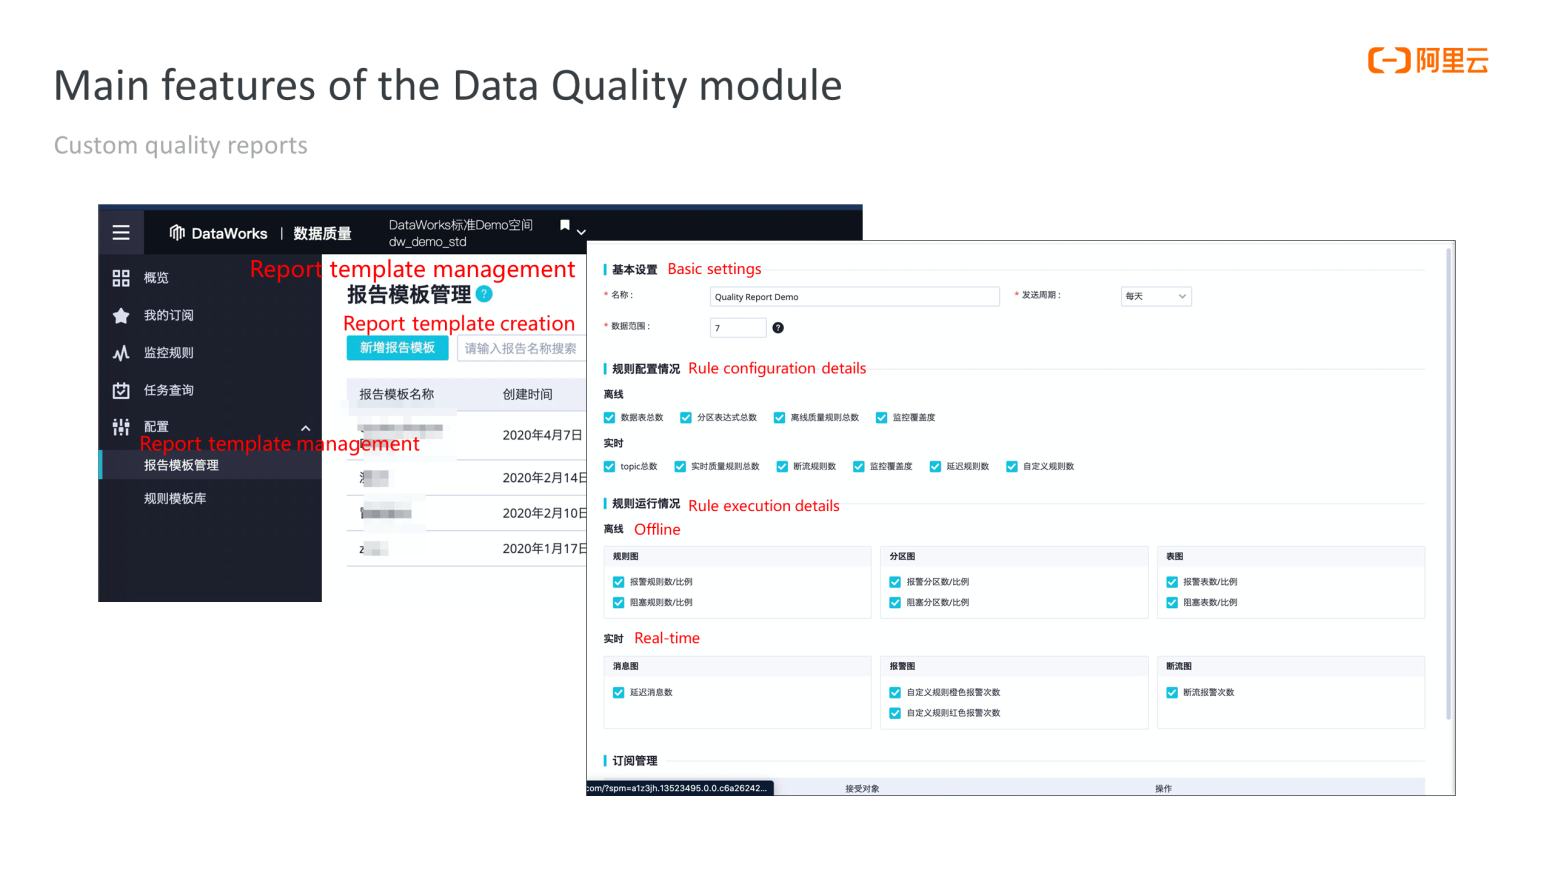
The following figure shows the available content the user can select:
First, let's learn how to configure the data quality rules of a data warehouse system. How do you choose among multiple types of quality rules, multiple built-in templates, and custom template rules supported?
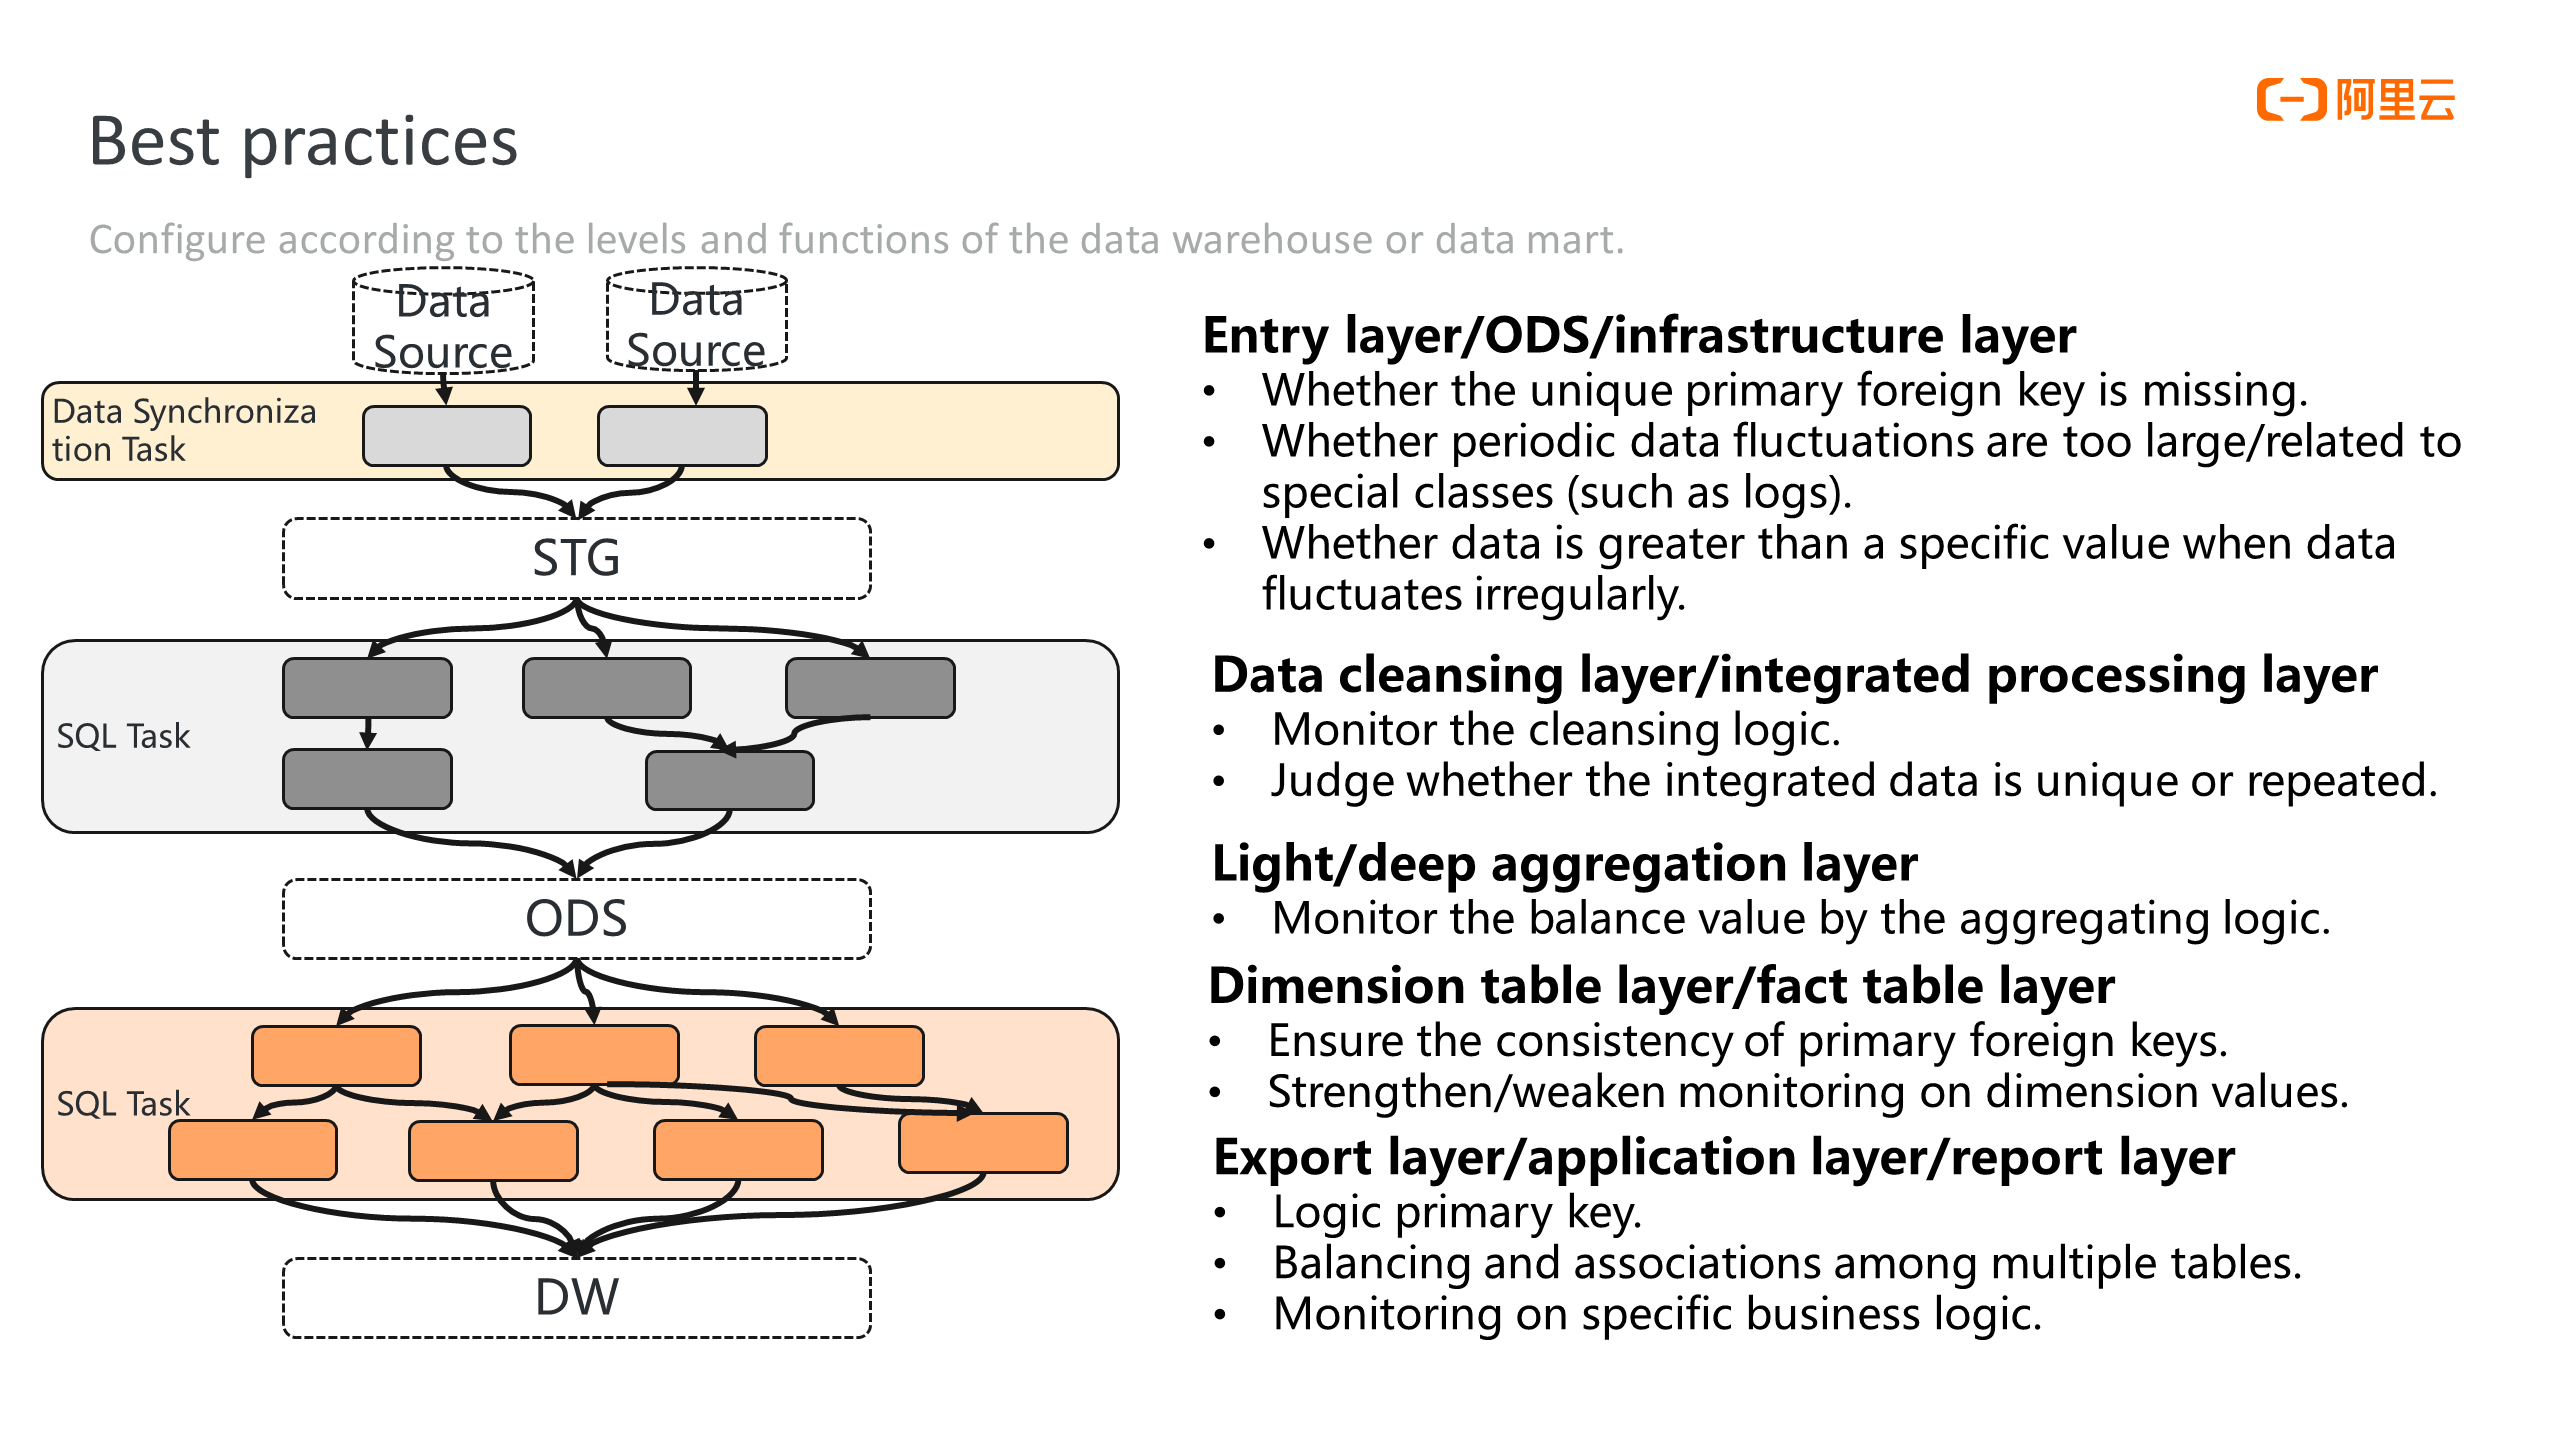
Generally speaking, rules are set to monitor on following issues at the entry layer (ODS or infrastructure layer) of the data warehouse: whether the primary foreign key is missing, whether the periodic data volume fluctuates too much, whether data is greater than a specific value when data fluctuates irregularly, and whether data is repeatedly imported.
The monitoring of the cleansing logic, repeated data, and the uniqueness of data are added at the data cleansing and processing layers. For example, duplicate data may occur when data is joined or grouped.
In the deep/light aggregation layer, the balance value of the aggregating logic is monitored. Based on statistics, such as sum, average, and maximum&minimum metrics, business semantics may deform during aggregation. For example, the sum value of the numeric columns in a details table must be consistent with the corresponding columns in the aggregation table. These balance values are monitored to ensure that the business semantics of the aggregation values are not deformed in the process.
We recommend monitoring the consistency of primary foreign keys and the number of dimension values (discrete values) for dimension tables and fact tables.
We recommend monitoring specific business logic and the balance between multiple tables at the export, application, and report layers, where you may find custom SQL rules useful.
In summary, some rules are applied more widely. For example, among table-level rules, ones for the number of table rows and the table size are widely used to monitor whether some partitions are empty and whether data soars.
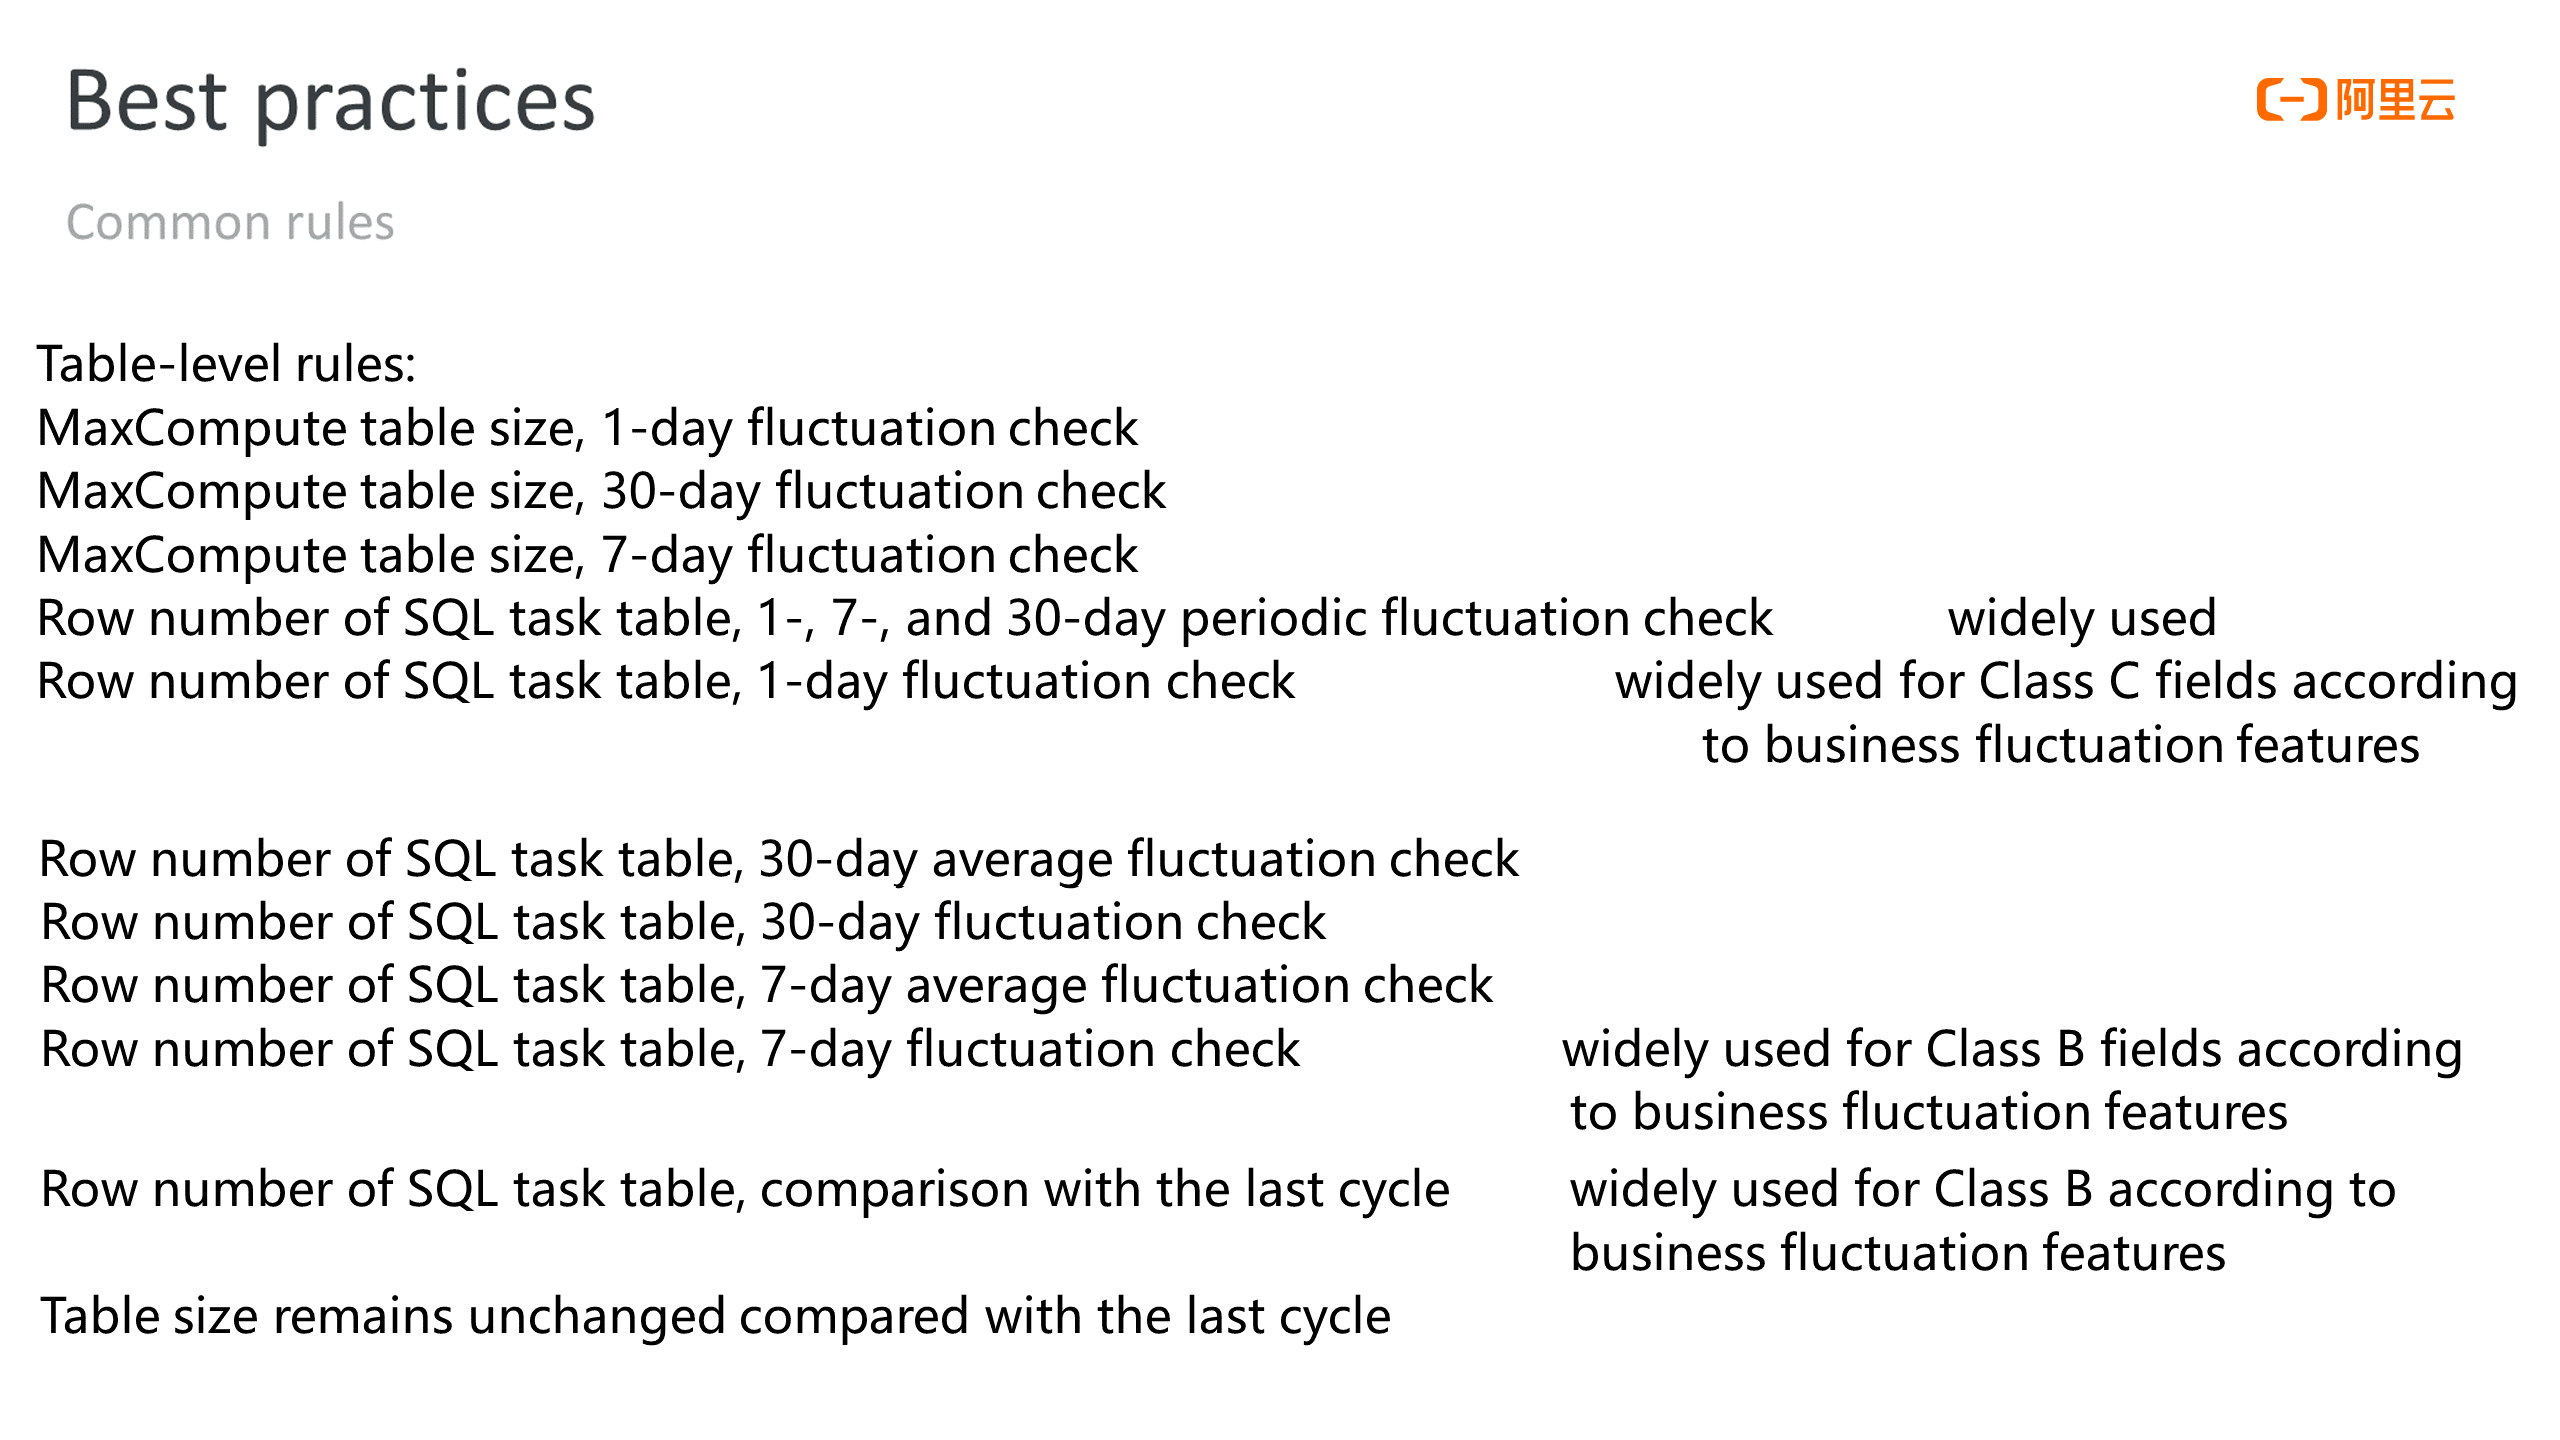
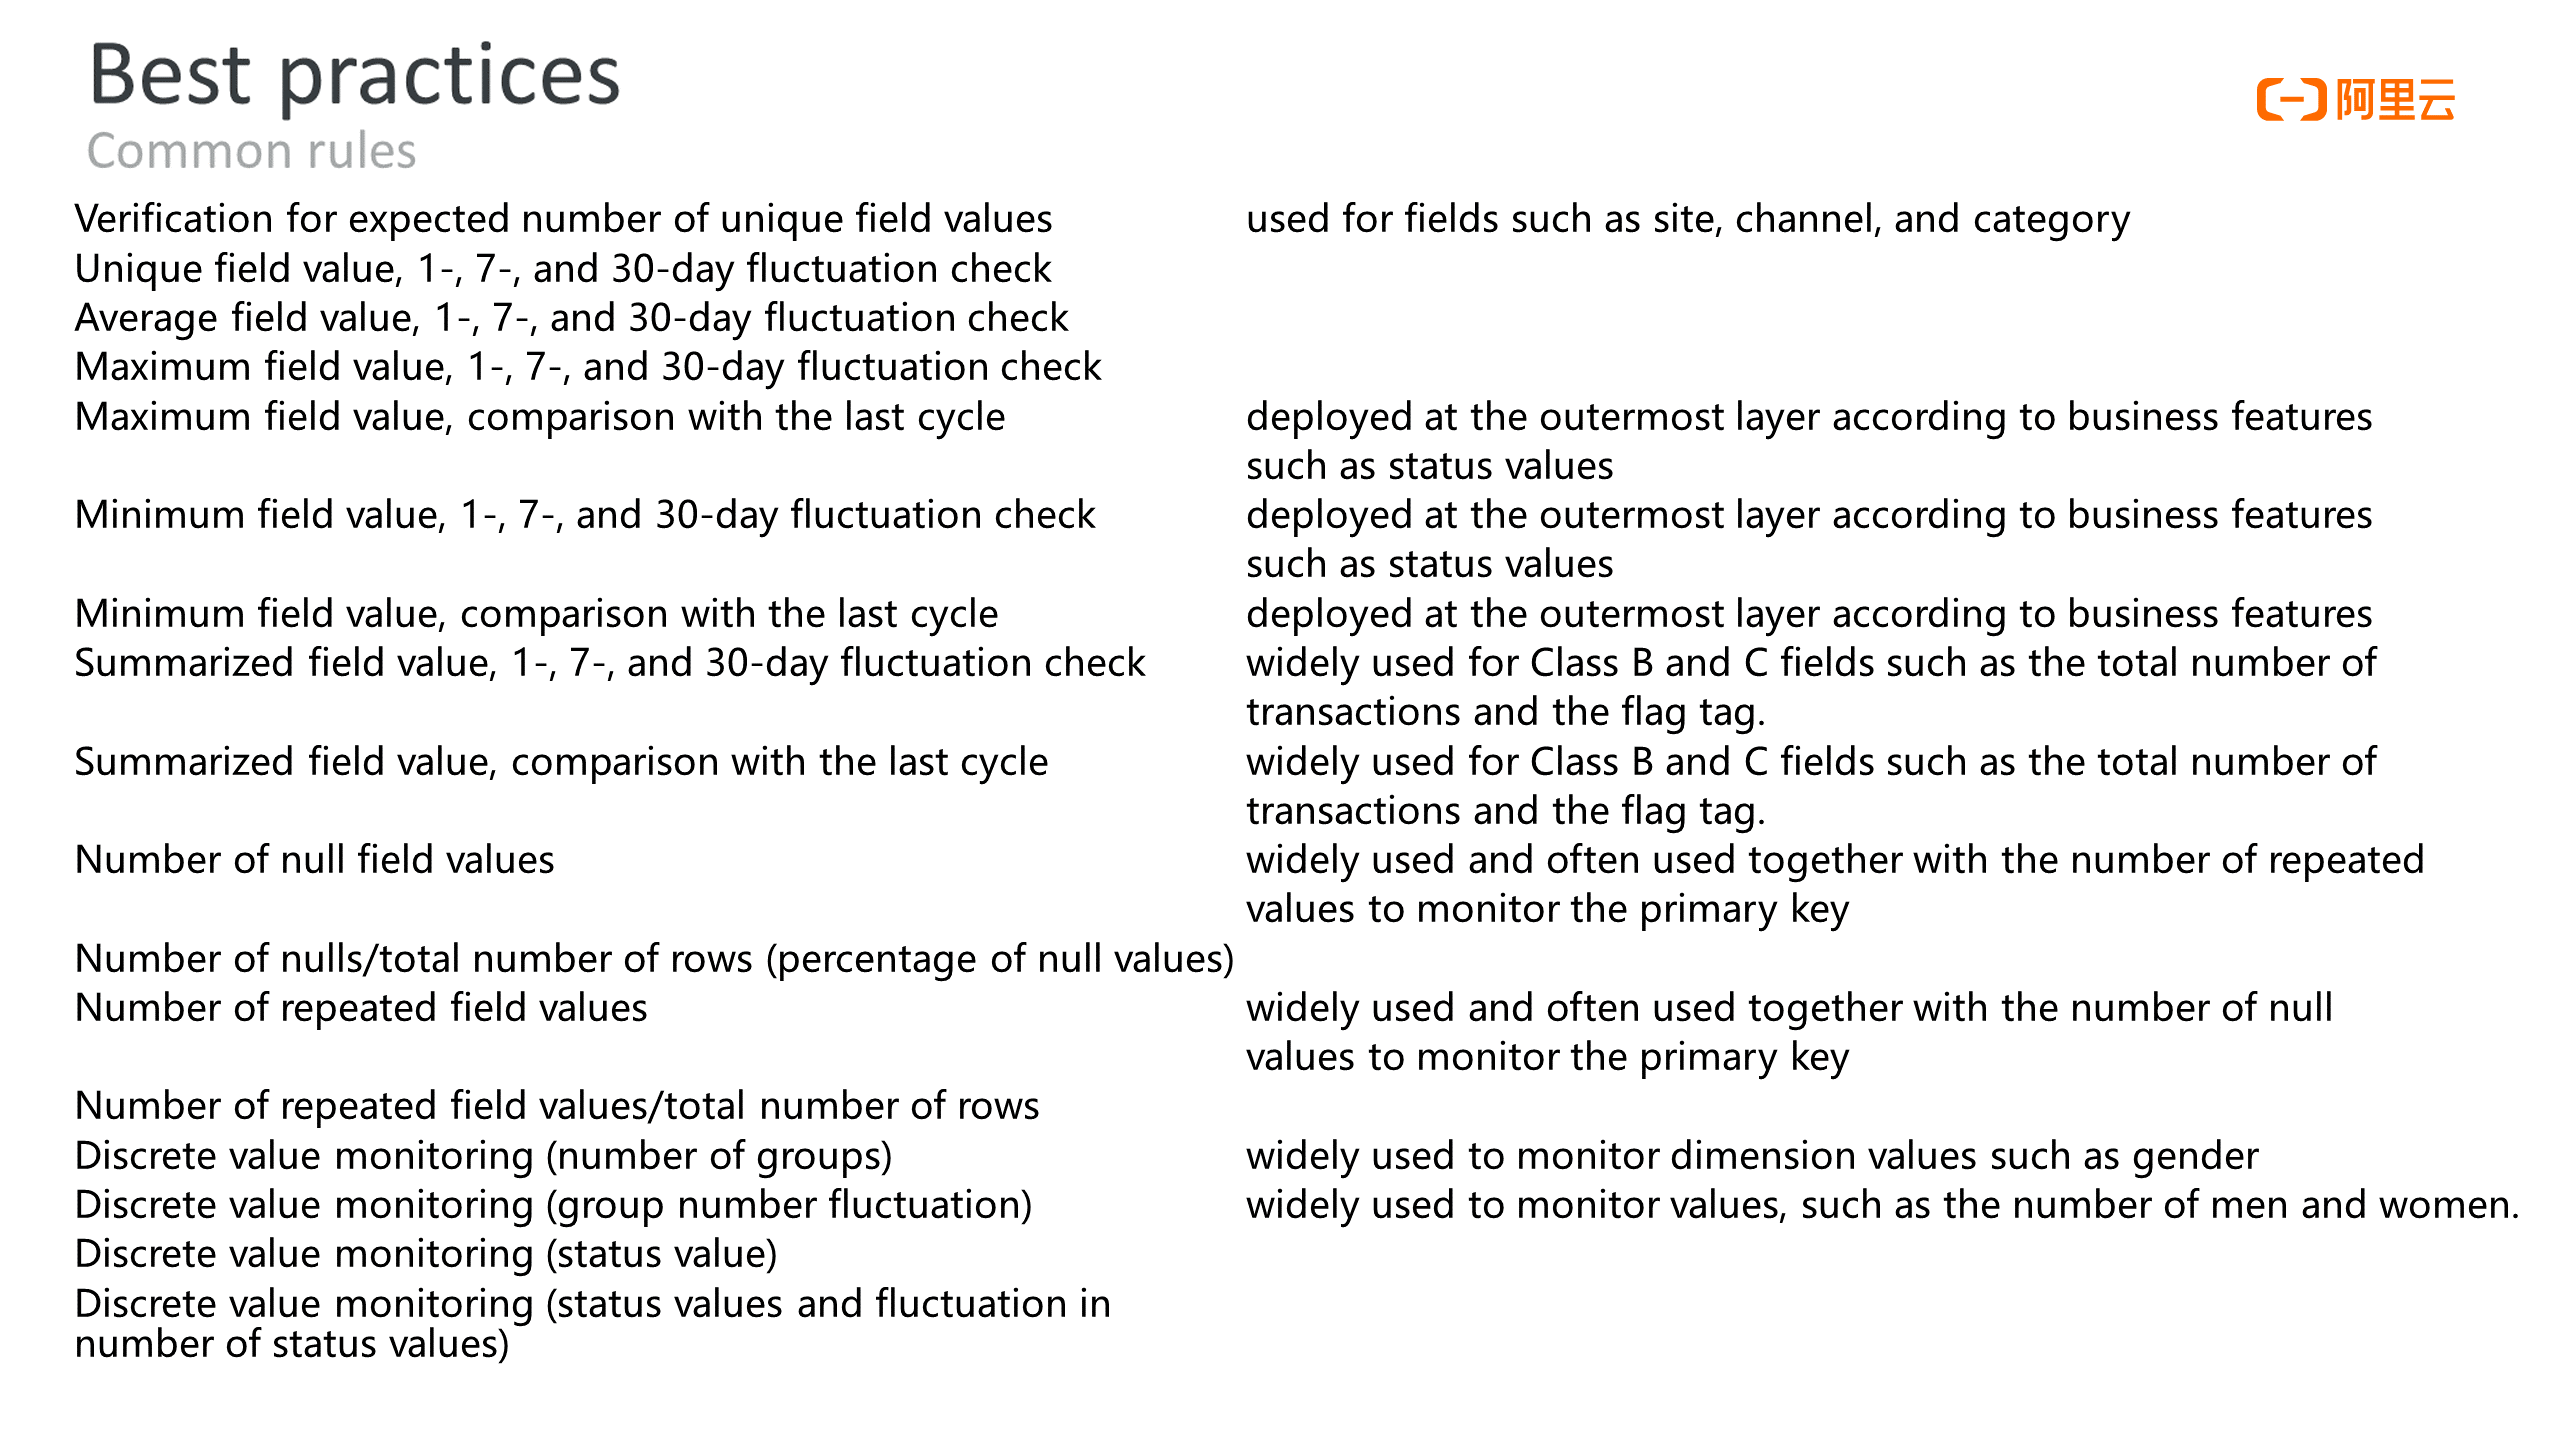
The following figure shows the most widely used field-level rules:
The user needs to decide whether the rule is strong or soft reasonably. Strong rules are needed to prevent key dirty data from flowing to the downstream tables. Otherwise, we recommend setting the rule to soft. The comparison method for the fluctuation rate type includes raise, drop, and absolute value. The user can set the comparison method according to their business needs.
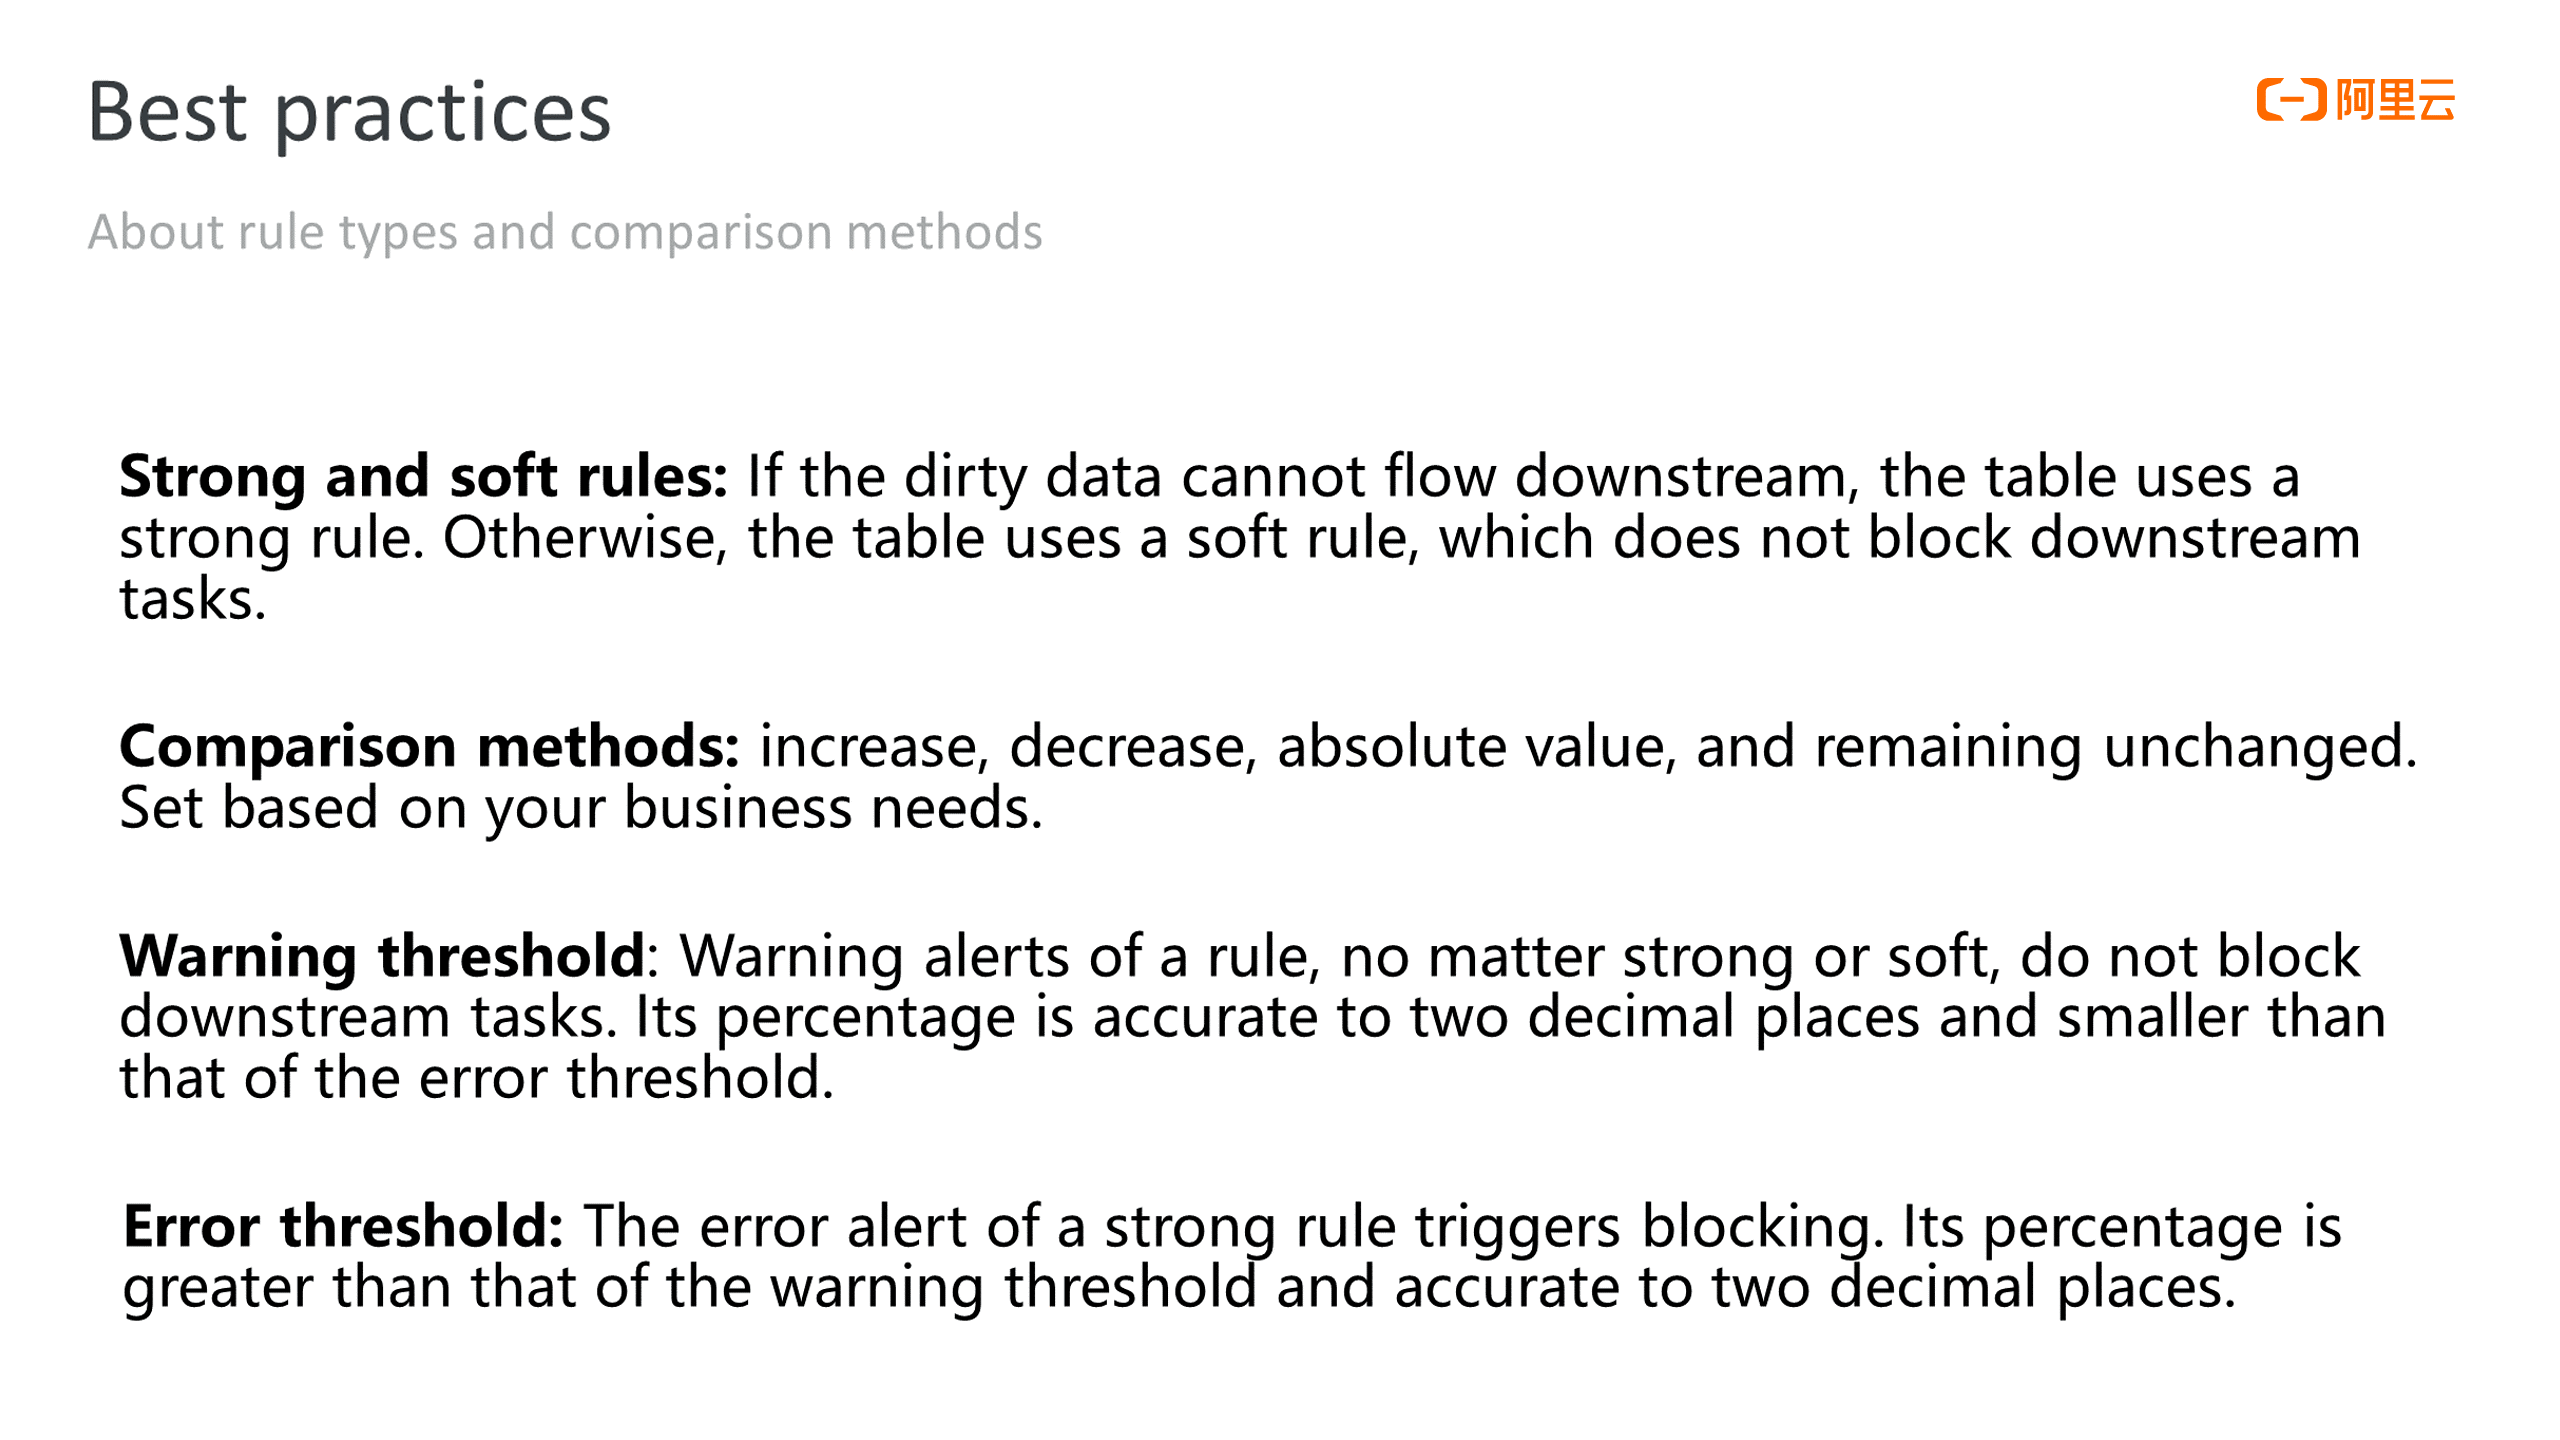
A warning threshold does not block downstream tasks while a strong rule with an error threshold triggers blocking. The percentage value is accurate to two decimal places for warning and error thresholds.
Q: Is the Data Quality module free?
A: Public cloud users are charged based on the number of running instances with quality rules. Some features can only be enabled in the DataWorks Enterprise Edition. Please see this link for more information
Q: What SQL syntax does a custom rule use?
A: Offline custom rules use MaxCompute SQL, and real-time custom rules use Flink SQL. Currently, only query statements are accepted, and the output is restricted to a single row and a single column.
Q: How can I quickly locate the business workflow node that triggers the threshold after receiving the data quality alert?
A: Go to Data Quality, click Node Query on the left-side navigation pane, write down the ID of the node related to the alert, and query in the O&M Center.
Q: What do I need to pay attention to when Data Quality is used together with Intelligent Monitoring?
A: Strong and soft rules run differently for offline data:
Features, such as dynamic threshold, custom data quality report, and rule template library, are only available in the Enterprise Edition or more advanced editions.
Offline custom rules use the SQL syntax of the corresponding engine. Hologres uses PostgreSQL, EMR uses Hive SQL, and Flink SQL is used in real-time custom rules.
The baseline function of the intelligent monitoring feature in the O&M Center is used to monitor the timeliness of tasks. However, strong data quality rules are executed before the downstream tasks are run. If an alert is triggered according to a strong rule, downstream tasks are blocked, which affects the timeliness of the tasks. Therefore, if downstream tasks contain baseline operations, set strong rules with caution.
An Introduction and Best Practice of DataWorks Data Governance

1,320 posts | 463 followers
FollowAlibaba Cloud Community - March 29, 2022
Alibaba Cloud MaxCompute - December 22, 2021
Alibaba Clouder - January 6, 2021
Alibaba Cloud Community - March 21, 2022
Alibaba Cloud Community - March 4, 2022
Alibaba Cloud Community - March 21, 2022

1,320 posts | 463 followers
Follow Managed Service for Grafana
Managed Service for Grafana displays a large amount of data in real time to provide an overview of business and O&M monitoring.
Learn More Bastionhost
A unified, efficient, and secure platform that provides cloud-based O&M, access control, and operation audit.
Learn More Big Data Consulting for Data Technology Solution
Alibaba Cloud provides big data consulting services to help enterprises leverage advanced data technology.
Learn More MaxCompute
Conduct large-scale data warehousing with MaxCompute
Learn MoreMore Posts by Alibaba Cloud Community