Unlike traditional industrial optimization, all agents in a multi-agent system are replaceable by each other and their working process is non-linear, which makes it difficult to directly model the system efficiency. The system efficiency is often approached indirectly by adjusting task assignment and moving paths and optimizing the total task route. However, in practice, we find that the task route is poorly related to system efficiency. With limited cost budget, the number of agents is often limited. When the task route is optimized, some agents are overburdened while some others are idle.
Therefore, based on the practice and thinking of Cainiao, a flexible and automatic lab in multi-agent systems, we proposed an optimized model based on the idle time of stations in a paper titled "Idle Time Optimization for Target Assignment and Path Finding in Sortation Centers". This model focuses on maximizing human capabilities to improve system efficiency. To achieve this, we discretized the working time of stations to simulate the queuing and waiting of agents. We also used a unified network flow model to obtain assignment policies for agents and stations and plan the paths of agent clusters, which increased the system production capacity. For more details, see Idle Time Optimization for Target Assignment and Path Finding in Sortation Centers.
The emergence and development of automatic technology and solutions based on multi-agent clusters drive the advancement and globalization of modern logistics and represent a major trend of the logistics and supply chain industry in the future. In the warehousing and sortation centers of Alibaba's Cainiao Network and its partners, hundreds of agents work in an orderly manner to help deliver packages to customers efficiently and securely.
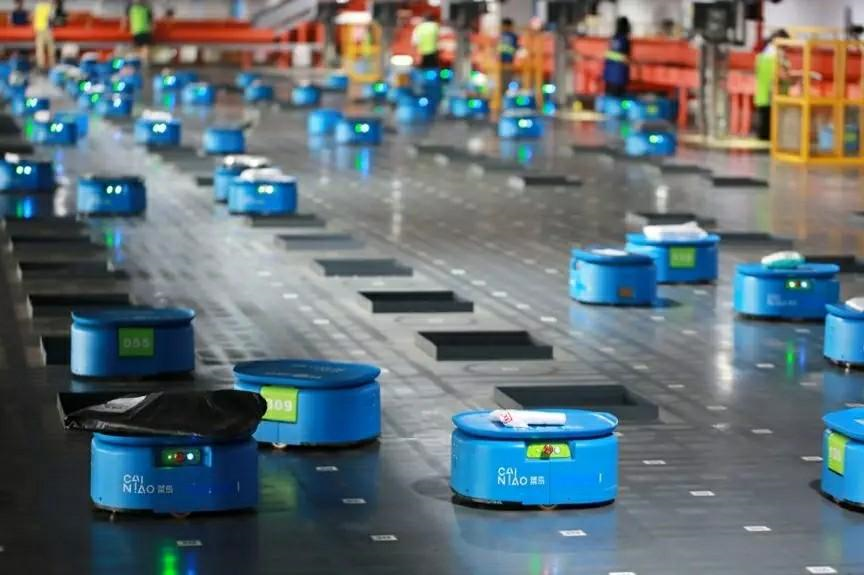
Figure 1. A cluster of agents sorting parcels in a sortation center
Figure 1 shows an agent-based sortation center, where hundreds of agents quickly sort massive numbers of parcels based on cities to help the main logistics network deliver packages efficiently. The agent-based sortation center comprises stations, agents, and sorting bins. An agent automatically moves to a station, scans a QR code to receive a parcel, and carries the parcel to a destination sorting bin. Then, the agent puts the parcel into the sorting bin to complete the parcel sorting. The critical question is, how can we keep hundreds of agents running efficiently to ensure parcels are delivered to customers much faster? Generally, we believe the efficiency of the entire sortation center can be improved by shortening the total moving distance of these agents.
However, reality seems to differ. Let's divide this scenario into the input and the output. The input includes all the parcels, whereas the output includes the parcels at all sorting bins. Due to a large number of parcels and the limited number of agents, the output cannot be maximized simply by minimizing the moving distance. By minimizing only the moving distance, some stations become crowded with queuing agents, while other stations are in short of agents. In this case, the input compromises the system capacity. For this reason, we aim to minimize the idle time of all stations and maximize the system capacity. This article introduces how to minimize the idle time of stations by means of problem modeling.
By abstracting the agent-based sortation center model shown in Figure 1 into a model shown in Figure 2, let's introduce the research on planning the paths of multiple agents. The core elements of this model are the orange stations, green agents, and blue sorting bins.
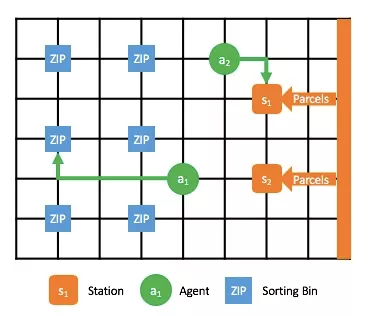
Figure 2. Sorting process, where orange nodes indicate stations, green nodes indicate agents, and blue nodes indicate sorting bins (each of which corresponds to a destination)
To minimize the idle time of the stations, we need to solve two problems:
1) Which station should each agent go for parcels? This process is about task assignment.
2) Which path should each agent carrying parcels take to arrive at the destination sorting bin? This process is about multi-agent path finding (MAPF).
These two problems are defined as target assignment and path finding (TAPF). To complete task assignment and path planning for once, we'll define a single TAPF. Accordingly, abstract the continuous operation in the preceding automatic sortation center as a lifelong TAPF. A TAPF is defined as follows. There are three conditions:
The TAPF will find an assignment solution that specifies which station each agent should go to and finds non-conflicting paths for all agents to ensure they arrive at their destination stations efficiently and without interruption.
When an agent arrives at its destination station, the station transports the parcel onto the agent within time T. Therefore, if a time window [0, KT) is given, set the operation time of each station as K working time slices, that is, [0,T), [T,2T),..., [(K-1)T,KT). In addition, each station requires that the arrival time of an agent be kT, where k=0, 1,..., K-1. To this end, we believe that when an agent arrives at its destination station at time kT, the station will be occupied within the time period [kT,(k +1)T).
A lifelong TPAF does not only calculate the task assignment and MAPF one time. Instead, it constantly calculates and updates the assignment solution and path for each agent. In the preceding scenario, each agent adjusts its destination station and moving path during operation. In this way, it's possible to minimize the idle time of all stations and maximize the capacity of the sortation center.
Based on the preceding definitions, let's define an objective function as the minimum total idle time of all stations within a given time period.
In the following sections, we will explain each model by using the example shown in Figure 3.
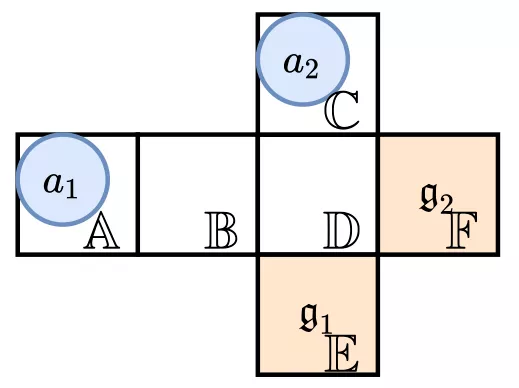
Figure 3. Example
We assume that the given time range is [0,6) and the handling time T of stations is 2. In this case, the optimum TAPF solution is as follows:
a1 is assigned to station s2, and its path is <A,B,D,F>; a2 is assigned to station s1, and its path is <null,C,C,D,E>.
Here, null means that at time 0, a2 is not on the map. In this case, the operation time ranges of both stations are [4,6), and the obtained value of the objective function (the total idle time) is 8.
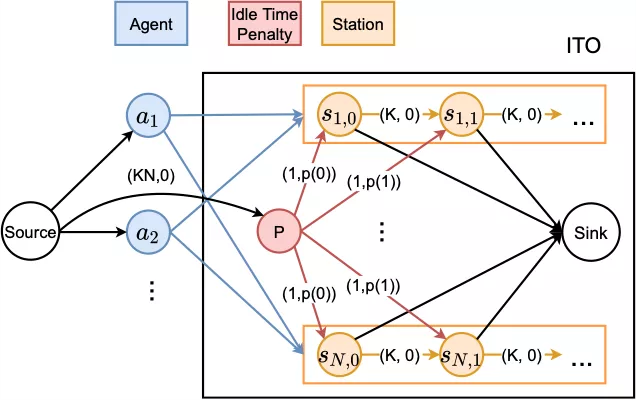
Figure 4. ITO model, where different routes between nodes are marked with (cost, capacity), and routes with (cost=0, capacity=1) are omitted for a simplified representation
To optimize the idle time, we built an ITO network flow model, as shown in Figure 4. Each route consists of a (cost, capacity) attribute pair, where cost indicates the cost for each unit of flow to travel through this route, and capacity indicates the number of flow units that this route supports. For easy representation, routes with (cost=0, capacity=1) are omitted in Figure 4.
We set a blue node for each ai, and a rectangular station substructure for each sj. The station substructure is expanded into K discrete time periods along the timeline, and each time period [kT,(k+1)T) is represented as a node sj,k. In this way, we can easily assess the working situation in each time period. Agents are fully connected to the station substructure, which can be represented as a bipartite graph. This graph indicates that each agent can be assigned to any station and consume a corresponding time period.

Figure 5. The connection between an agent and the station substructure
Figure 5 shows the detailed connection between an agent and the station substructure. For each group (ai,sj), we estimate the time when ai arrives at sj. If this time period is [kT,(k+1)T), ai can start queuing in time period sj,k and make up the vacancy in any subsequent time period. Here, we use the connection between sj,k and sj,k+1 to show the queuing sequence.
Finally, in order to minimize the idle time of the whole system, we hope to find a station assignment that ensures that station time periods are occupied as much as possible. Therefore, we use an agent as the flow entry and assign one unit of flow for each agent. Meanwhile, we use station time periods as the exit and ensure that up to one unit of flow travels out in each time period. In this way, each time period is exclusively occupied by one agent, and each agent consumes only one time period. Then, the maximum flow solution of this network flow model is the agent-station assignment with the minimum idle time in the whole system. After obtaining the assignment solution, we use the MAPF algorithm to obtain non-conflicting agent paths. Then, we control and schedule the entire multi-agent cluster based on the paths.
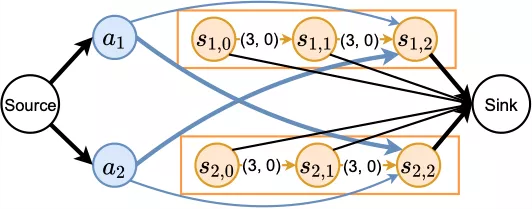
Figure 6. Sample ITO model
Figure 6 shows the ITO model corresponding to the preceding example. The estimated arrival time of both agents is within the third time period. The thick routes indicate the maximum flow solution, which corresponds to (a1,s2) and (a2,s1).
Since station assignment and path planning are separated in ITO, the ITO performance largely depends on the accuracy of estimated arrival time. To remove this dependency, we have designed PITO based on ITO, which combines ITO with an anonymous MAPF network flow model (Anonymous MAPF flow network, Yu and LaValle 2013). PITO uses a unified network flow model to calculate station assignment and agent paths at the same time.
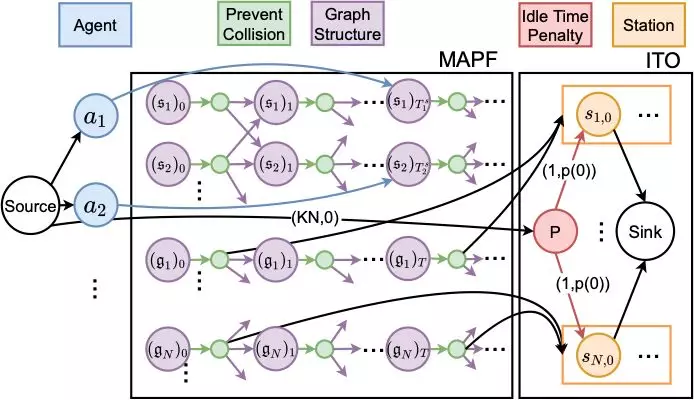
Figure 7. PITO model
The PITO structure comprises two parts, as shown in Figure 7. The MAPF network on the left is used to calculate and generate path information, while the ITO network on the right is used to generate the station assignment.
We can expand any point u° V in the map to time t along the timeline, and u at time t is represented by a purple node ut. Following each ut, we create a green secondary node u't. Since there is only one route with capacity 1 between ut and u't, up to one unit of flow travels through u at any time t, which helps in avoiding the conflict caused by the arrival of multiple agents at the same time. We did not design the network structure to avoid conflicting routes. Instead, we used a technique that ensures the two agents conflicting on routes wait at the current point and exchange their station assignment and subsequent paths. Since agents are anonymous, exchanging the station assignment and subsequent paths does not affect the idle time. In this way, we simplify the network and accelerate the solution.
The structure of the ITO network is the same as that described in the previous section. This implies we no longer directly connect agents to the station substructure, but enable agents to directly move to stations through MAPF. Each station sj has its real position gj. In each time period [kT,(k+1)T), we connect one route from the secondary node (gj)'kT to the corresponding station time period sj,k, which allows an agent to consume this station time period when arriving at sj. At last, we connect agents to the corresponding nodes based on their start times and start positions.
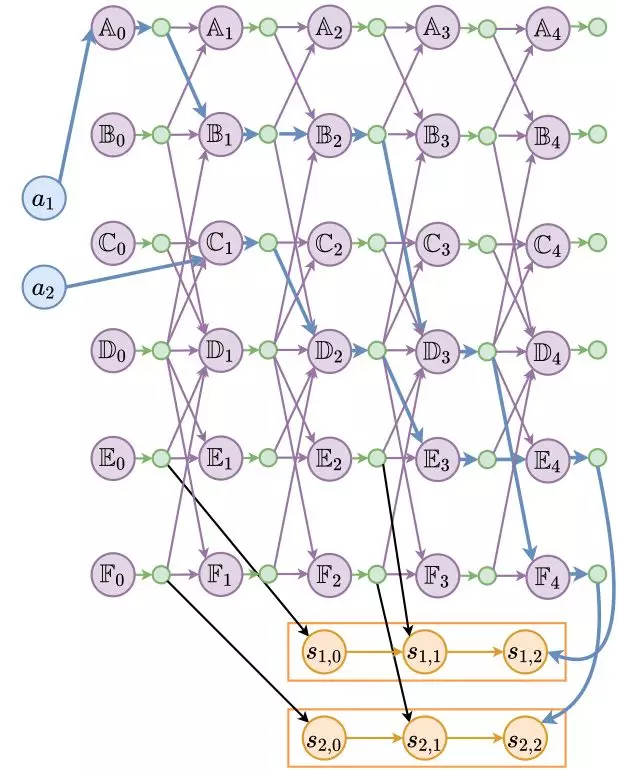
Figure 8. Sample PITO model
Figure 8 shows the PITO model of the preceding example, where nodes connected by thick blue routes show the agent paths and the station assignment.
This section discusses how to use ITO and PITO for lifelong optimization. The previous sections described how to use ITO and PITO for one-shot station assignment and path planning. In this case, each agent only needs to move to a station once. However, we prefer a dynamic process in real scenarios, wherein agents constantly travel between stations and sorting bins. Therefore, in each time window W°‹KT , we will perform re-calculation for agent assignment to stations and path planning.
However, to provide more optimization possibilities for a next time window based on the result of a previous time window, we recommend that agents consume earlier time periods. To achieve this purpose, we added a penalty node P. As shown in Figures 4 and 8, we added a red penalty node P to ITO and PITO, which is used to achieve minimum cost and maximum flow. Penalty node P has a sufficient flow and is connected to all time periods, but its cost is not 0. If a time period is not occupied by any agent, a penalty equal to the cost is generated from P to this time period. To enable agents to consume earlier time periods, we use a function p(k) that decreases monotonically with time to represent the cost from P to sj,k. For example, we use either a linear decreasing or exponential decreasing function. For solutions with the same total idle time, we prefer the one that finishes tasks earlier.
We call lifelong ITO and PITO (with time window W and penalty node P) ITO-L and PITO-L.
We performed a lifelong TAPF experiment for the ITO-L and PITO-L algorithms and three contrast algorithms, and compared the results. The five algorithm frameworks are as follows:
1) H(Inf)-L: The Hungarian algorithm is used to assign all agents to stations based on the principle of the shortest total distance to achieve task assignment. Then, the enhanced PBS algorithm is used to solve MAPF. The system performs constant and repeated calculations in real time until all time windows end.
2) H(1)-L: The Hungarian algorithm is used to assign all agents to stations by performing repeated calculations for [M/N] times to achieve task assignment. Then, the enhanced PBS algorithm is used to solve MAPF. The system performs constant and repeated calculations in real time until all time windows end.
3) H(Q)-L: The Hungarian algorithm is used to assign all agents to stations by performing repeated calculations for [M/(NQ)] times to achieve task assignment. Then, the enhanced PBS algorithm is used to solve MAPF. We can find that H(1)-L and H(Inf)-L correspond to Q=1 and Q=°fi respectively. The system performs constant and repeated calculations in real time until all time windows end.
4) ITO-L: The Primal Dual algorithm is used to achieve the minimum cost and maximum flow for task assignment. Then, the enhanced PBS algorithm is used to solve MAPF. The system performs constant and repeated calculations in real time until all time windows end.
5) PITO-L: The Primal Dual algorithm is used to solve TAPF and achieve task assignment and MAPF. The system performs constant and repeated calculations in real time until all time windows end.
We used the following two experimental platforms.
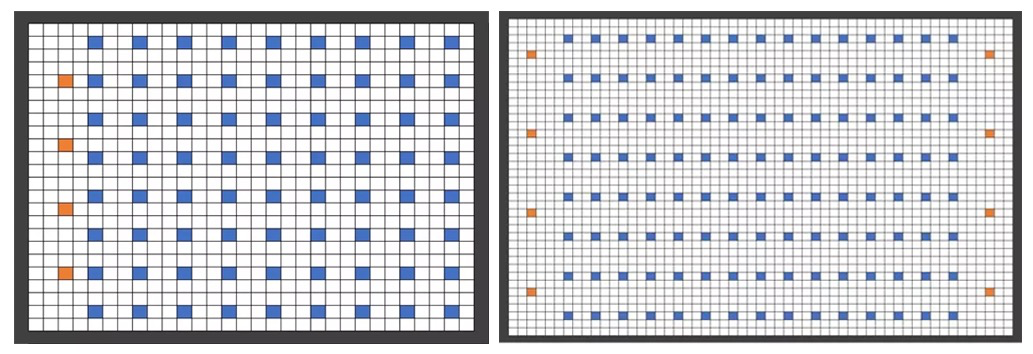
Figure 9. Simulate the maps of the two sortation centers in the experiment
As shown in Figure 9, we randomly generated two maps based on the procedure of a sortation center, where the orange cells indicate stations, blue cells indicate sorting bins, and agents are not marked in the maps. The agent simulator is used to simulate the working process of the sortation center, with the following core parameters:
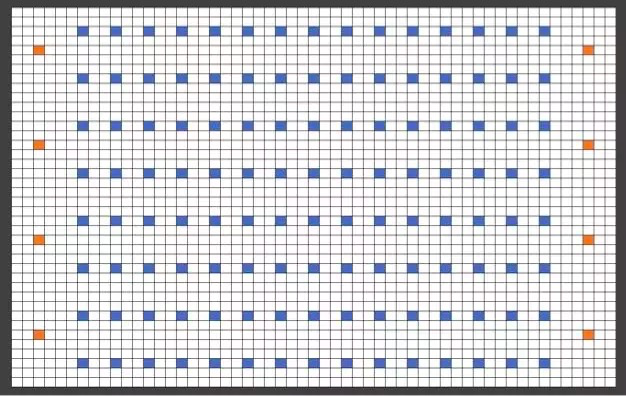
Figure 10. 2D layout of the sortation center site, where the green cells indicate stations, the gray cells indicate unreachable areas, and the black cells indicate sorting bins
We applied the ITO-L and H(Q)-L algorithms to the scheduling system of the sortation center in the preceding scenario. Specifically, we used corresponding algorithms to achieve task assignment, used the centralized A* algorithm to complete path planning, and resolved the deadlock problem. We also abstracted the map of the actual sortation center into a map shown in Figure 10. The core parameters are as follows:
The experimental results of the agent simulator are shown in Figures 11 and 12.
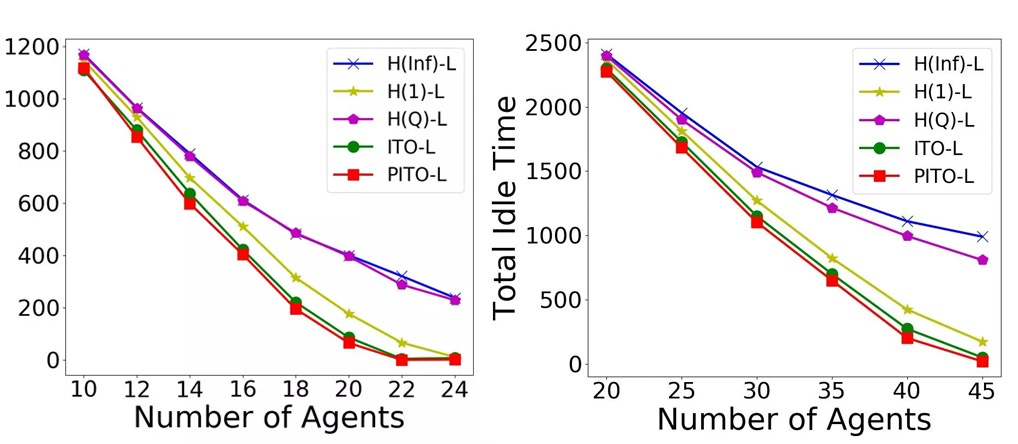
Figure 11. Change trend of idle time with changing numbers of agents
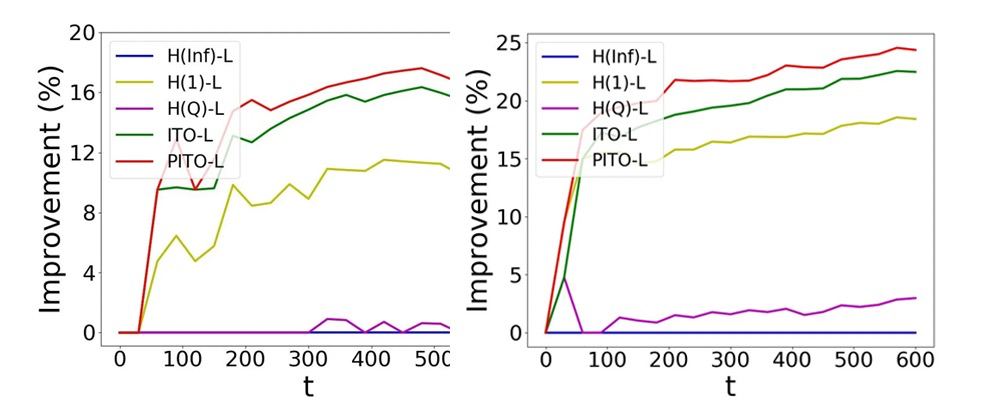
Figure 12. Compared with the H(Inf)-L algorithm, the improvement ratio of each algorithm to the total capacity
The experimental results of the industrial simulator are shown in Figure 13. The green cells distributed across the site indicate agents that carry parcels, and the green cells distributed across the site indicate empty agents.
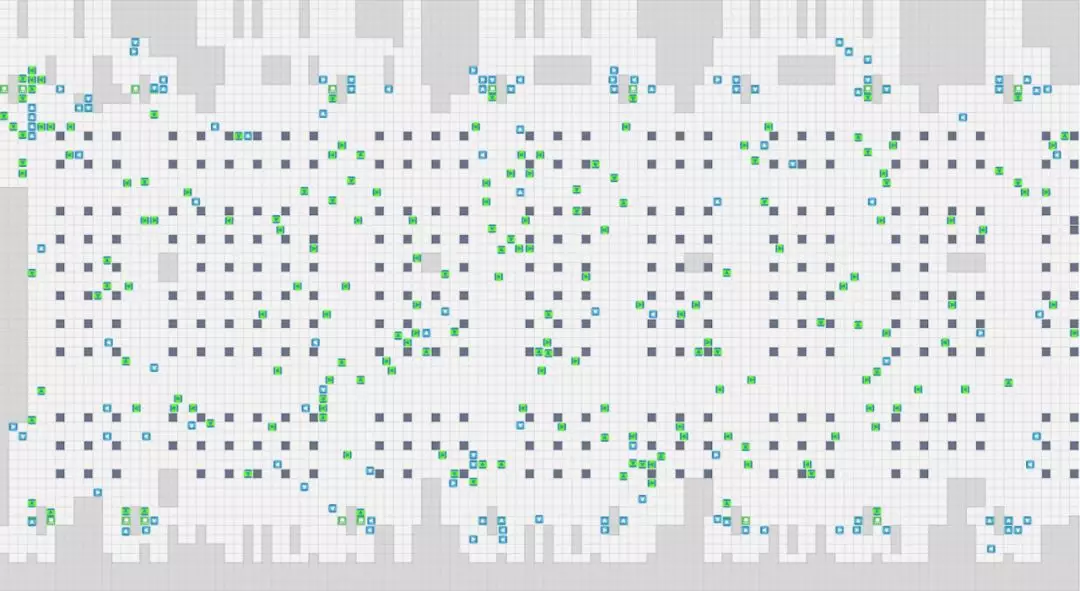
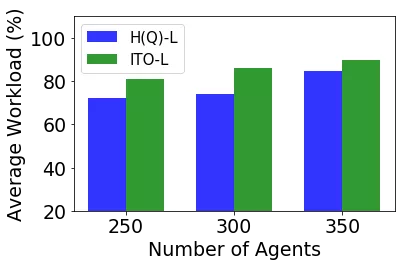
Figure 13. Screenshot of the working industrial simulator, and performance of ITO-L and H(Q)-L in the industrial simulator
The conclusion based on the preceding data is as follows:
1) On the self-test platform, both ITO-L and PITO-L performed better than other algorithms, and the minimum idle time improved the capacity by more than 10%. In fact, a sorting capacity improvement of 10% is already better for a continuously running business system.
2) In the simulator for the actual sortation center, we also achieved a capacity improvement of 11%. This reflected the scalability and practicability of our algorithms.
This article described a successful attempt for task assignment and multi-agent path planning, and TAPF in the combination of the two. We focused on researching the operation mode of leading automatic agents used in the current logistics industry, analyzed the lifelong TAPF, and first proposed the idea of improving the system efficiency by minimizing the idle time of stations. We also designed the algorithm frameworks ITO-L and PITO-L to solve lifelong TAPF problems and minimize the idle time of stations. In the experiments, we used the agent simulator and industrial simulator to verify the two algorithm frameworks. The experimental data show that our algorithms improve the system capacity by more than 10% on the two simulators. For an automatic operation system that runs in the long term, an improvement of 10% is a good performance, which enables a large number of parcels to reach customers more efficiently and also helps to ensure and improve the timeliness of logistics and drive the development of logistics automation. This article discussed our thoughts and actions in the optimization direction and algorithm design for the operation modes of logistics automation agents. In the future, we will continue to analyze industry problems, and design and polish algorithms to accelerate algorithm application and improve system efficiency.
1 posts | 0 followers
FollowAlibaba Clouder - December 13, 2019
Alibaba Clouder - January 2, 2020
Alibaba Clouder - January 2, 2020
Alibaba Clouder - May 13, 2021
Alibaba Clouder - May 31, 2018
Alibaba Clouder - January 2, 2020
1 posts | 0 followers
Follow ChatAPP
Reach global users more accurately and efficiently via IM Channel
Learn More Microservices Engine (MSE)
MSE provides a fully managed registration and configuration center, and gateway and microservices governance capabilities.
Learn More Cloud Migration Hub
Cloud Migration Hub (CMH) provides automatic and intelligent system surveys, cloud adoption planning, and migration management for you to perform migration to Alibaba Cloud.
Learn More Alibaba Cloud Linux
Alibaba Cloud Linux is a free-to-use, native operating system that provides a stable, reliable, and high-performance environment for your applications.
Learn More