本文介紹如何在CloudMonitor控制台上查看檔案網關及塊網關的監控資訊。
前提條件
已建立Cloud Storage Gateway,請參見在雲控制台上使用檔案網關。
背景資訊
從1.3.0版本開始雲上的Cloud Storage Gateway支援CloudMonitor控制台的整合監控功能。
檔案網關監控資訊包括:網關CPU使用者態空間使用率、每個共用的緩衝使用率、網關記憶體使用量率、每個共用的中繼資料使用率、每個共用的前端讀寫速度、每個共用的上傳隊列長度(僅在1.9.2及以上版本啟用)、每個共用的throttling狀態、每個共用的資料上雲速度、NFS用戶端使用串連數百分比。
重要每個共用的中繼資料使用率、每個共用的上傳隊列長度和每個共用的throttling狀態這三種指標需要您重點關注。建議您建立警示規則來監控這三種指標,具體操作請參見建立警示規則。
塊網關監控資訊包括:網關CPU使用者態空間使用率、網關記憶體使用量率、每個卷的緩衝使用率。
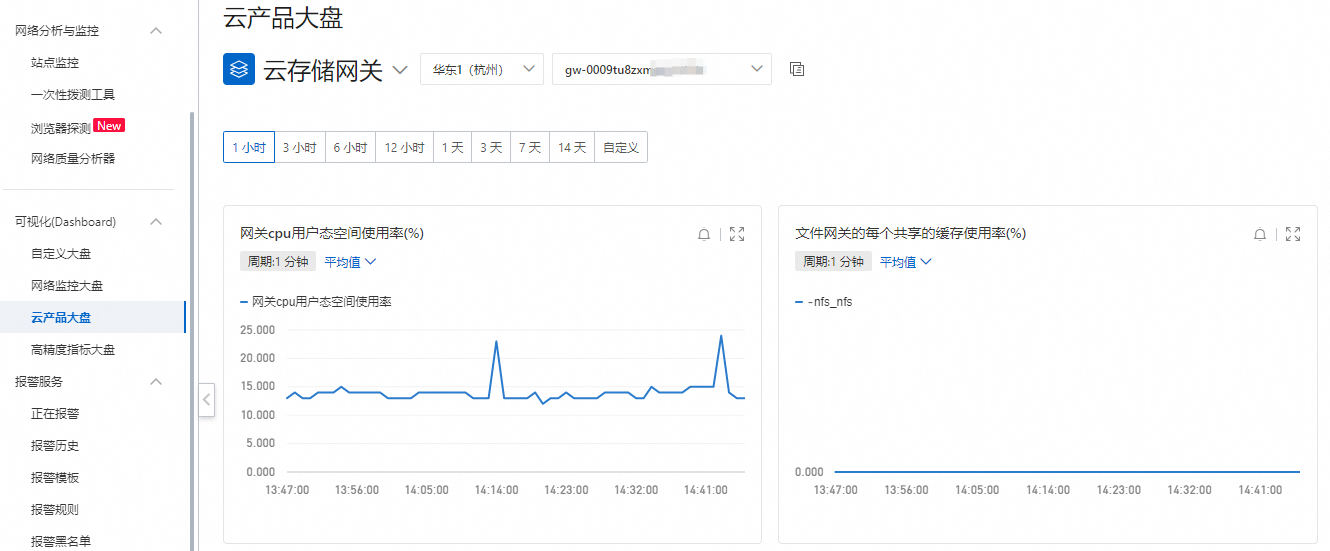
查看監控資訊
選擇。
在雲產品大盤頁面,選擇Cloud Storage Gateway及對應的地區和網關ID,查看監控圖表。
建立警示規則
在雲產品監控大盤頁面單擊建立警示規則。
在建立警示規則頁面完成如下配置後單擊確定。
參數
說明
產品
選擇Cloud Storage Gateway。
資源範圍
全部資源:選擇監控全部資源。
應用分組:選擇需要監控的應用分組。
執行個體:選擇需要監控的Cloud Storage Gateway執行個體資源範圍。
關聯資源
選擇需要監控的Cloud Storage Gateway執行個體。
規則描述
警示規則的描述資訊。
添加規則
單擊添加規則可以建立新的規則,具體操作,請參見添加規則。
通道沉默周期
選擇合適的通道沉默周期。
生效時間
請輸入規則生效的時間段。
警示連絡人群組
請選擇警示連絡人群組。
標籤
請輸入標籤名稱和標籤值。
警示回調
請輸入警示回調網域名稱。
說明以http://開頭,不能使用IP。
表 1. 添加規則
參數
說明
規則名稱
請輸入警示規則名稱。
指標類型
請選擇指標類型,取值為:
單指標:先選擇監控指標,再為其設定閾值和警示層級。
多指標:先選擇警示層級,再為兩個或兩個以上的監控指標設定警示條件。
智能閾值:關於智能閾值的更多資訊,請參見概覽和建立智能閾值警示規則。
說明智能閾值功能處於邀測階段,您需要提交工單申請。
監控指標
請選擇需要監控的指標名稱,取值為:
網關CPU使用者態空間使用率。
網關記憶體使用量率。
檔案網關的每個共用的緩衝使用率。
檔案網關的每個共用的中繼資料使用率。
檔案網關NFS用戶端使用串連數百分比。
檔案網關的每個共用的前端讀寫速度。
檔案網關的每個共用的throtting狀態。
上傳隊列。
檔案網關的每個共用的資料上雲速度。
塊網關的每個卷的緩衝使用率。
請選擇維度
請選擇需要監控的共用維度,如不選擇,則監控所有共用。
比較
監控值和閾值比較,在特定條件下觸發警示,取值為:
>=:大於等於閾值時觸發警示。
>:大於閾值時觸發警示。
<=:小於等於閾值時觸發警示。
<:小於閾值時觸發警示。
=:等於閾值時觸發警示。
!=:不等於閾值時觸發警示。
同比昨天同時間上漲時觸發警示。
同比昨天同時間下降時觸發警示。
同比上周同時間上漲時觸發警示。
同比上周同時間下降時觸發警示。
環比上周期上漲時觸發警示。
環比上周期下降時觸發警示。
閾值及警示層級
請配置閾值及警示層級。
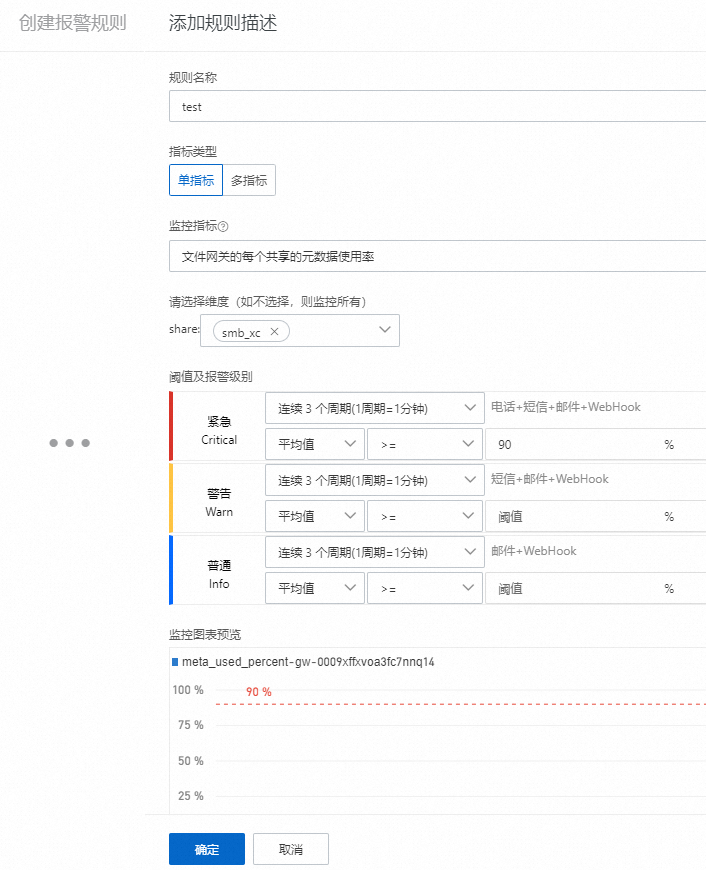
建立樣本
下面以建立一個中繼資料空間使用率大於等於90%的警示為例,介紹如何建立警示規則。
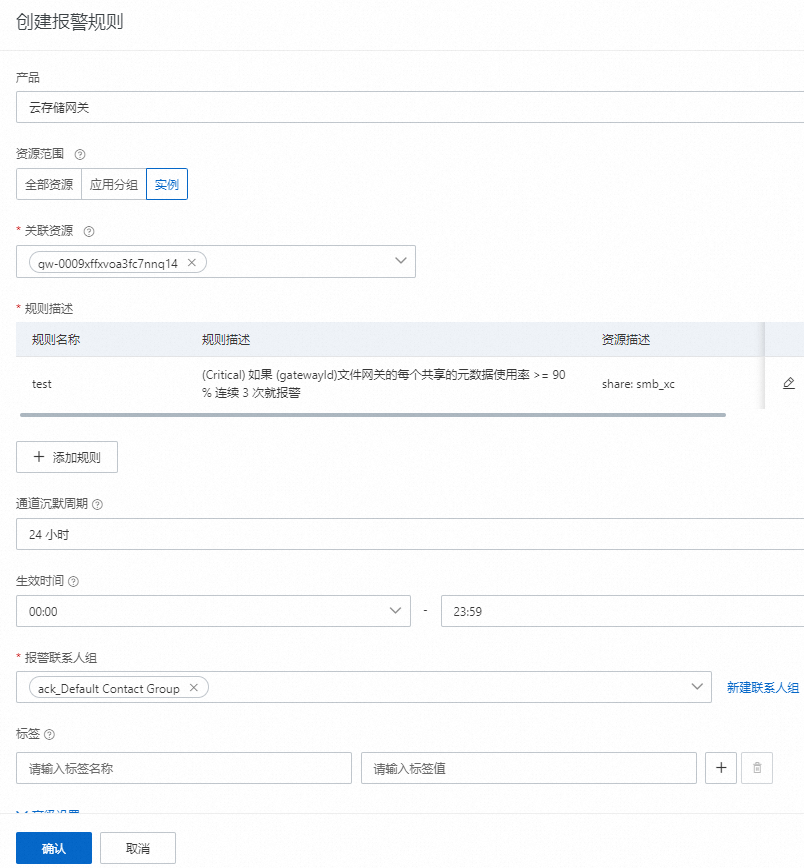
在雲產品監控大盤頁面單擊建立警示規則。
產品選擇Cloud Storage Gateway。
資源範圍選取執行個體。
關聯資源選擇需要監控的網關執行個體。
單擊添加規則進入添加規則描述頁面。
在添加規則描述頁面輸入規則名稱,指標類型選擇單指標,監控指標選擇檔案網關的每個共用的中繼資料使用率,監控維度裡選擇需要監控的共用,警示層級選擇緊急Critical,閾值輸入90後單擊確定返回建立警示規則頁面。
在建立警示規則頁面選擇警示連絡人群組後單擊確認。
相關操作
應用情境不同,您可以選擇不同的時間粒紋,也可以進行自訂時間粒紋。
配置項 | 說明 |
監控時間粒紋 | 可選項:1小時、3小時、6小時、12小時、1天、3天、7天、14天。 |
自訂時間粒紋 | 30天內的查詢提供分鐘粒度的資料,最多連續查詢7天資料。 |