問題の説明
Simple Log Serviceはログデータの収集に失敗します。
解決策
rsyslogサービスの確認
ログデータの収集に失敗したElastic Compute Service (ECS) インスタンスにログインします。 rsyslogサービスのsyslog.conf設定ファイルを確認してください。 次の内容に似た情報がファイルに含まれています。
$WorkDirectory /var/spool/rsyslog # where to place spool files
$ActionQueueFileName fwdRule1     # unique name prefix for spool files
$ActionQueueMaxDiskSpace 1g       # 1gb space limit (use as much as possible)
$ActionQueueSaveOnShutdown on     # save messages to disk on shutdown
$ActionQueueType LinkedList       # run asynchronously
$ActionResumeRetryCount -1        # infinite retries if host is down
# Fields for log data.
$template ALI_LOG_FMT,"0.1 sys_tag %timegenerated:::date-unixtimestamp% %fromhost-ip% %hostname%
%pri-text% %protocol-version% %app-name% %procid% %msgid% %msg:::drop-last-lf%\n"
*.*      @@[ip]:[port];ALI_LOG_FMT	# The first asterisk (*) specifies all message types. The second asterisk (*) specifies all message levels. Two at signs (@@) specify TCP. One at sign (@) specifies UDP. [ip] specifies the IP address of the host to which a syslog message is forwarded. [port] specifies the port. ALI_LOG_FMT specifies the name of the template. You can configure multiple templates. $template specifies the identifier of the template. The content of the template is enclosed in double quotation marks (""). 0.1 specifies the version number of the log format. Logtail parses the user-defined field by using the version number. sys_tag specifies a data tag. You can use sys_tag to identify the tag of a project or Logstore in the Log Service console. timegenerated:::date-unixtimestamp% specifies the timestamp of the log. %fromhost-ip% specifies the IP address of the server from which the log is collected. If the value of %fromhost-ip% in a log is 127.0.0.1, the system replaces 127.0.0.1 with the peer IP address of the TCP socket when the system sends the log to Log Service. % hostname% ~~ %msgid % is a user-defined field. The fields that are enclosed in brackets [] are optional. %msg:::drop-last-lf% specifies the body of the log message.
次のコマンドを実行して、rsyslogサービスが開始されているかどうかを確認します。
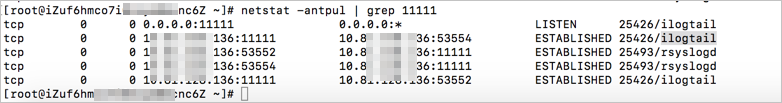
service rsyslog status次のコマンドを実行して、rsyslogサービスのリスニングポートと転送ポートを確認します。
netstat -antpul |grep 11111次のようなコンテンツが表示されます。 次のrsyslogプロセスでは、2つのソケットがデータを監視し、ローカルマシンのポートに転送します。 1つのソケットがポート53552を監視し、データをポート11111に転送する。 他のソケットはポート53554を監視し、データをポート11111に転送する。 syslog.conf設定ファイルには2つのルールが設定されています。 したがって、データの監視と転送には2つのソケットのみが使用されます。 さらに、3つのLogtailサービスが開始され、2つのLogtailサービスがESTABLISHED状態になり、監視に使用されます。 2つのrsyslogサービスはESTABLISHED状態であり、監視に使用されます。
Logtailサービスの確認
次のコマンドを実行して、Logtailサービスのステータスを確認します。
/etc/init.d/ilogtaild statusilogtail.LOGにアクセスして、Logtailサービスでエラーが報告されているかどうかを確認します。
マシングループのステータスの確認
マシングループのステータスを確認します。 詳細については、「Logtailマシングループにハートビートがない場合はどうすればよいですか? 」をご参照ください。
Simple Log Serviceコンソールでエラー情報を確認する
報告されたエラーに関する情報を表示し、Simple Log Serviceで問題を特定します。 詳細については、「Logtail収集エラーの表示方法? 」をご参照ください。
[プレビュー] をクリックして、ログデータが収集されたかどうかを確認します。 ログデータが収集されてもデータをクエリできない場合、インデックスが有効になっていないか、インデックス設定が無効です。 詳細については、「ログの照会と分析」をご参照ください。