クラウドネイティブAIモニタリングコンポーネントack-arena-exporterをインストールして、クラスター、ノード、またはトレーニングジョブごとにGPUリソースの使用をモニタリングし、さまざまな名前空間のリソースクォータに関する洞察を得ることができます。 このトピックでは、クラスター、ノード、トレーニングジョブ、およびリソースクォータのダッシュボードについて説明します。 このトピックでは、ack-arena-exporterをインストールしてこれらのダッシュボードを操作する方法についても説明します。
前提条件
Container Service for Kubernetes (ACK) Proクラスターのみがサポートされており、Kubernetesバージョンのクラスターは1.18.8以降である必要があります。
V0.7.0以降のArenaコンポーネントがインストールされています。 詳細については、「Arenaクライアントの設定」をご参照ください。
ack-arms-prometheusモニタリングコンポーネントをインストールします。 詳細については、「arms-prometheus」をご参照ください。
AIダッシュボードコンポーネントがインストールされています。 詳細については、「クラウドネイティブAIスイートのデプロイ」をご参照ください。
背景情報
Arenaを使用してトレーニングジョブを送信した後、クラスター、ノード、トレーニングジョブ、またはリソースクォータごとにGPUとGPUメモリの使用を監視することができます。 従来のACKクラスターでは、特定のノードでのみGPUリソース (GPU使用率、GPUメモリ使用率、GPU電力を含む) の使用を監視したり、特定のポッドで使用されているGPUリソースを表示したりできます。
より多くのディメンションでリソース使用量を監視するために、ACKはクラウドネイティブAIダッシュボードを提供します。 従来のACKクラスターのGPUダッシュボードと比較して、AIダッシュボードには次の利点があります。
AIダッシュボードは、クラスターダッシュボード、ノードダッシュボード、トレーニングジョブダッシュボード、およびリソースクォータダッシュボードで構成されます。
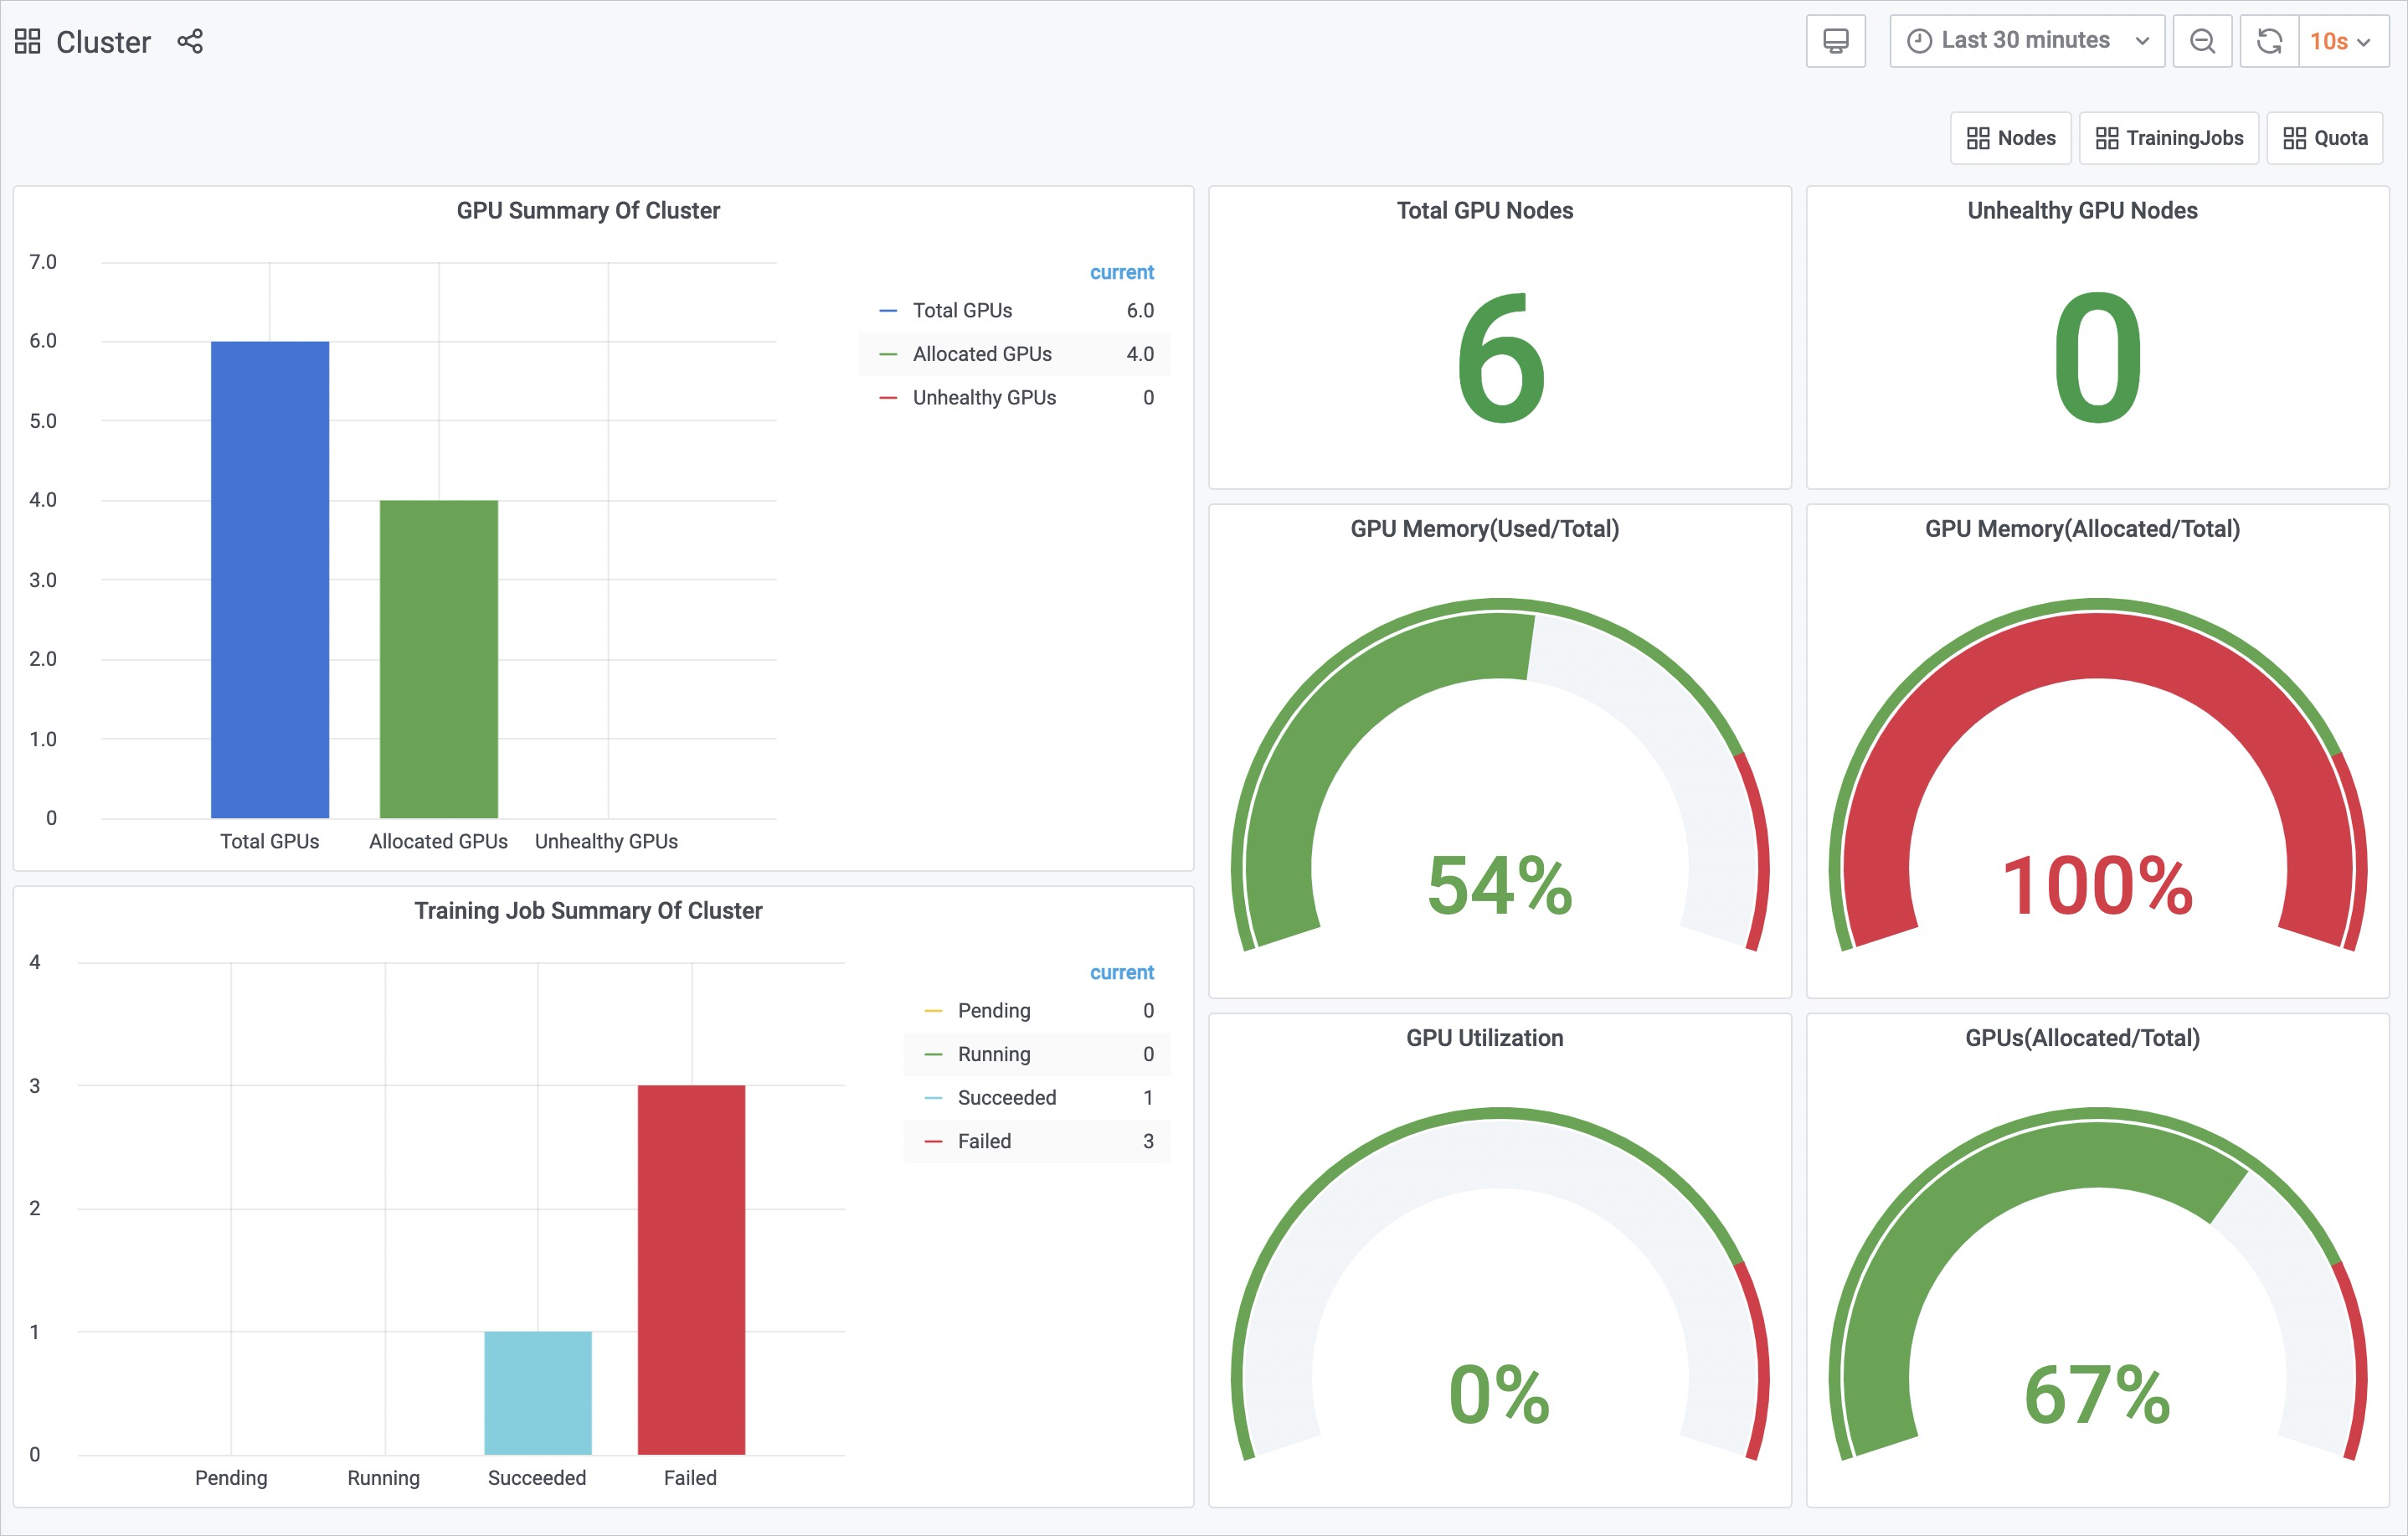
クラスターダッシュボードには、GPU で高速化したノードの総数や異常な GPU で高速化したノードの数、GPU の平均使用率、さまざまな状態のトレーニングジョブ数が表示されます。
ノードダッシュボードには、GPU の総数、割り当てられた GPU の数、GPU 使用率、および各ノードの GPU のメモリ使用量が表示されます。
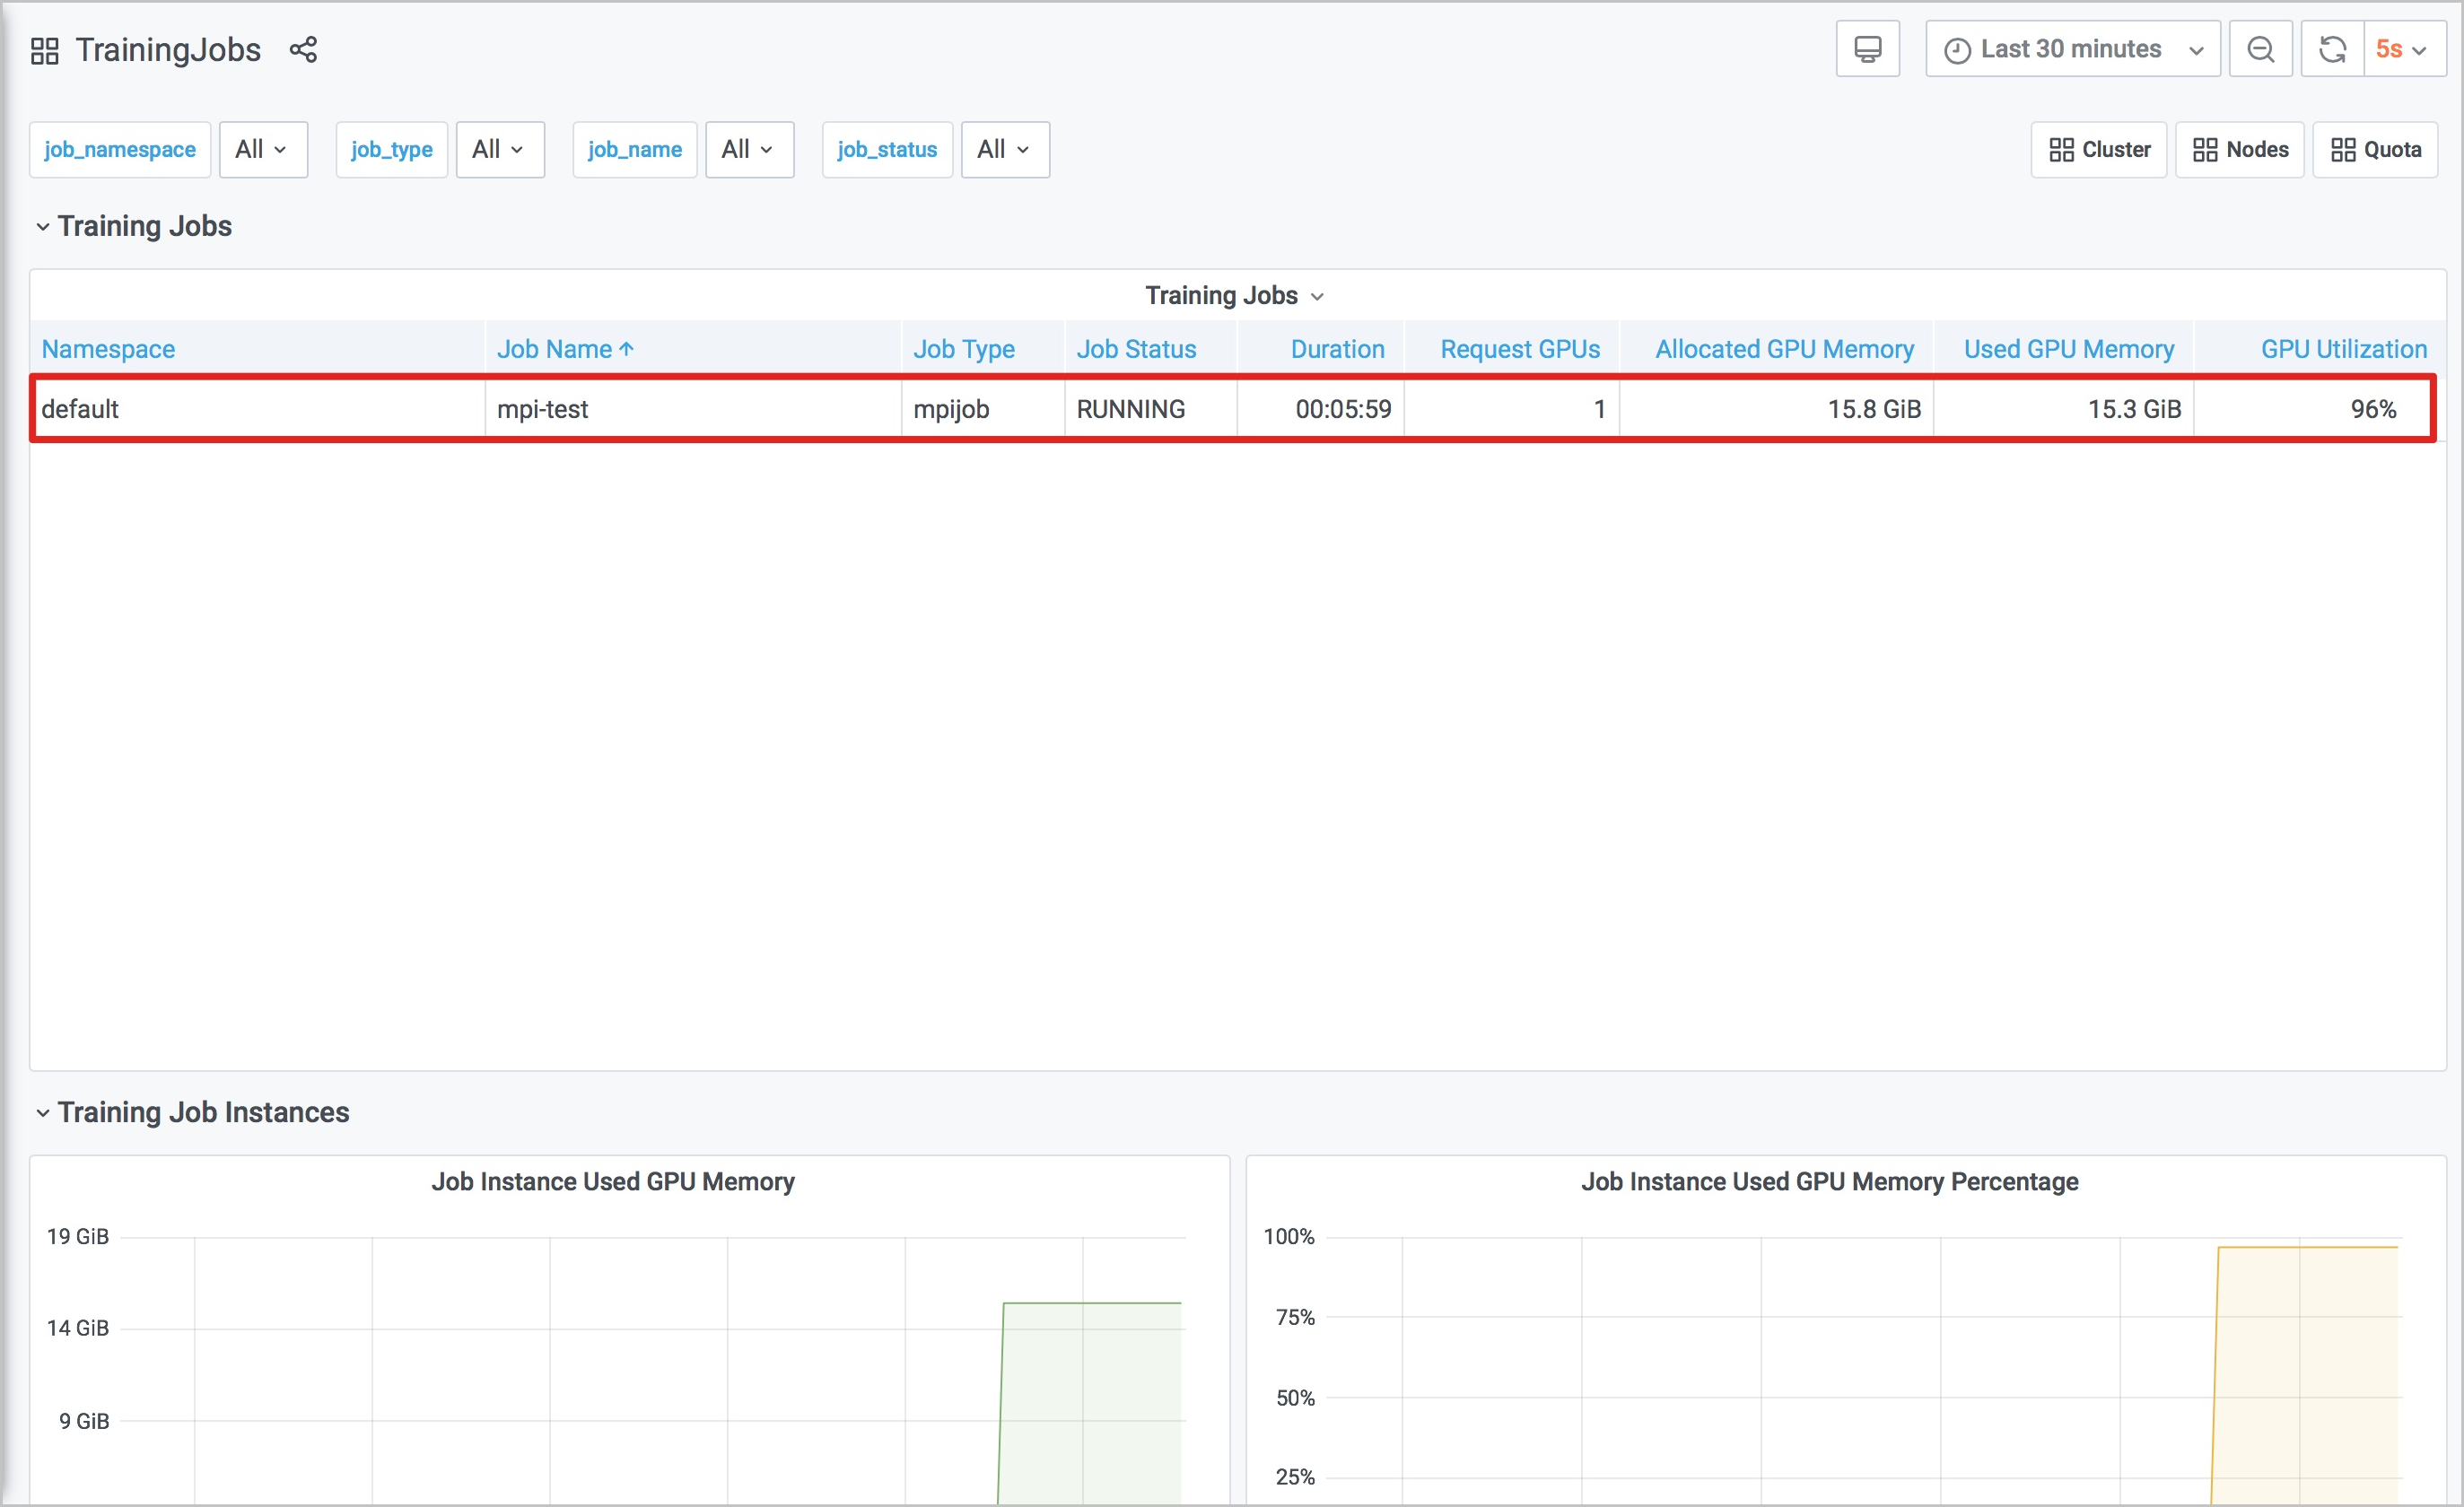
トレーニングジョブダッシュボードには、各トレーニングジョブの状態、期間、要求された GPU の数、GPU の平均使用率、GPU のメモリ使用量が表示されます。
リソースクォータダッシュボードでは、特定の名前空間におけるリソースタイプの割り当てと使用状況が、Max Quota、Min Quota、Used Quota などで表示されます。
ack-arena-exporterをインストールする
ACKコンソールにログインします。 左側のナビゲーションウィンドウで、[クラスター] をクリックします。
[クラスター] ページで、管理するクラスターの名前をクリックします。 左側のウィンドウで、 を選択します。
ack-arena-exporterをインストールします。
クラウドネイティブAIスイートをインストールしている場合:
[クラウドネイティブAIスイート] ページで、[ack-arena-exporter] という名前のクラウドネイティブAIモニタリングコンポーネントを見つけ、[操作] 列の [デプロイ] をクリックします。
クラウドネイティブAIスイートをインストールしていない場合:
[クラウドネイティブAI Suite] ページで、[デプロイ] をクリックします。 [モニタリング] セクションで、[モニタリングコンポーネント] を選択し、[クラウドネイティブAIスイートのデプロイ] をクリックします。
AIダッシュボードの概要
AIダッシュボードにログインすると、デフォルトでクラスターダッシュボードにリダイレクトされます。 ページの![]() 左上隅にあるアイコンをクリックして、ダッシュボードを切り替えます。
左上隅にあるアイコンをクリックして、ダッシュボードを切り替えます。
Cluster: Cluster dashboard
ノード: ノードダッシュボード
TrainingJobs: トレーニングジョブダッシュボード
クォータ: リソースクォータダッシュボード
クラスターダッシュボード
詳細については、「方法1: インターネットに接続されたIngressを使用してAIダッシュボードにアクセスする」をご参照ください。
クラスターダッシュボードで次のメトリクスを表示できます。
GPUクラスターの概要: クラスター内のGPUアクセラレーションノードの総数、割り当てられたGPUアクセラレーションノードの数、および正常でないGPUアクセラレーションノードの数を表示します。
Total GPU Nodes: クラスター内のGPUアクセラレーションノードの総数を表示します。
異常なGPUノード: クラスター内の異常なGPUアクセラレーションノードの数を表示します。
GPUメモリ (使用 /合計): クラスターで使用されているGPUメモリの合計に対する比率を表示します。
GPUメモリ (割り当て済み /合計): クラスターによって割り当てられたGPUメモリの合計に対する比率を表示します。
[GPU 使用率] :クラスターにおける GPU の平均使用率。
GPU (割り当て済み /合計): GPUの総数に対するクラスターによって割り当てられたGPUの数の比率を表示します。
[クラスターのトレーニングジョブの概要]: [実行中] 、[保留中] 、[成功] 、[失敗] の状態にあるトレーニングジョブの数を表示します。
ノードダッシュボード
[クラスター] ページで、右上隅の [ノード] をクリックして、ノードダッシュボードに移動します。
ノードダッシュボードでは、次のメトリックを表示できます。
GPUノードの詳細: クラスターノードに関する情報をテーブルに表示します。 次の情報が表示されます。
各ノードの名前
クラスター内の各ノードのIPアドレス
クラスター内の各ノードの役割
各ノードのステータス
各ノードのGPUモード: 排他的または共有
各ノードが所有するGPUの数
各ノードが所有するGPUメモリの総量
各ノードに割り当てられたGPUの数
各ノードに割り当てられたGPUメモリの量
各ノードで使用されるGPUメモリの量
各ノードの平均GPU使用率
GPUデューティサイクル: 各ノードの各GPUの使用率を表示します。
GPUメモリ使用量: 各ノードの各GPUのメモリ使用量を表示します。
GPUメモリ使用率: 各ノードのGPUごとのメモリ使用率を表示します。
[ノードごとに割り当てられたGPU]: 各ノードに割り当てられたGPUの数を表示します。
ノードあたりのGPU数: 各ノードのGPUの総数を表示します。
ノードあたりのGPUメモリの合計: 各ノードのGPUメモリの合計量を表示します。
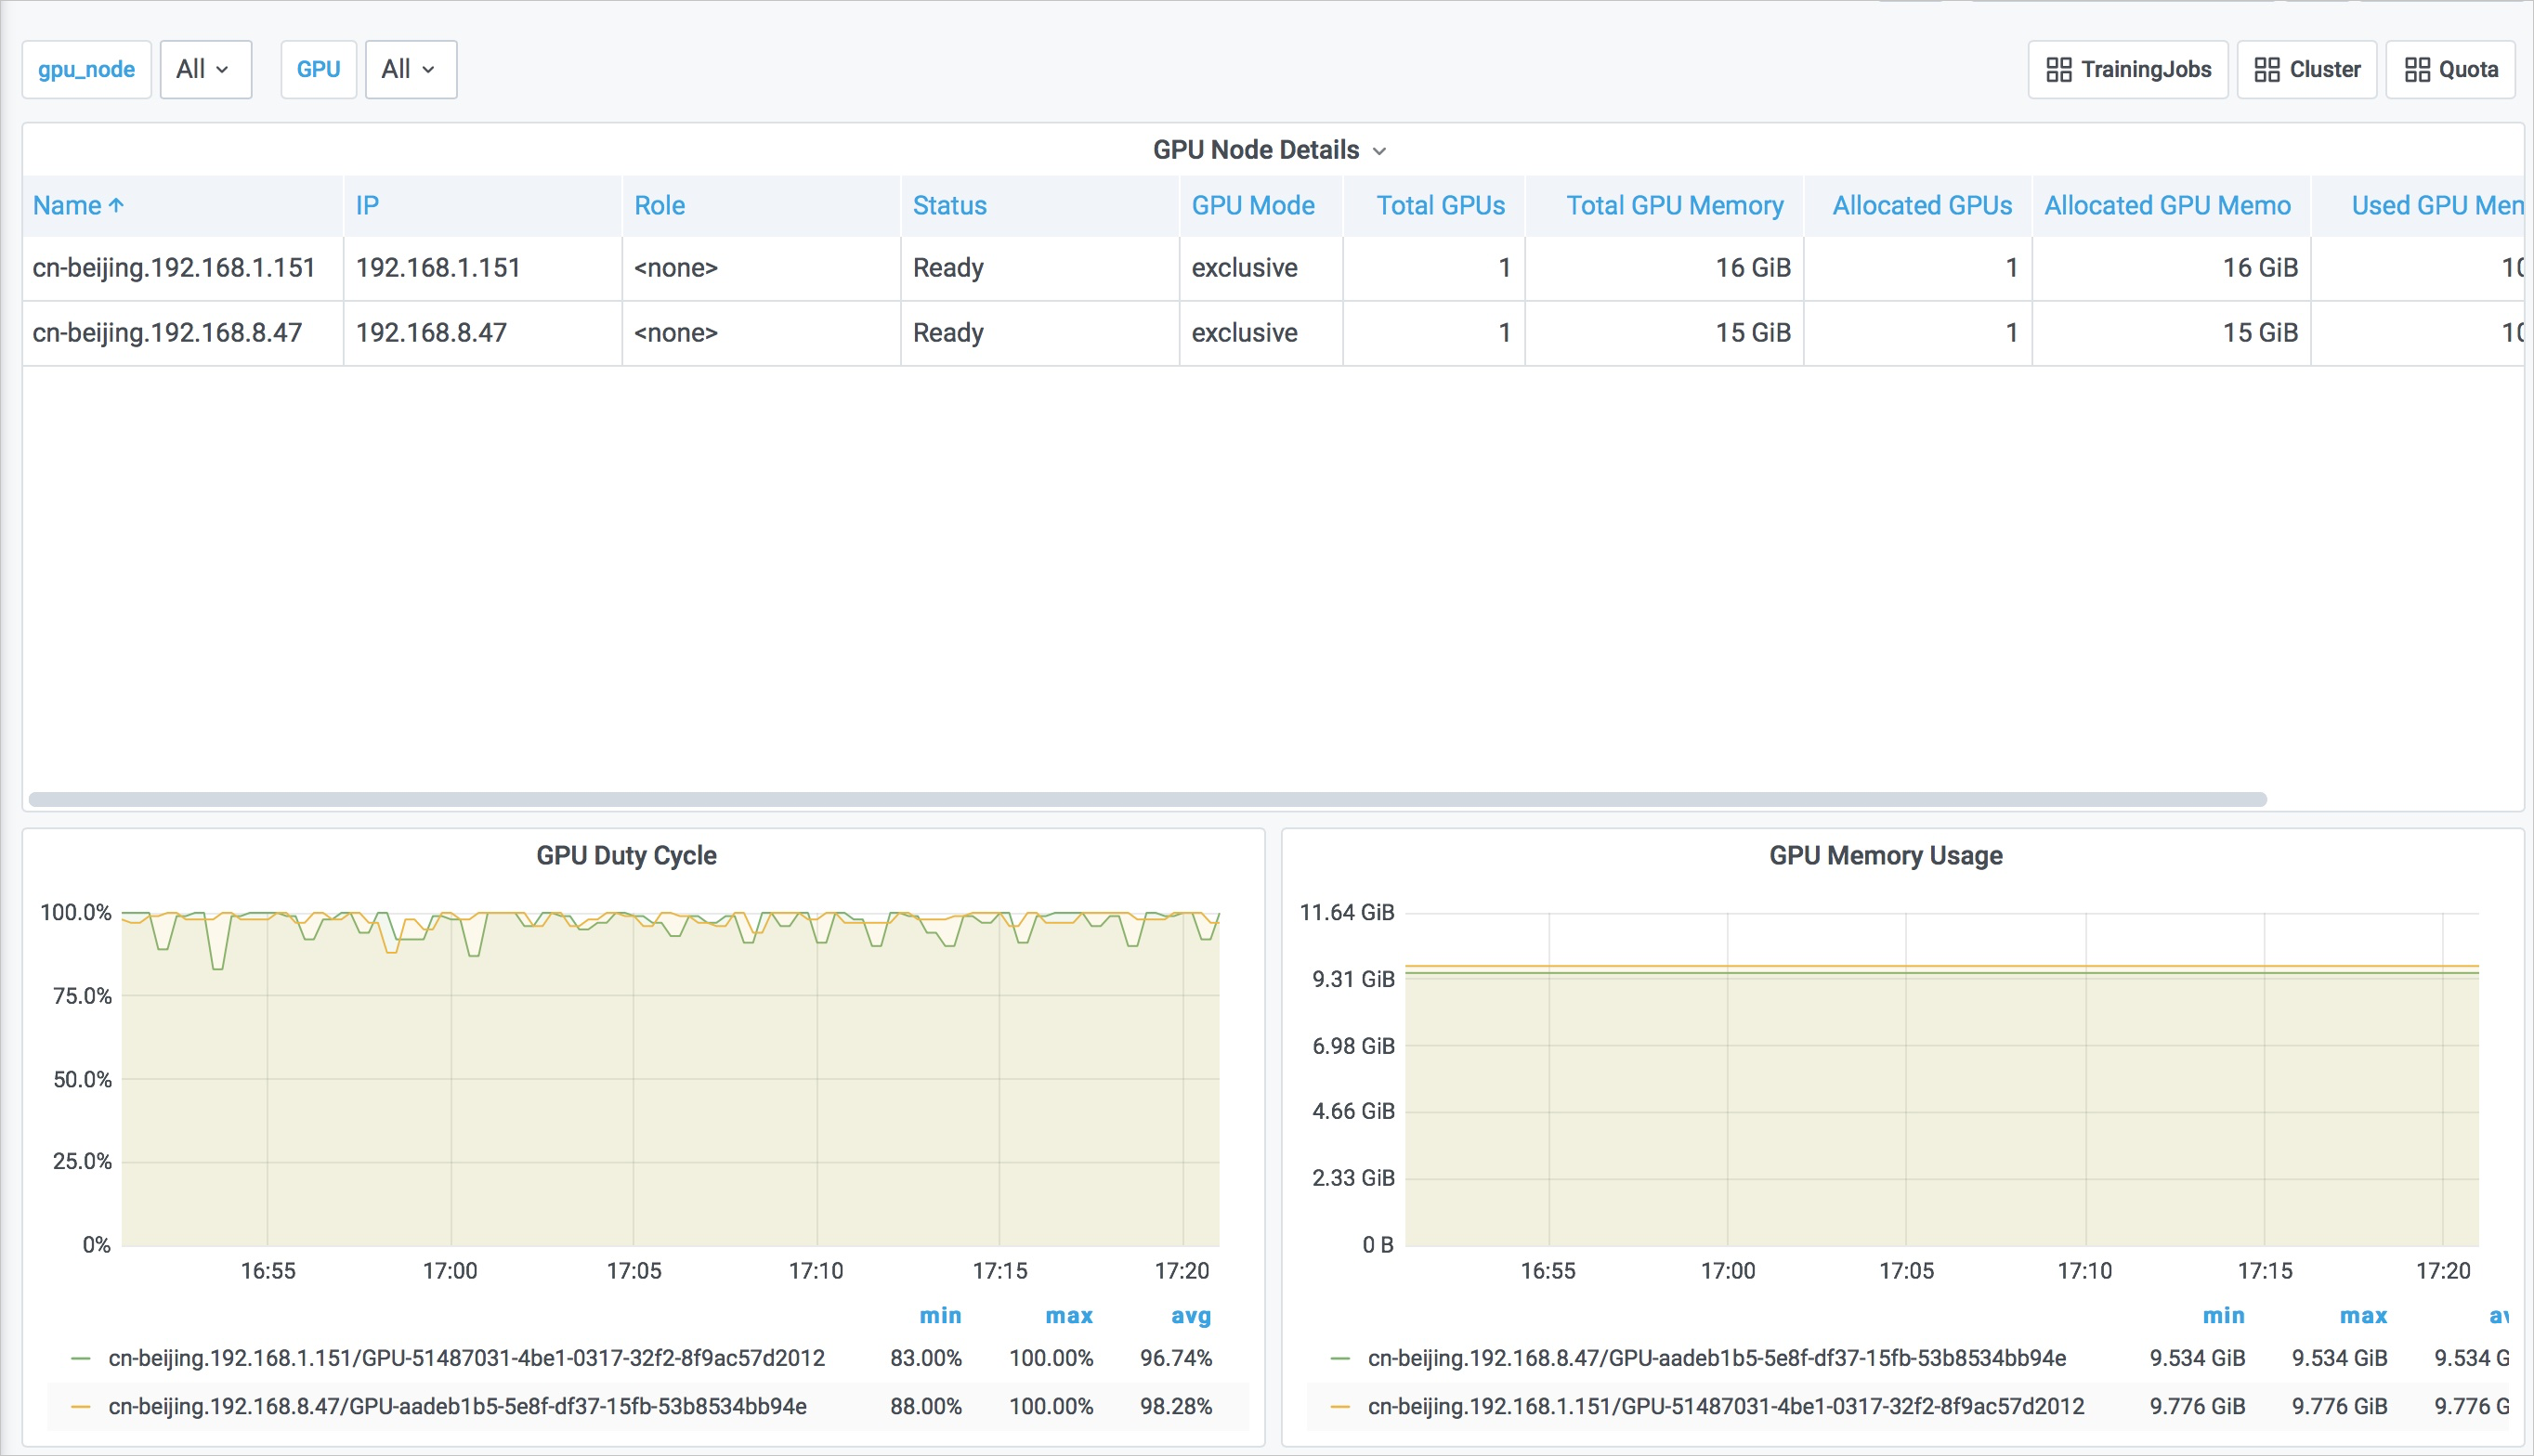
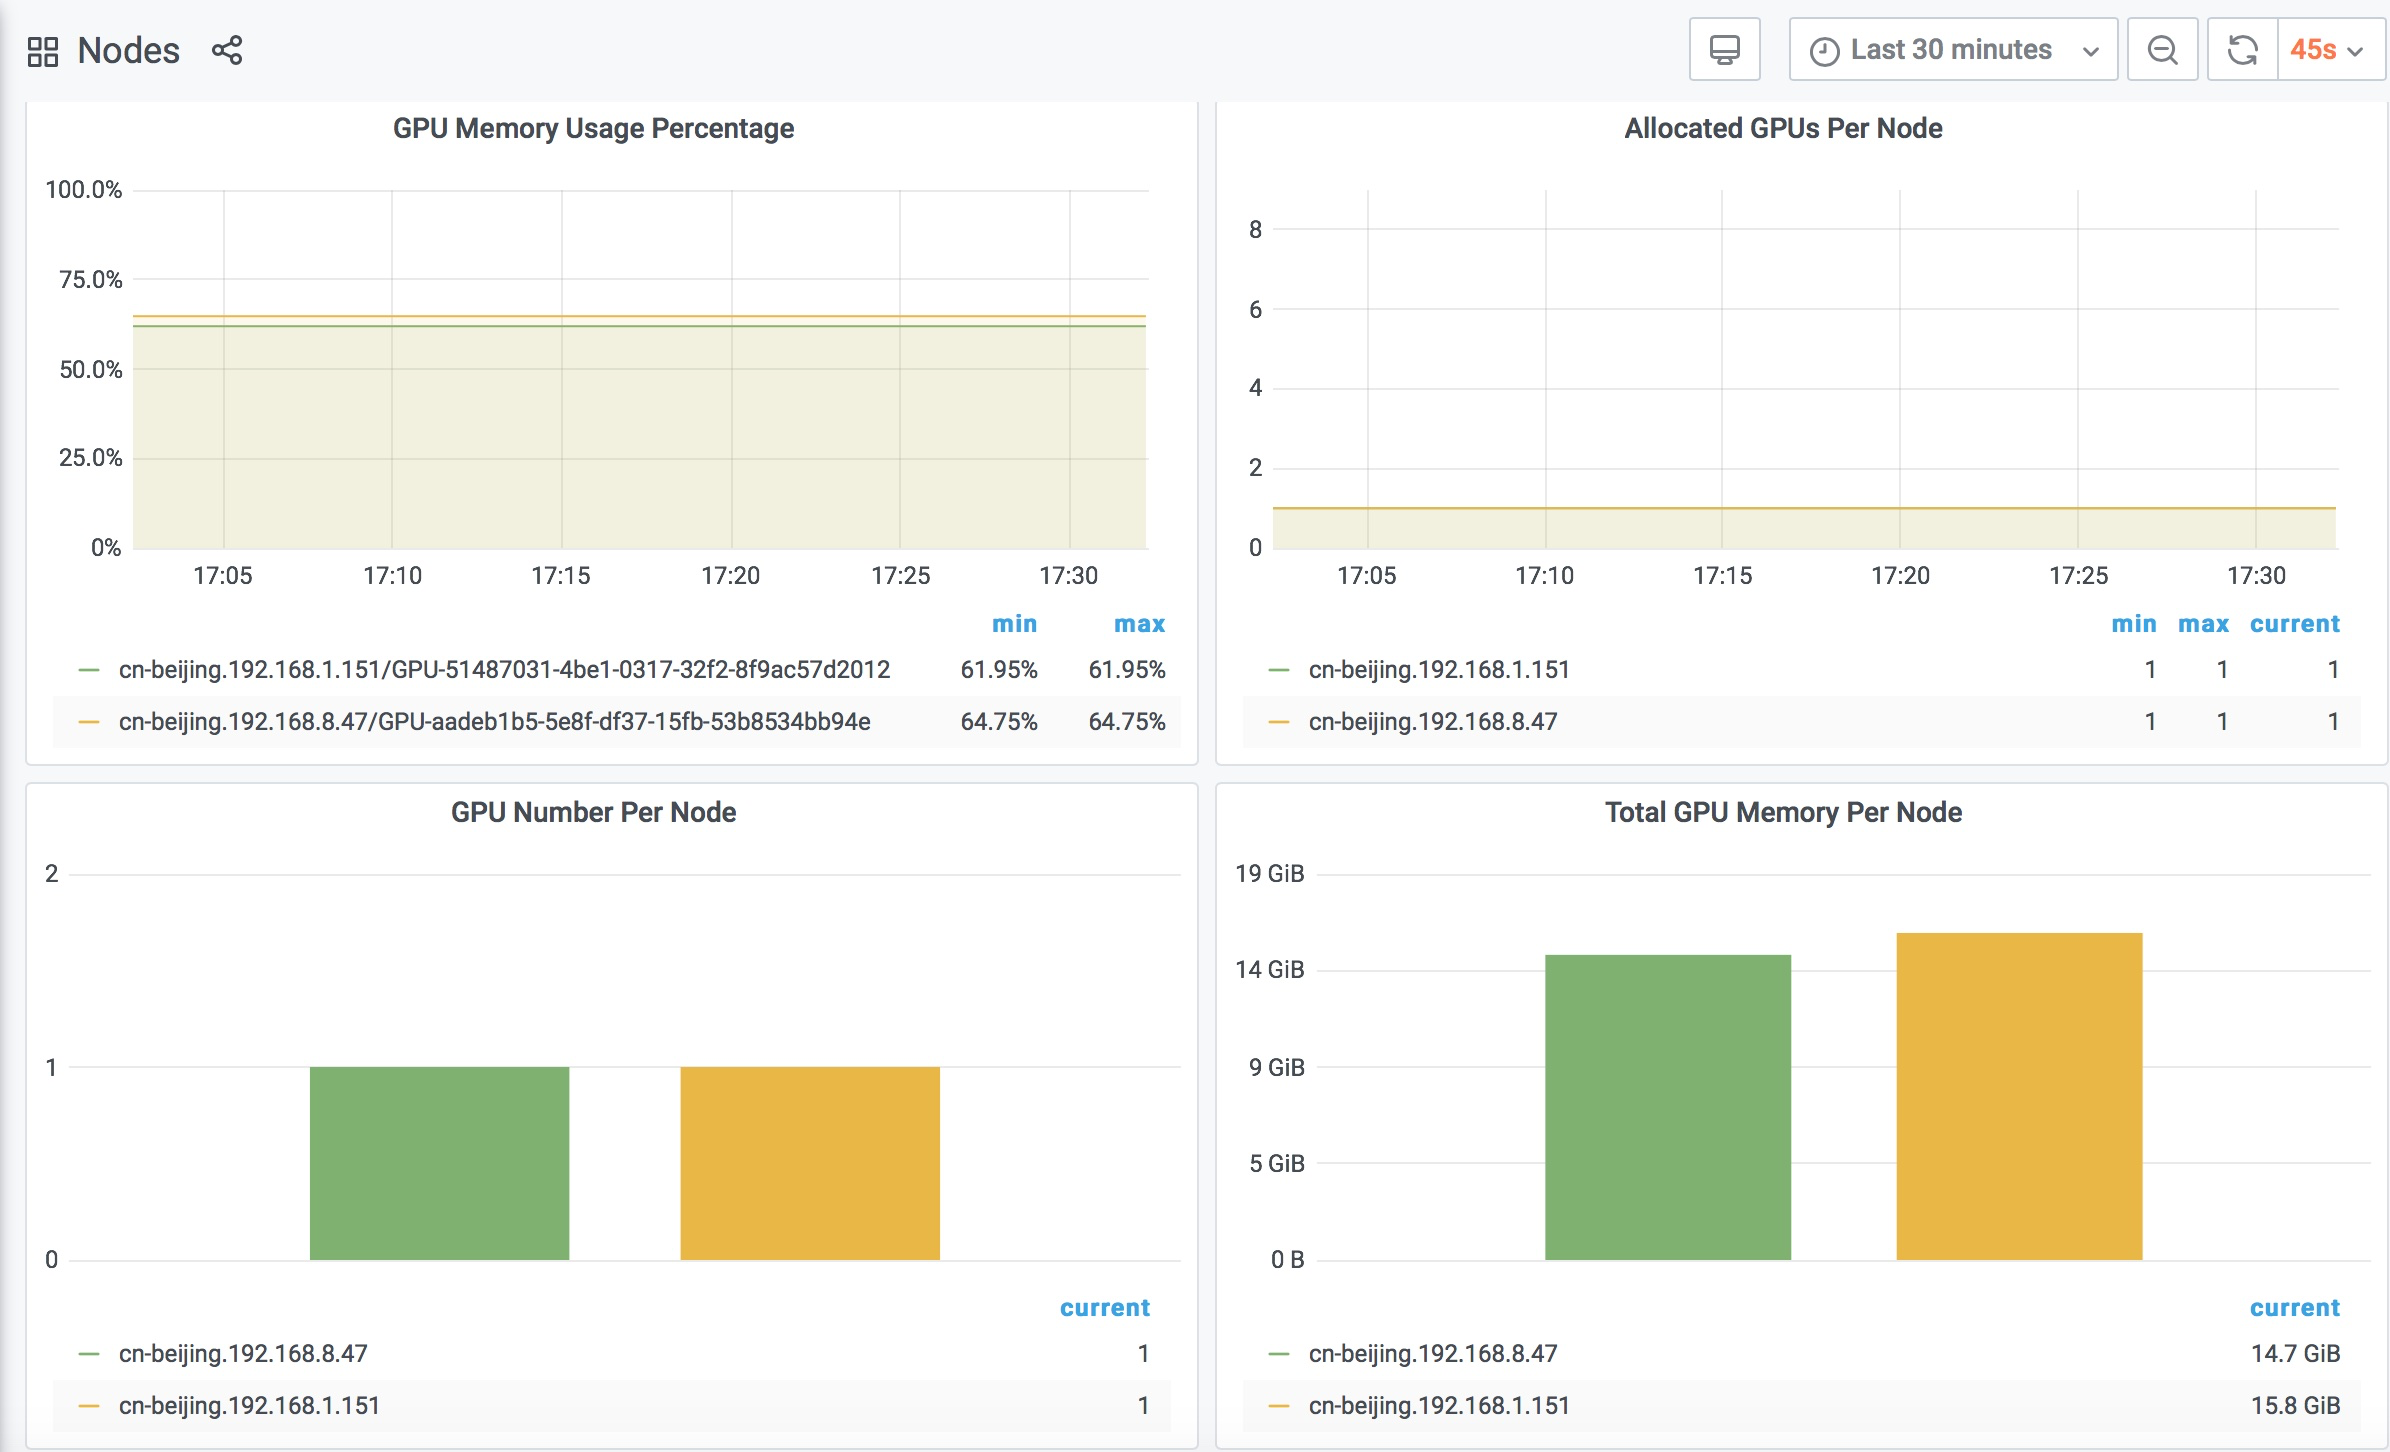
ノードページの左上隅にあるgpu_nodeフィルターとGPUフィルターを使用して、ノードとgpuをフィルター処理できます。 これにより、指定したノードでのみGPUの使用状況を表示できます。

Training job dashboard
[ノード] ページで、右上隅の [トレーニングジョブ] をクリックして、トレーニングジョブダッシュボードに移動します。
トレーニングジョブダッシュボードでは、次のメトリックを表示できます。
トレーニングジョブ: 各トレーニングジョブに関する情報をテーブルに表示します。 次の情報が表示されます。
各トレーニングジョブの名前空間
各トレーニングジョブの名前
各トレーニングジョブのタイプ
各トレーニングジョブのステータス
各トレーニングジョブの期間
各トレーニングジョブによって要求されるGPUの数
各トレーニングジョブによって要求されるGPUメモリの量
各トレーニングジョブで使用されるGPUメモリの量
各トレーニングジョブの平均GPU使用率
ジョブインスタンス使用済みGPUメモリ: 各ジョブインスタンスで使用されているGPUメモリの量を表示します。
ジョブインスタンス使用済みGPUメモリの割合: 各ジョブインスタンスで使用されているGPUメモリの割合を表示します。
ジョブインスタンスのGPUデューティサイクル: 各ジョブインスタンスのGPU使用率を表示します。
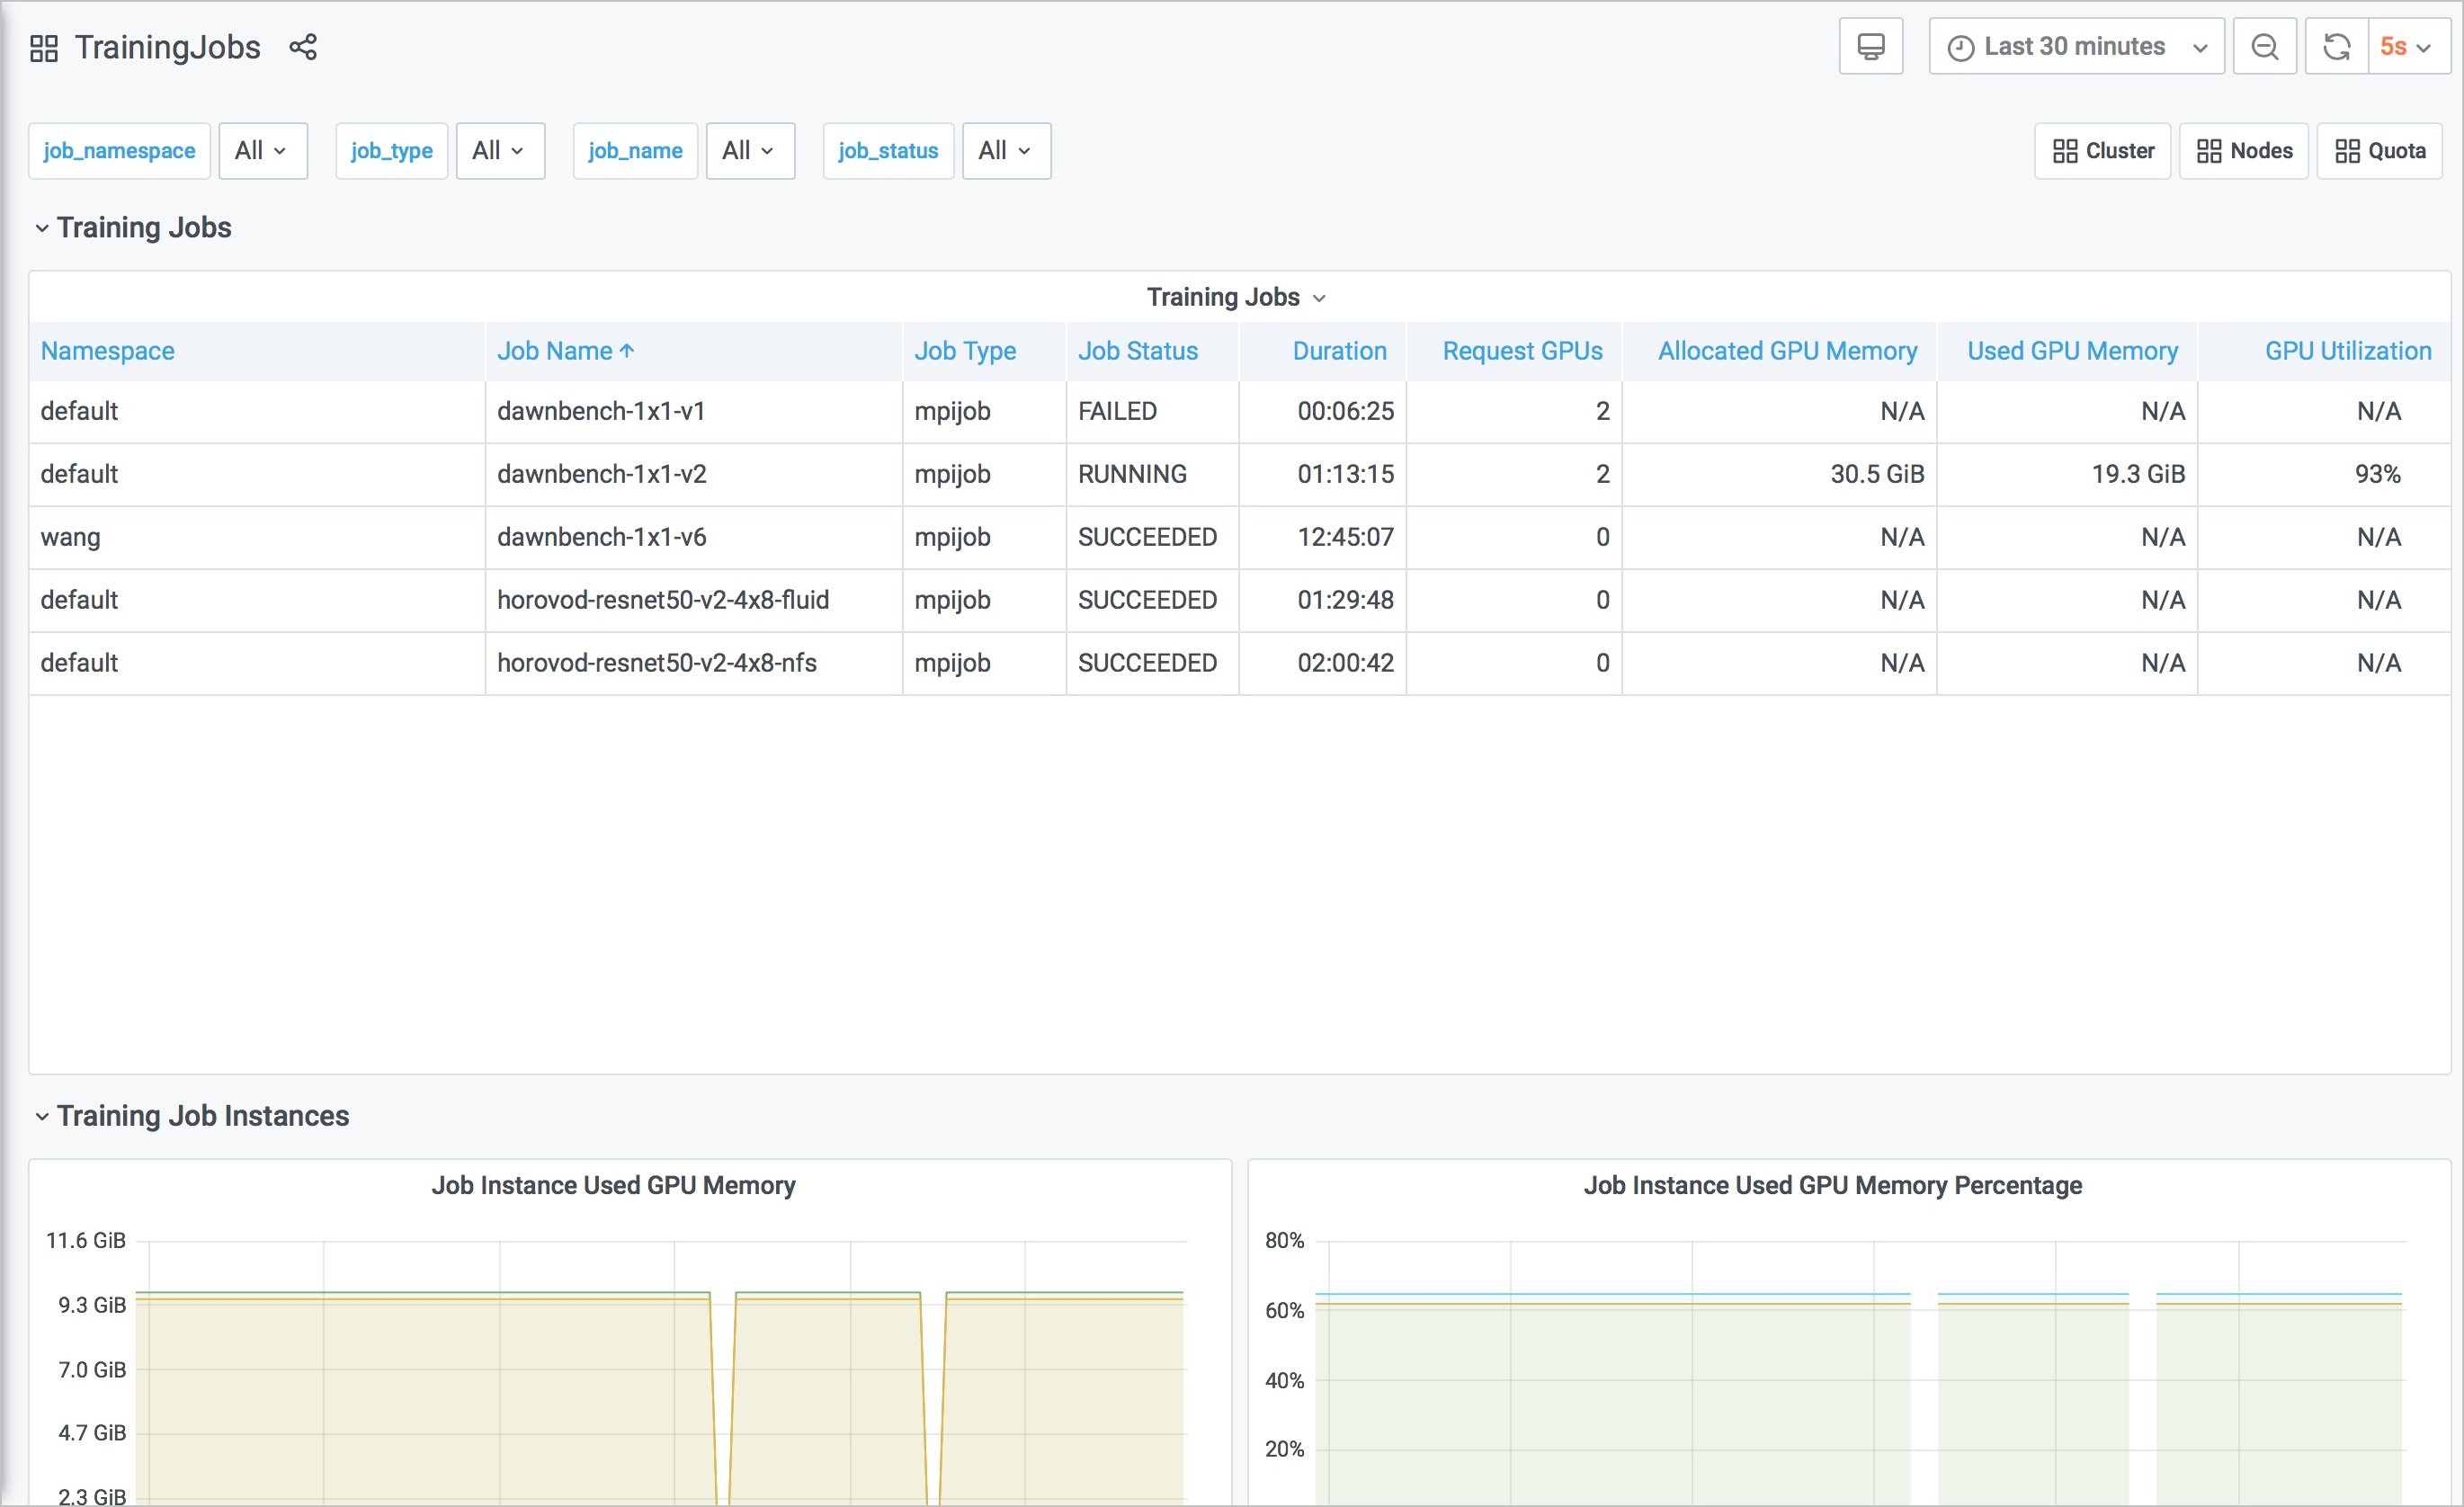
job_namespace、job_type、およびjob_nameフィルターを使用して、名前空間、タイプ、および名前でトレーニングジョブをフィルターできます。 これにより、指定されたトレーニングジョブに関する詳細情報のみを表示できます。

リソース割り当てダッシュボード
[トレーニングジョブ] ページで、右上隅の [クォータ] をクリックして、リソースクォータダッシュボードに移動します。
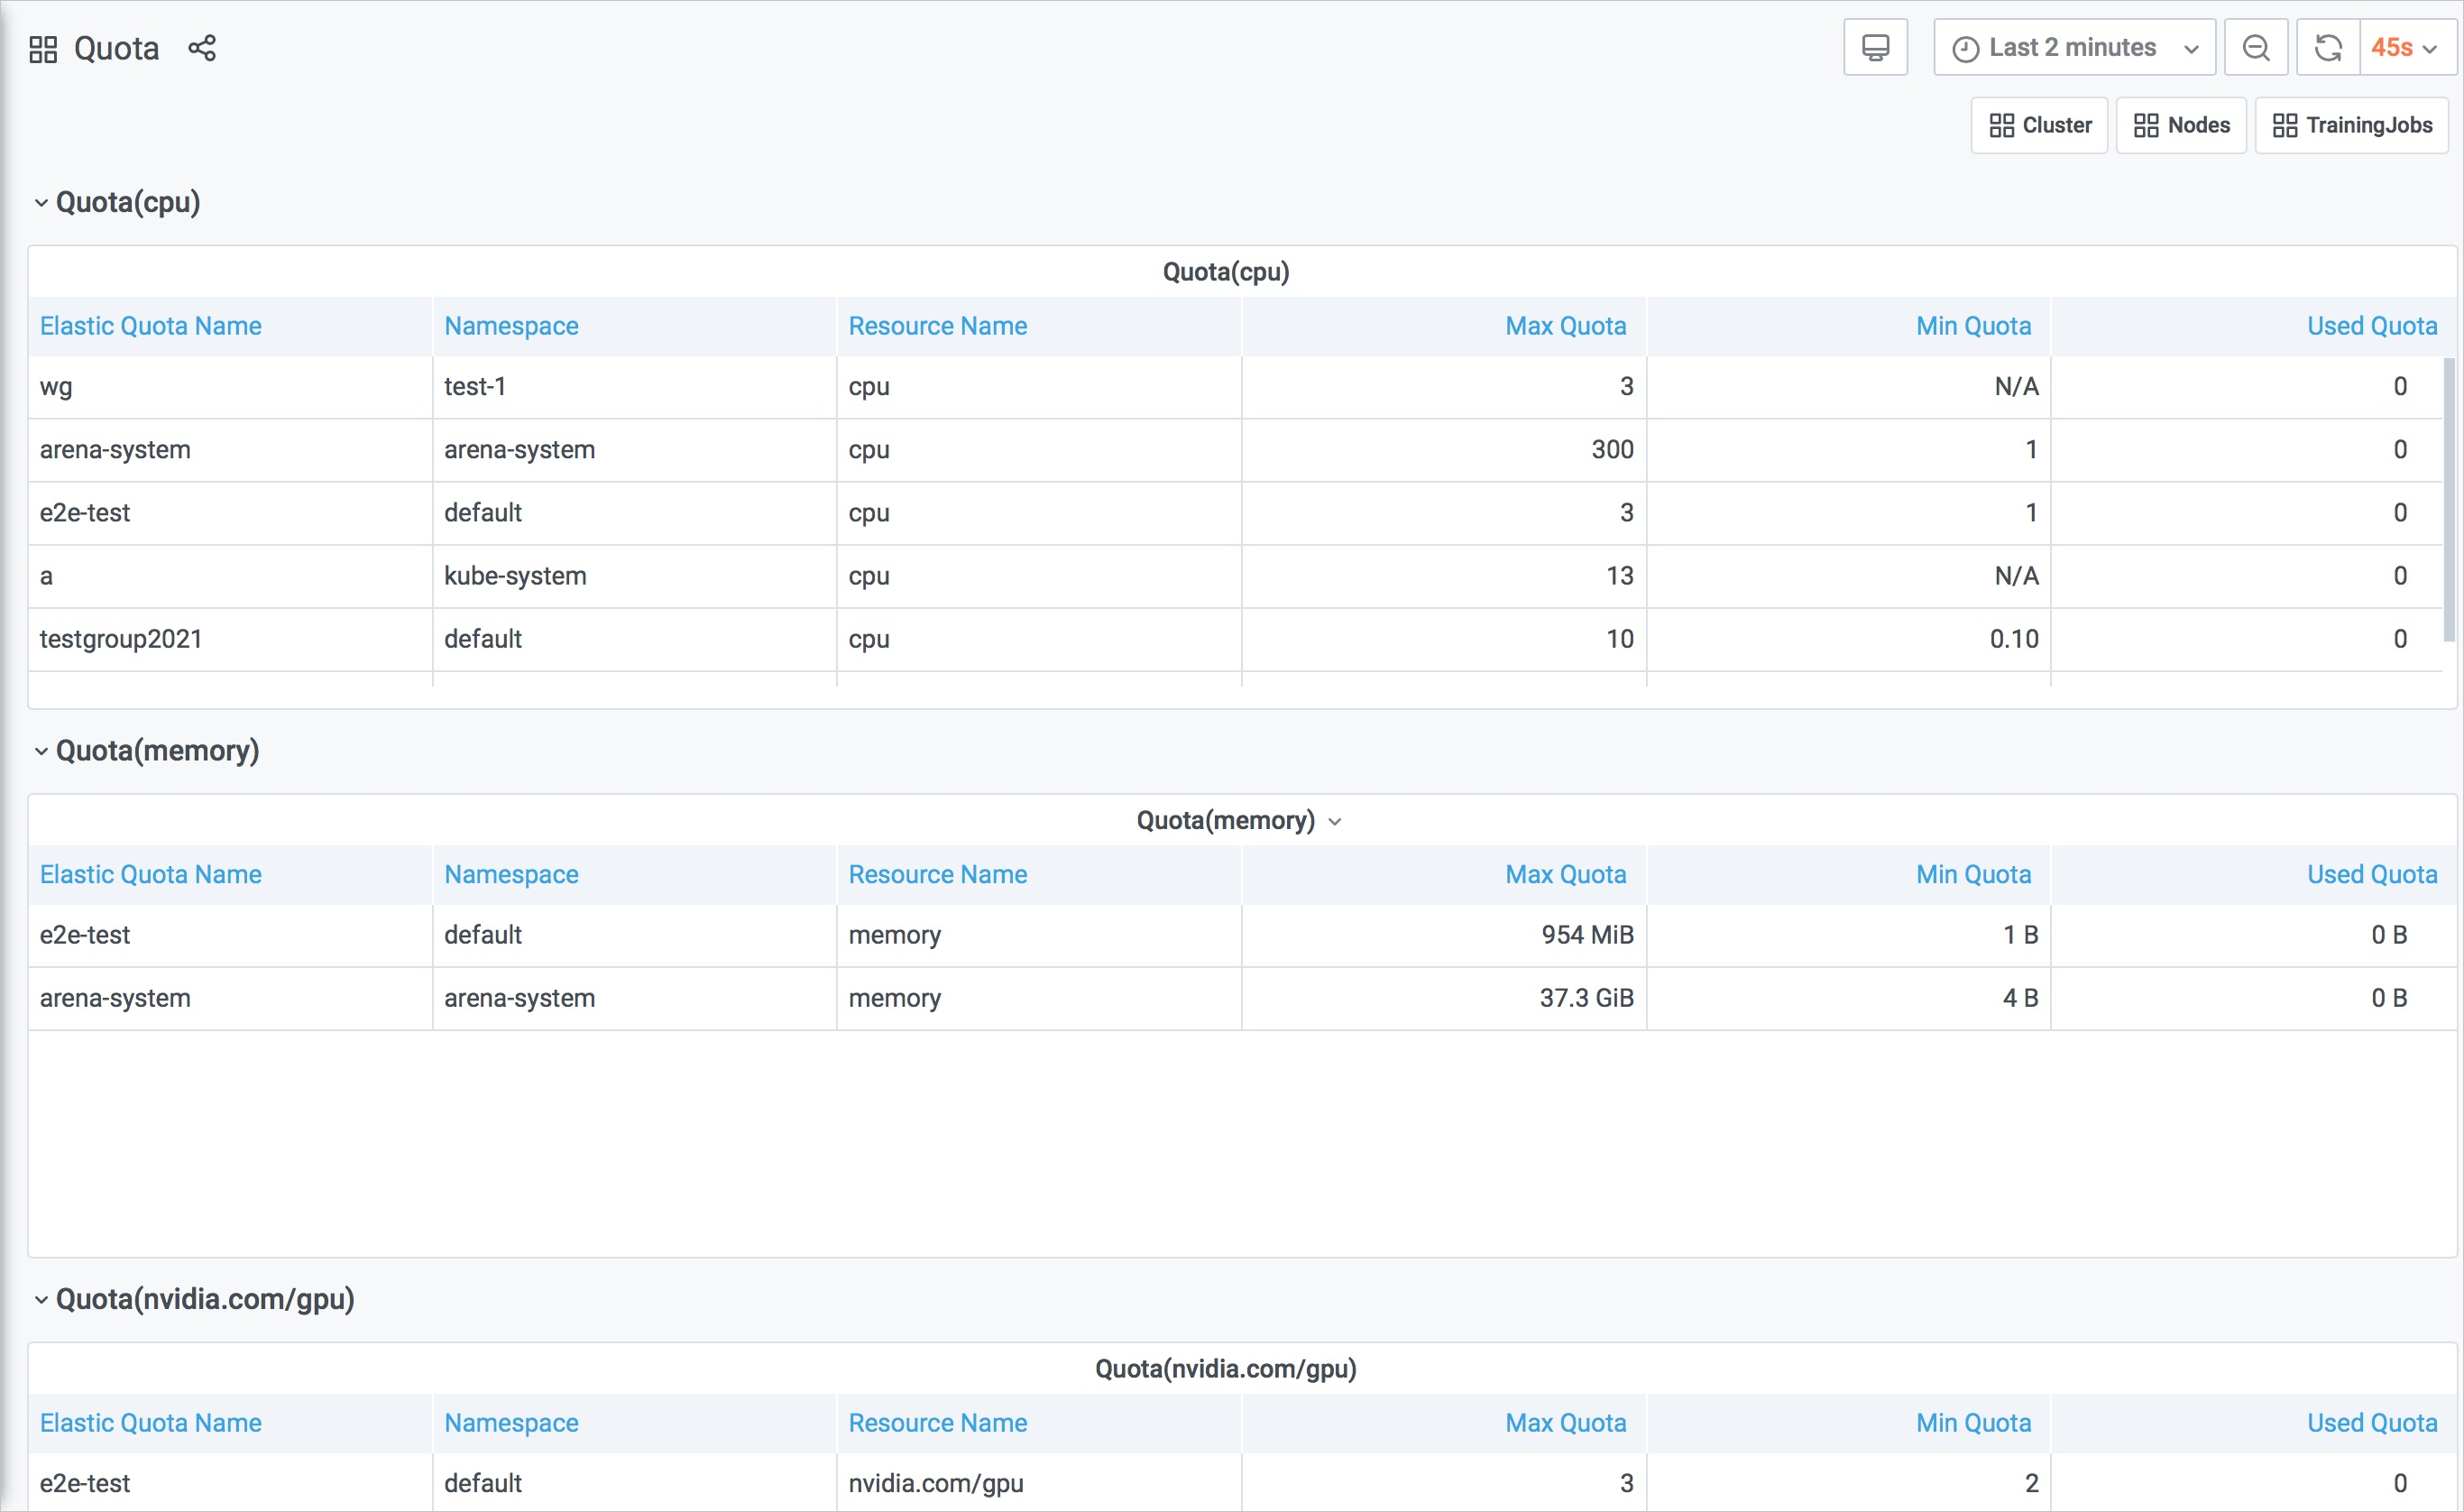
リソースクォータダッシュボードでは、次のメトリックを表示できます。
クォータ (cpu)
クォータ (メモリ)
Quot a(nvidia.com/gpu)
Quot a(aliyun.com/gpu-mem)
Quot a(aliyun.com/gpu)
上記のリストの各メトリックは、リソースクォータに関する情報をテーブルに表示します。 次の情報が表示されます。
Elastic Quota Name: クォータグループの名前を表示します。
名前空間: リソースが属する名前空間を表示します。
リソース名: リソースの種類を表示します。
Max Quota: 指定された名前空間で使用できるリソースの最大量を表示します。
最小クォータ: クラスターに十分なリソースがない場合に、指定された名前空間で使用できるリソースの最小量を表示します。
使用済みクォータ: 指定された名前空間で使用されているリソースの量を表示します。
AIダッシュボードを使用する方法の例
この例では、Arenaを使用してmpijobトレーニングジョブを送信します。 トレーニングジョブを送信した後、AIダッシュボードで変更を表示します。
AIダッシュボードにログインすると、デフォルトでクラスターダッシュボードにリダイレクトされます。
次の図は、クラスターにトレーニングジョブが送信されていない場合のクラスターダッシュボードの外観を示しています。
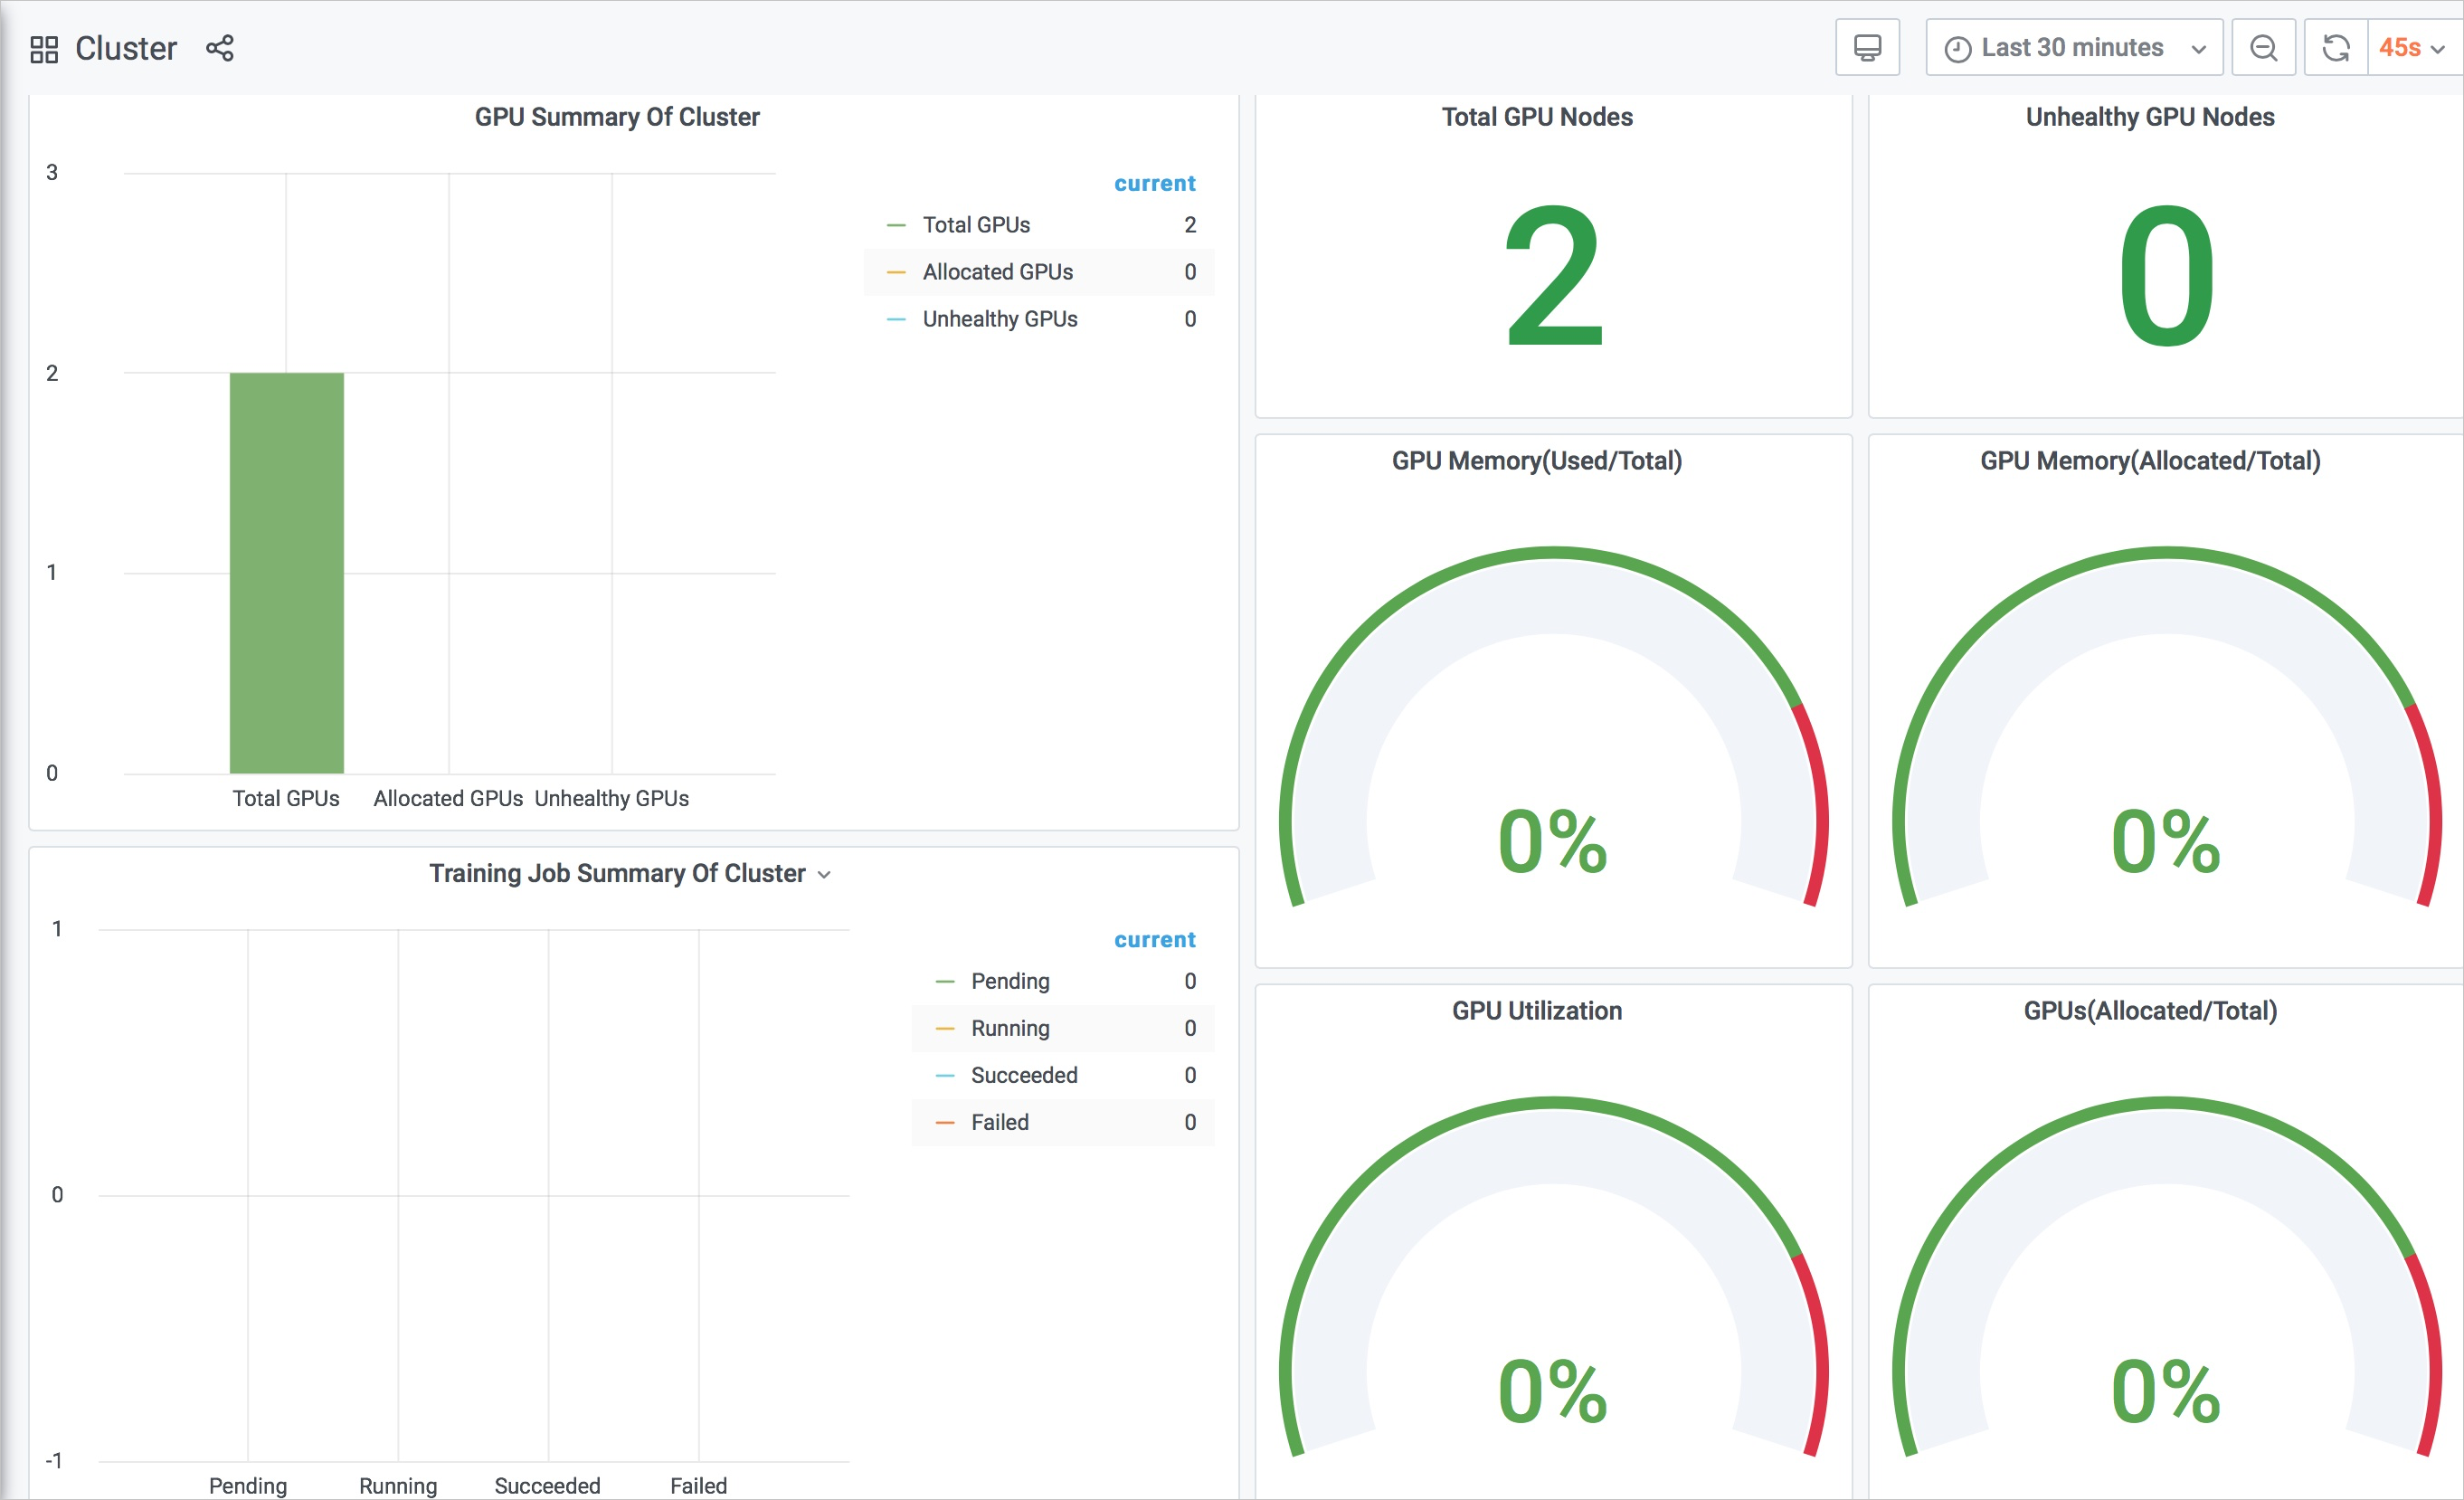
上の図は、クラスターに2つのGPUアクセラレーションノードと2つのGPUが含まれていることを示しています。
次のコマンドを実行して、
mpijobトレーニングジョブを送信します。アリーナはmpijob \を提出します -- name=mpi-test \ -- gpus=1 \ -- workers=1 \ -- working-dir=/perseus-demo/tensorflow-demo/ \ -- imag e=registry.cn-beijing.aliyuncs.com/ai-samples/horovod:0.13.11-tf1.10.0-torch0.4.0-py3.5 \ 'mpirun python /benchmarks/scripts /tf_cnn_benchmarks.py-model resnet101-batch_size 64-num_batches 5000-variable_update horovod-train_dir=/training_logs-summary_verbosity=3-save_summaries_steps=10 'クラスターダッシュボードを再度確認します。
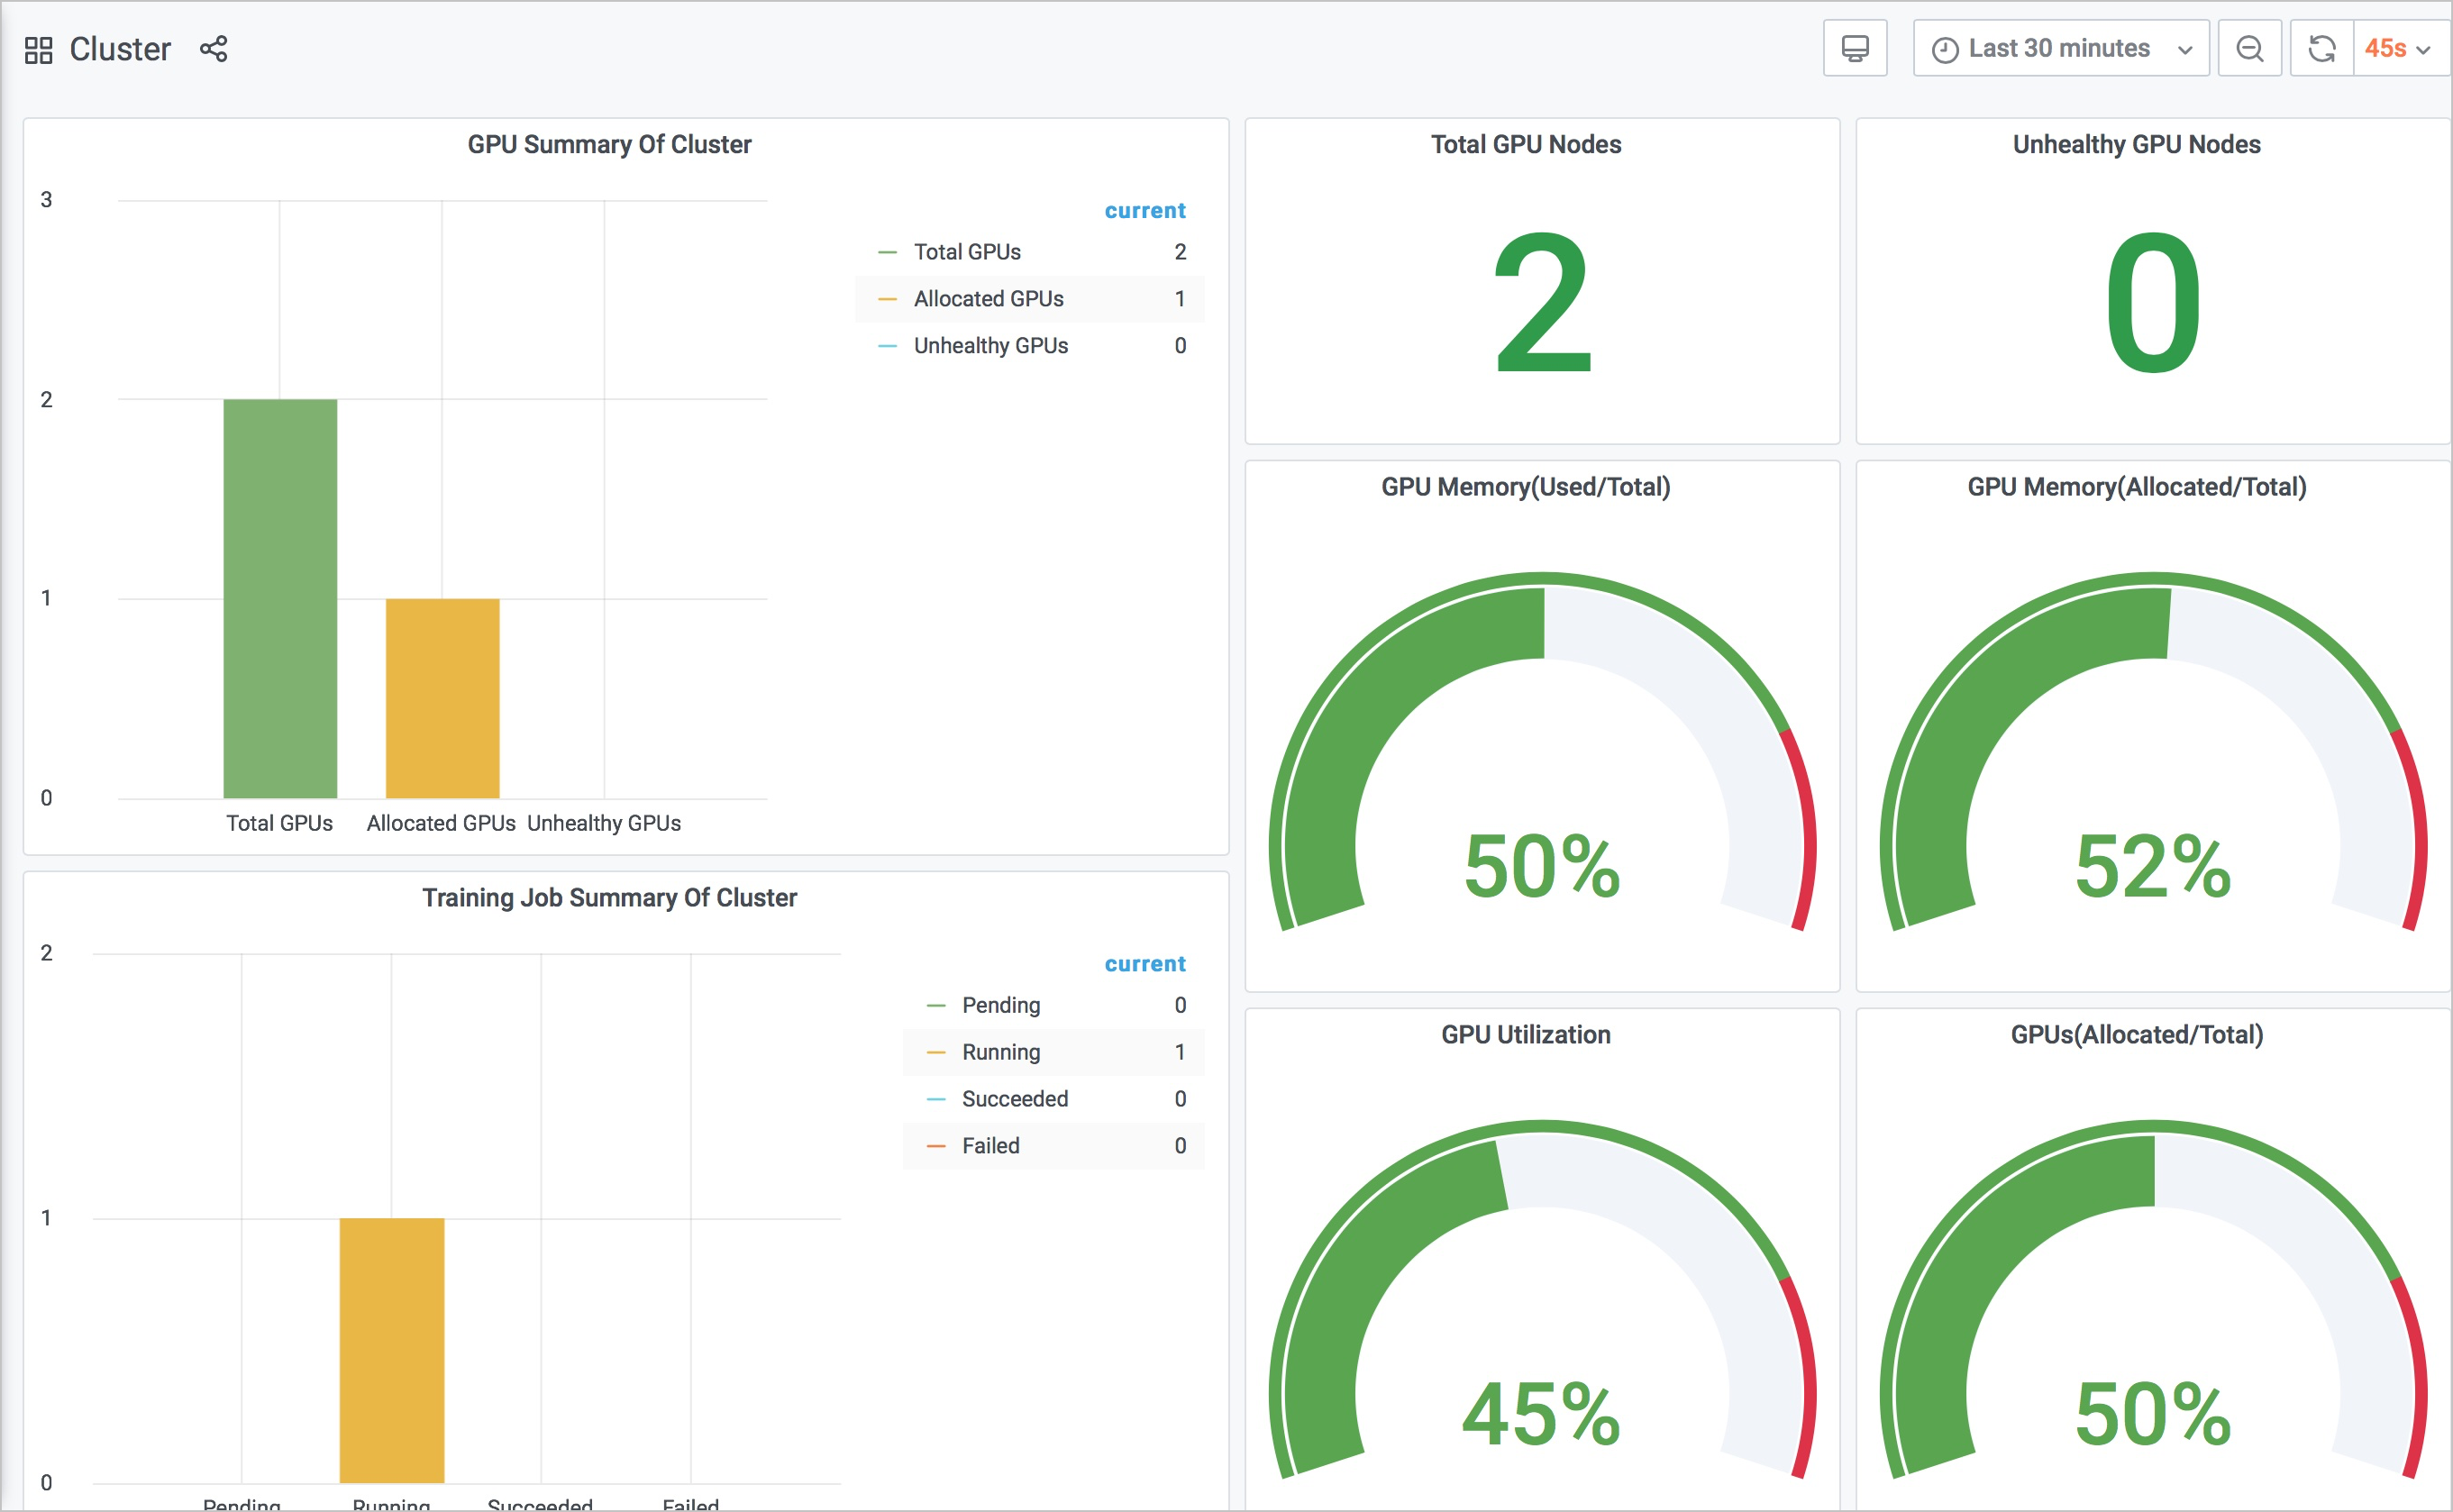
上の図は、GPU使用率やGPU (割り当て済み /合計) などのメトリックが更新されることを示しています。
次のコマンドを実行して、ジョブが実行されるノードを照会します。
アリーナ一覧期待される出力:
NAME STATUS TRAINER DURATION GPU (要求された) GPU (割り当てられた) ノード
mpi-test実行MPIJOB 8s 1 1 192.168.1.151
[クラスター] ページで、右上隅の [ノード] をクリックして、ノードダッシュボードに移動します。 ステップ4で返される出力は、ジョブが実行されるノードのIPアドレスが
192.168.1.151であることを示しています。 次の図に示すように、ノードのGPU関連のメトリックが更新されていることがわかります。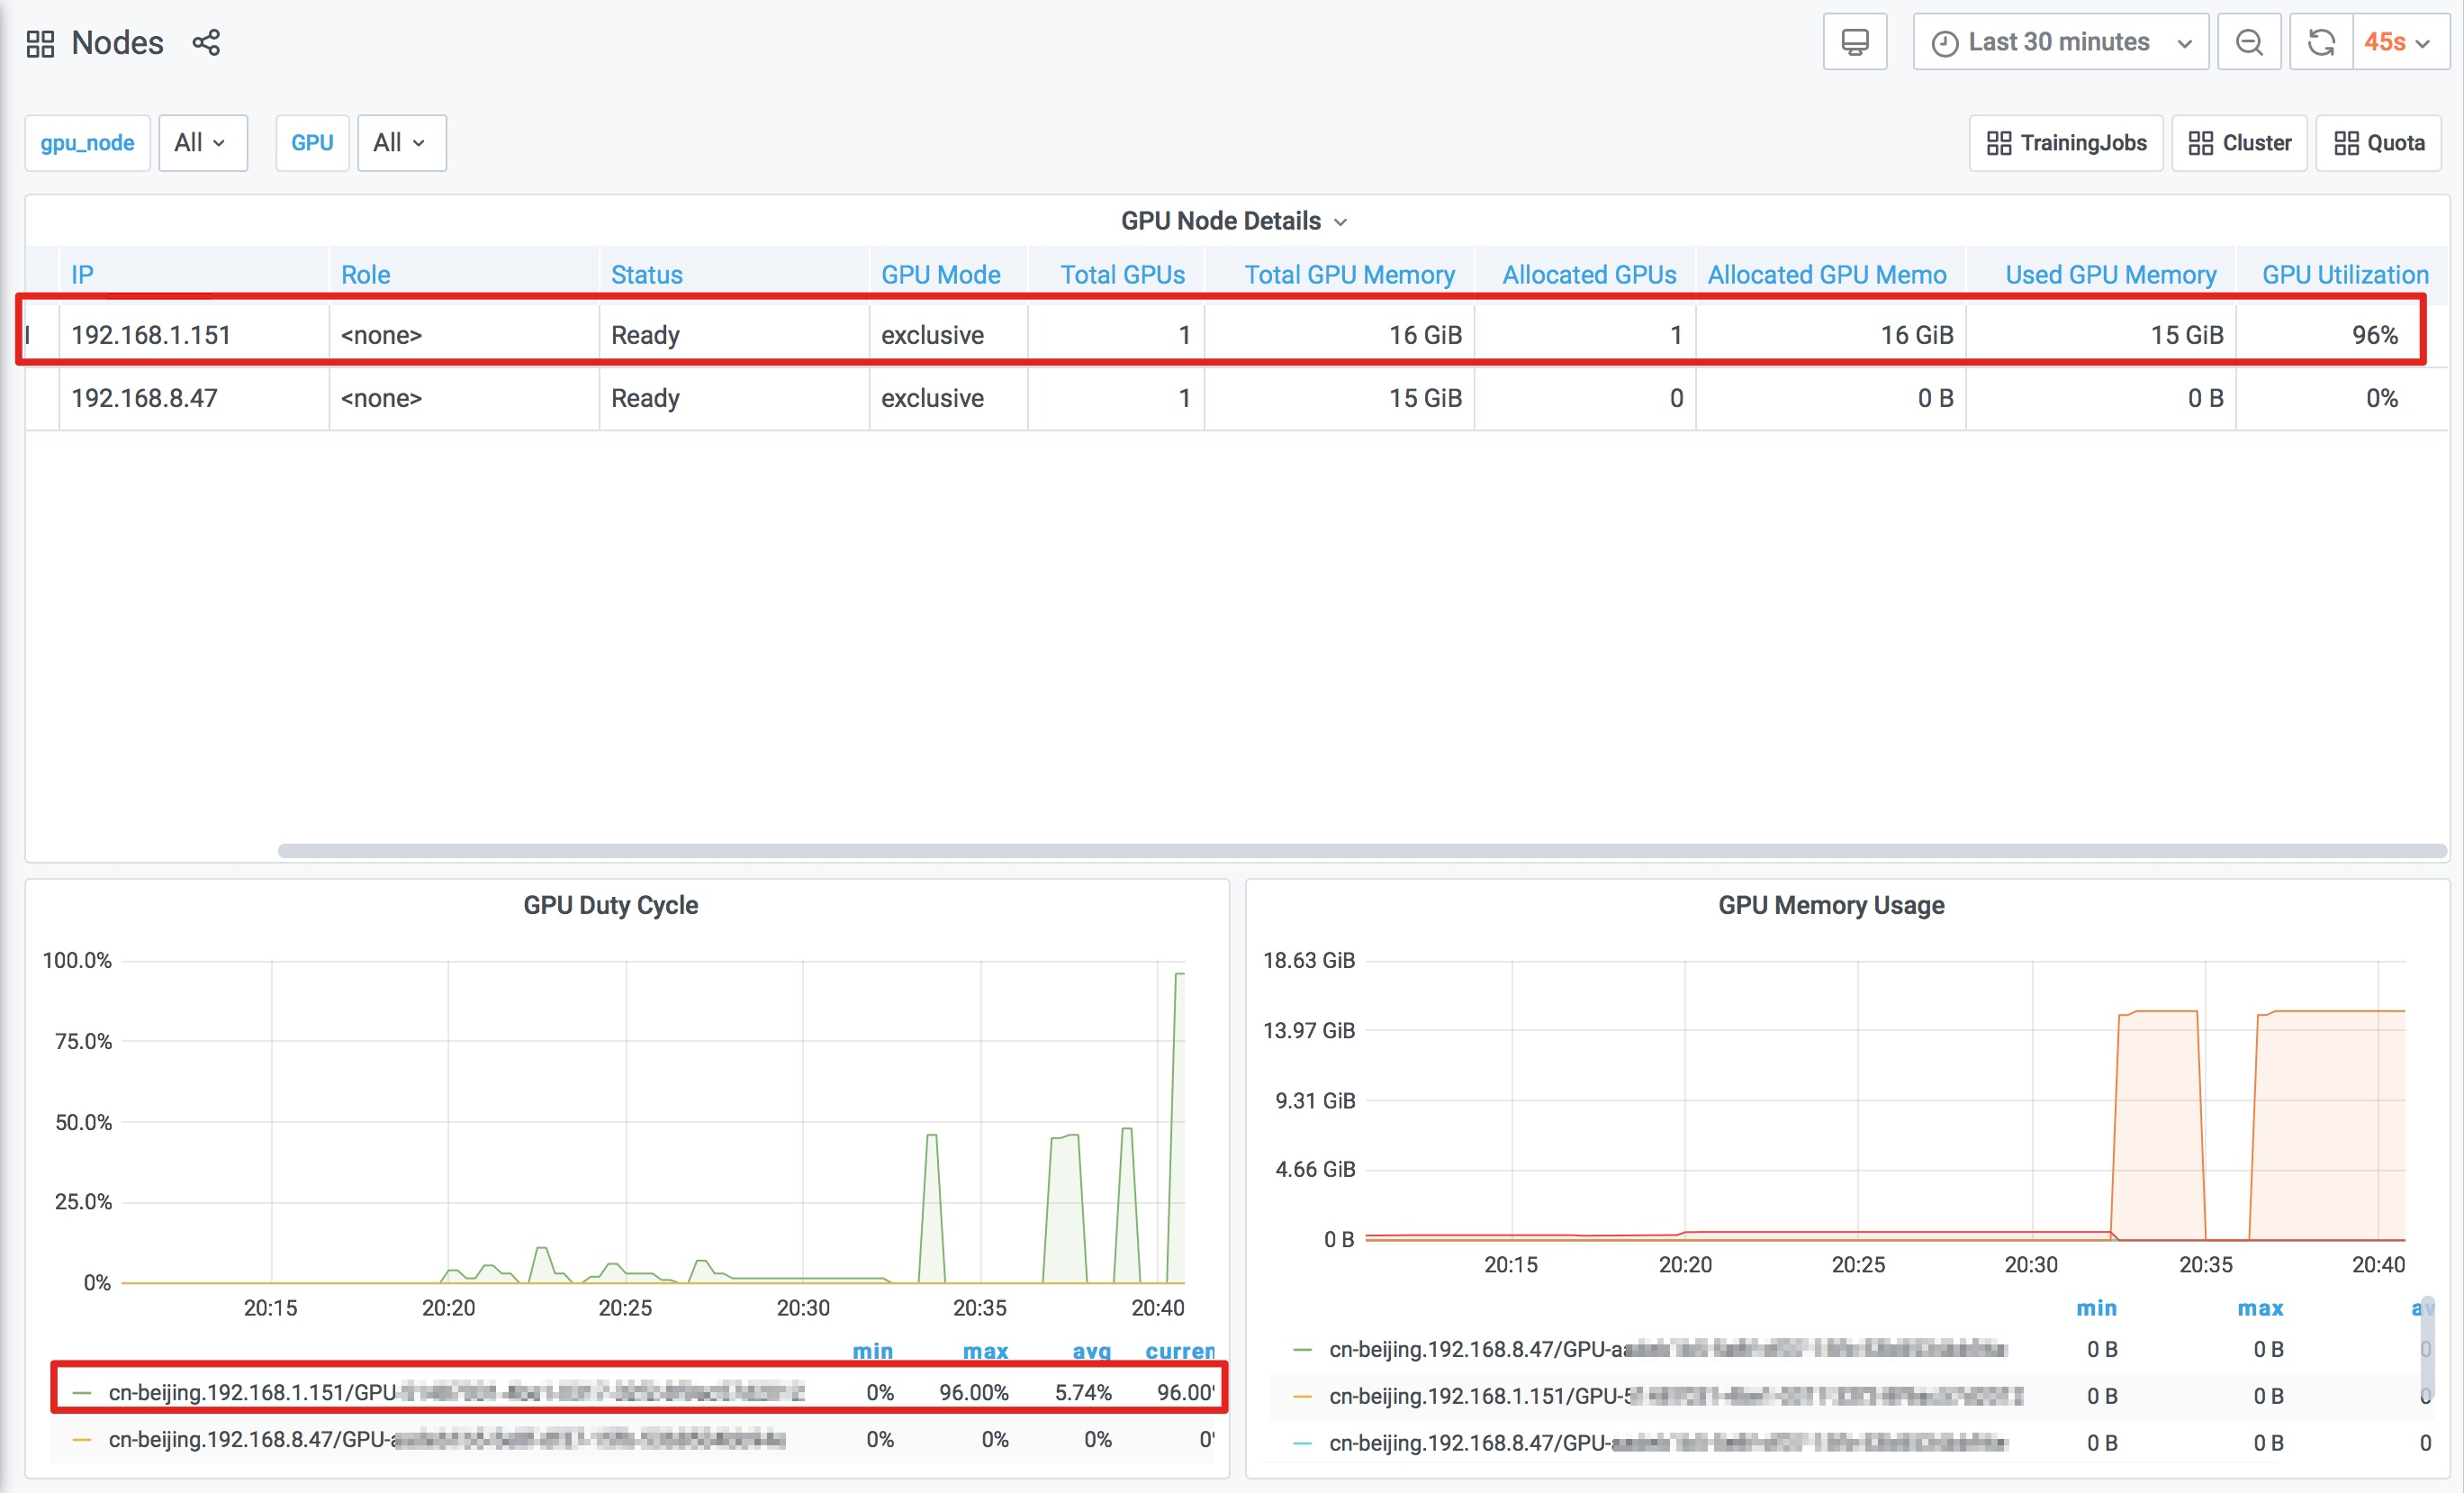
[ノード] ページで、右上隅の [トレーニングジョブ] をクリックして、トレーニングジョブダッシュボードに移動します。このダッシュボードでは、トレーニングジョブの名前やステータスなど、クラスター内のトレーニングジョブに関する情報を表示できます。
