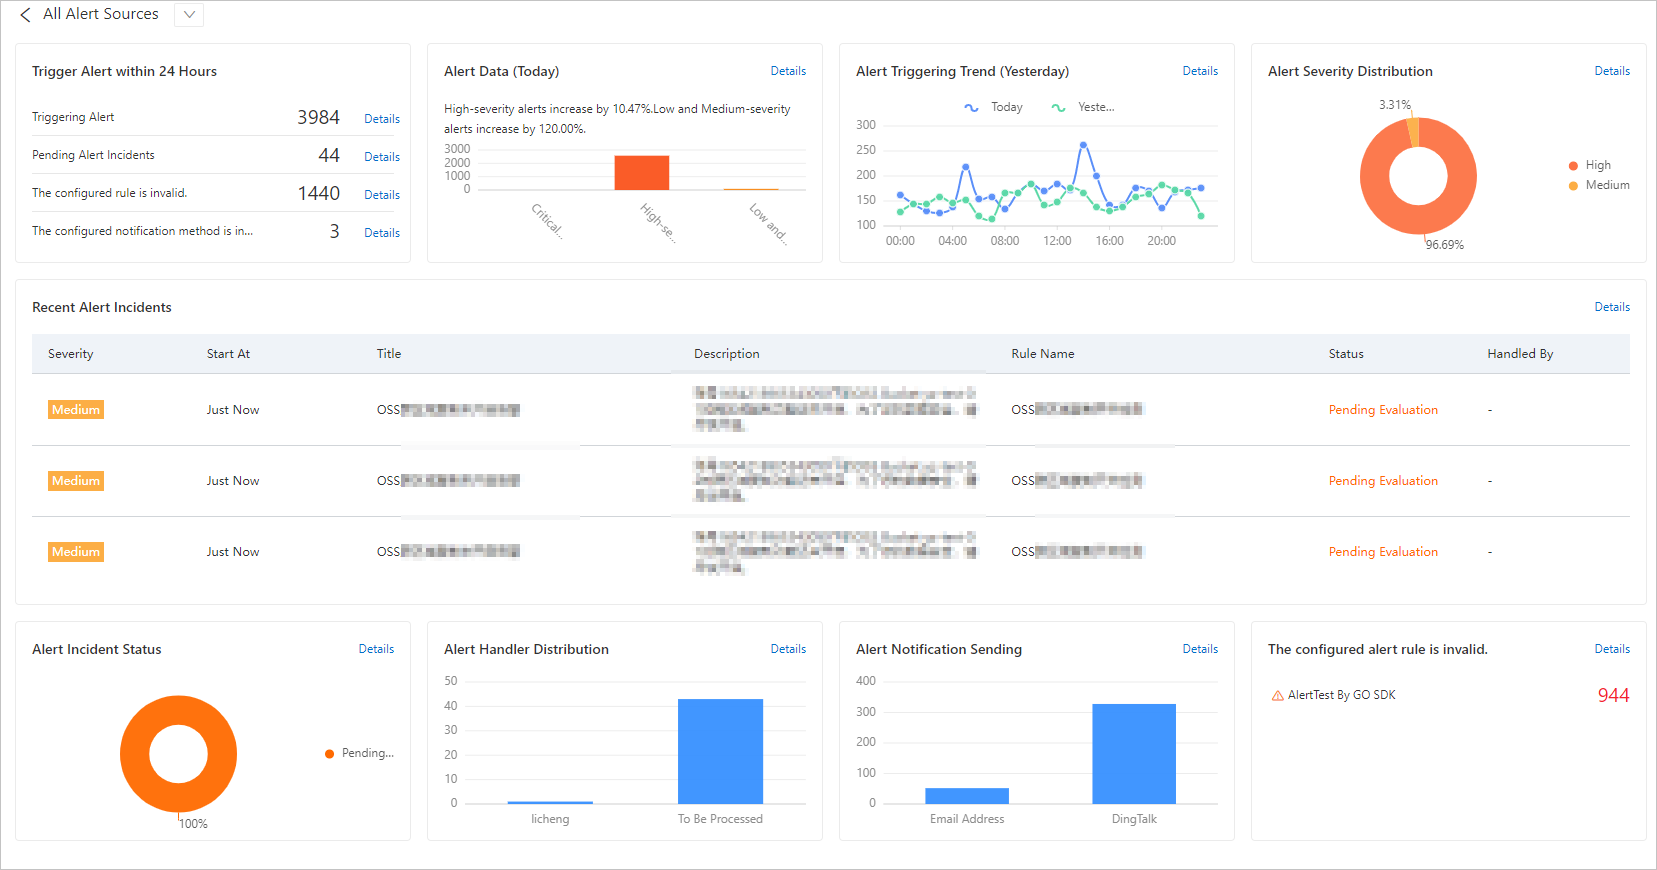
The Alert Status dashboard displays the status of an alert source, or the details of triggered alerts and the alert status in a business.
Prerequisites
Go to the dashboard page
Data details
On the Alert Status page, you can view the details of triggered alerts and the alert status within a specified period of time.
| Chart | Description |
|---|---|
| Trigger Alert within 24 Hours | Displays the number of alerts that are triggered within 24 hours in the specified alert source of the current business. |
| Alert Data (Today) | Displays the number of alerts and the distribution of alert severities for the current day in the specified alert source of the current business. |
| Alert Triggering Trend (Yesterday). | Displays the result of comparison between the amount of alert data of the current day and the amount of alert data of the previous day in the specified alert source of the current business. |
| Alert Severity Distribution | Displays the distribution of alert severities in the specified alert source of the current business. |
| Recent Alert Incidents | Displays the details of alert incidents in the specified alert source of the current business. |
| Alert Incident Status | Displays the distribution of incident status in the specified alert source of the current business. |
| Alert Handler Distribution | Displays the distribution of incident handlers in the specified alert source of the current business. |
| Alert Notification Sending | Displays the distribution of alert notification methods in the specified alert source of the current business. |
| The configured alert rule is invalid | Displays the configuration errors of related alert monitoring rules in the specified alert source of the current business. |
