This topic describes how to view the evaluation results of alert rules in the Simple Log Service console. Simple Log Service creates a Logstore to log the evaluation results of alert rules. Simple Log Service also creates a dashboard to visualize the evaluation results.
Background information
You can view the evaluation logs of alert rules in a Logstore.
After you create an alert rule in a project, Simple Log Service creates a Logstore named internal-alert-history. The Logstore stores the evaluation logs of the alert rules in the project. A log entry is generated and written to the Logstore each time Simple Log Service evaluates an alert rule in the project, regardless of whether an alert is triggered. For more information, see Fields in alert rule evaluation logs.
NoteYou are not charged for the internal-alert-history Logstore. The Logstore cannot be deleted or modified. A log entry in the Logstore is retained for seven days.
You can view the evaluation results of alert rules in a dashboard.
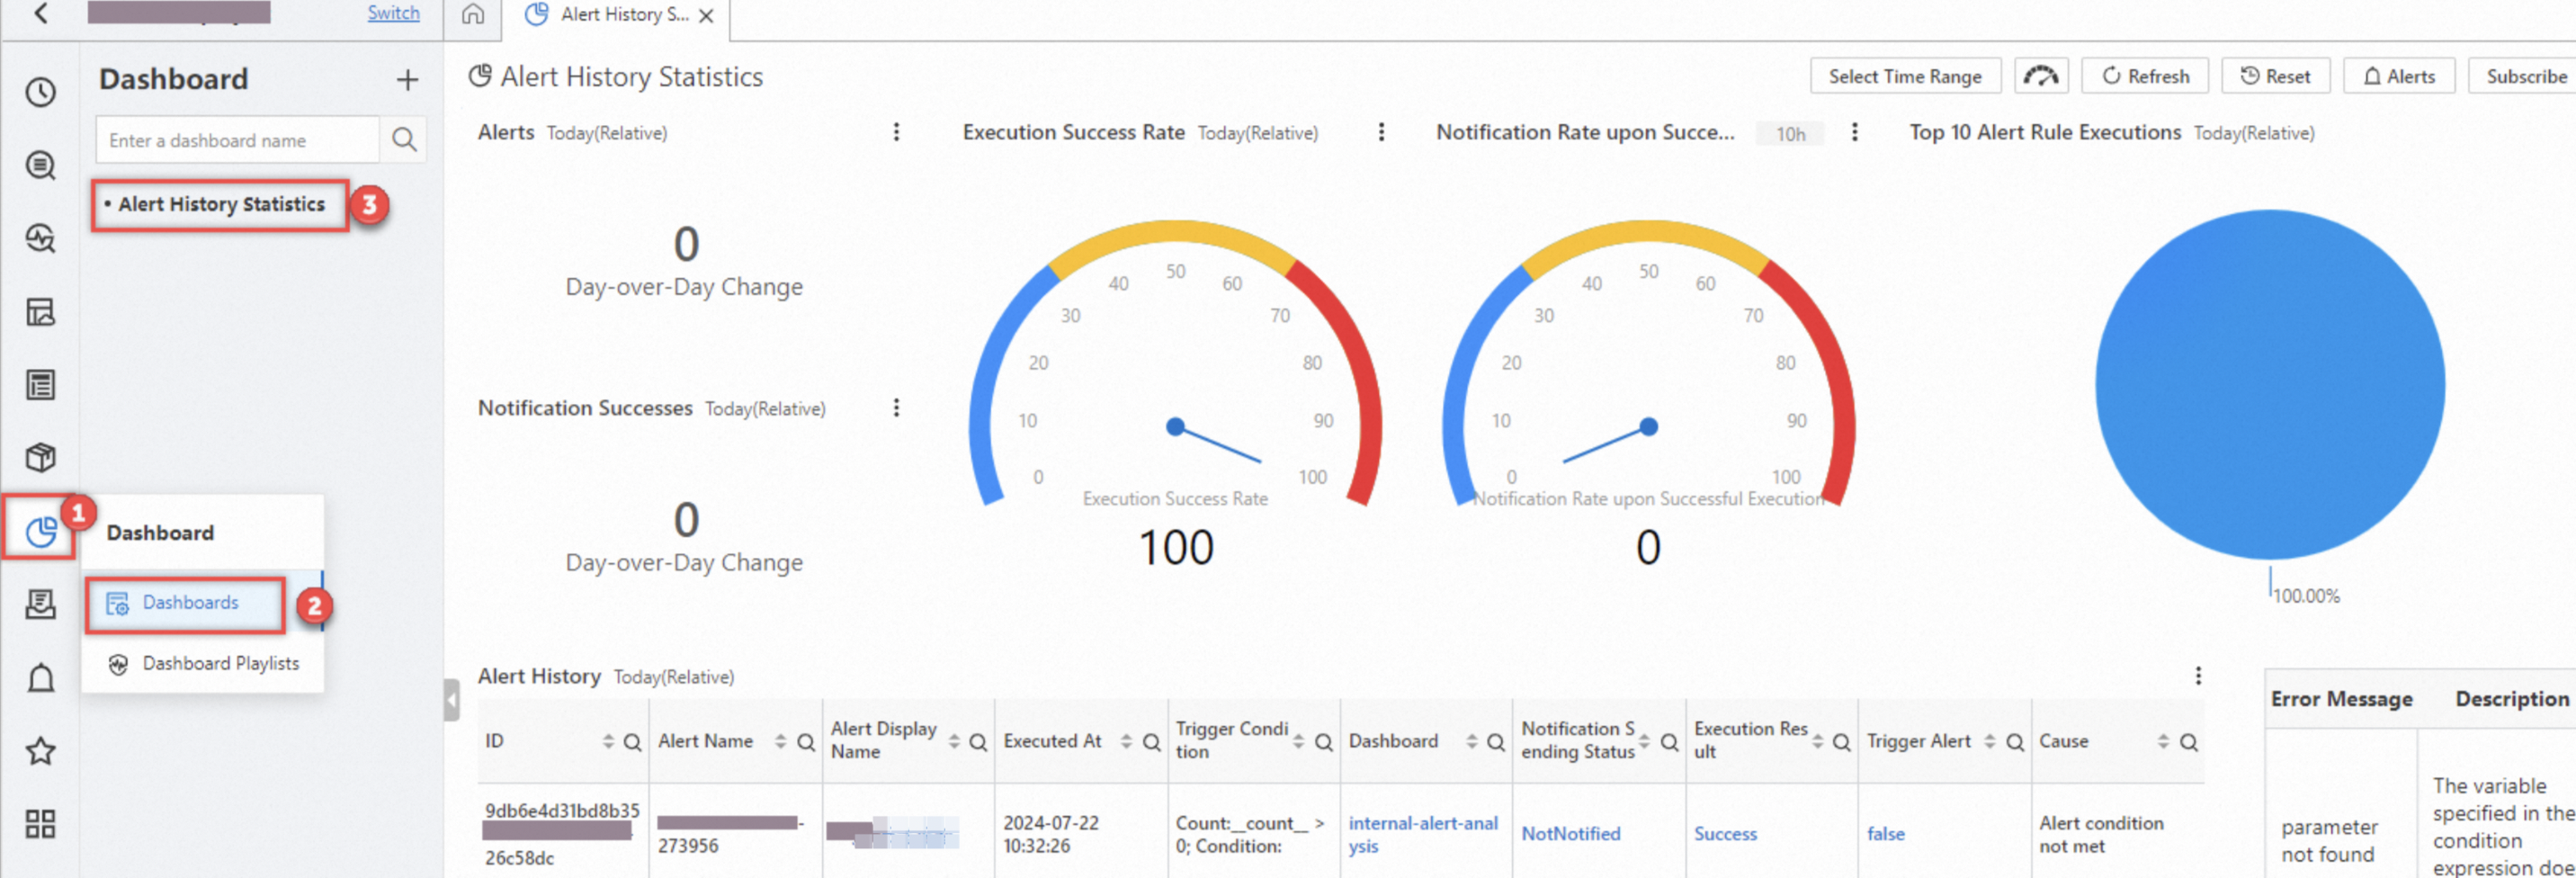
After you create an alert rule in a project, Simple Log Service creates a dashboard named Alert History Statistics. In the dashboard, the evaluation results of the alert rules in the project are displayed. The evaluation results include the number of triggered alerts, the percentage of evaluations in which the trigger condition is met, the percentage of evaluations for which alert notifications are sent to evaluations in which the trigger condition is met, and the top 10 alert rules that are sorted based on the number of evaluations.
NoteThe Alert History Statistics dashboard cannot be deleted or modified.
View the evaluation logs of alert rules in a Logstore
Log on to the Simple Log Service console.
In the Projects section, click the project that you want to manage.

On the tab, choose to the right of the internal-alert-history Logstore.
On the page that appears, view the logs of alert rules.

View the evaluation results of alert rules in a dashboard
Log on to the Simple Log Service console.
In the Projects section, click the project that you want to manage.

In the left-side navigation bar, click the
 icon.
icon.In the Dashboard pane, click the Alert History Statistics dashboard.
In the Alert History Statistics dashboard, view the evaluation results of alert rules.
The evaluation results in the Alert History Statistics dashboard include whether an alert is triggered, the reason why the alert is triggered, and the error information that is related to the alert.

 > Search & Analysis