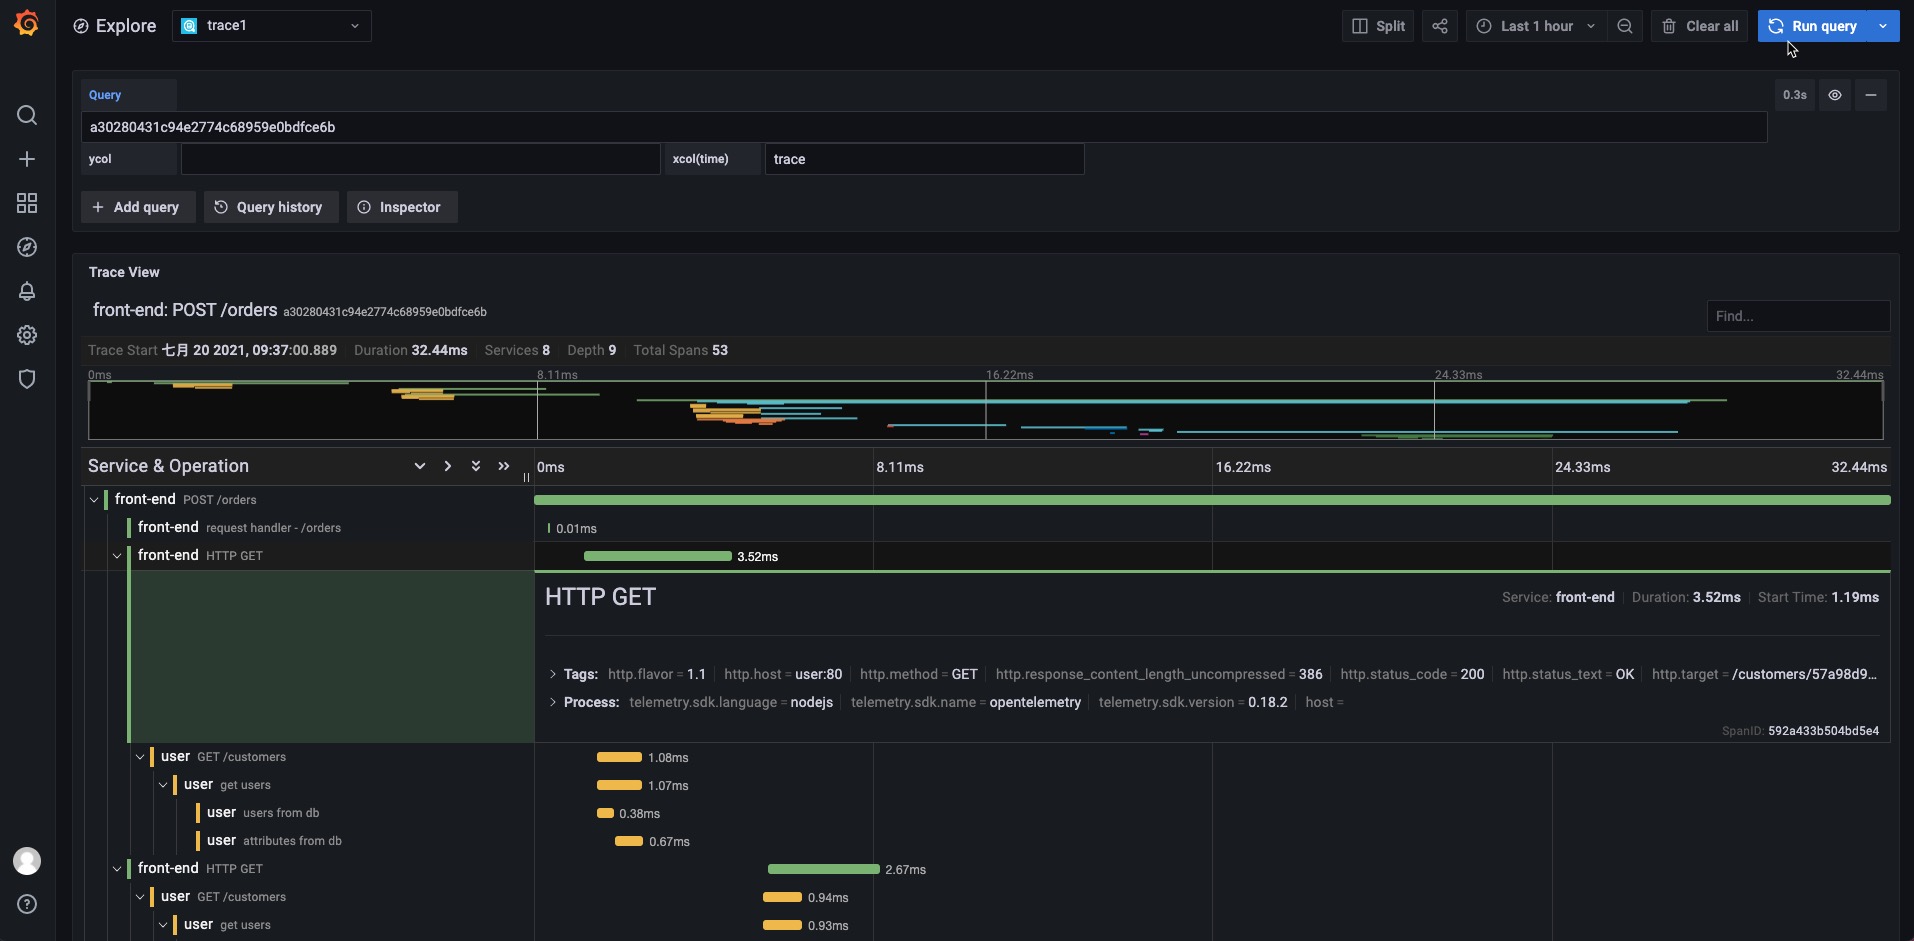
Grafana provides a comprehensive user interface (UI). This topic describes how to import trace data from Simple Log Service to Grafana for visualized analysis.
Prerequisites
Grafana 8.0.0 or a later version is installed. For more information, see Install Grafana.
NoteIn this topic, Grafana 8.0.6 that runs on a Linux operating system is used as an example.
Trace data is collected. For more information, see Overview.
The project package that contains the Simple Log Service plug-in is downloaded.
Step 1: Install the Simple Log Service plug-in
The following procedure describes how to install the Simple Log Service plug-in for Grafana:
Run the following commands to decompress the project package to the plug-in directory of Grafana.
If Grafana is installed by using a YUM repository or an RPM package, run the following command:
unzip aliyun-log-grafana-datasource-plugin-master.zip -d /var/lib/grafana/pluginsIf Grafana is installed by using a .tar.gz file, run the following command:
{PATH_TO} specifies the installation directory of Grafana.
unzip aliyun-log-grafana-datasource-plugin-master.zip -d {PATH_TO}/grafana-8.0.6/data/plugins
Modify the configuration file of Grafana.
Open the configuration file.
If Grafana is installed by using a YUM repository or an RPM package, open the /etc/grafana/grafana.ini file.
If Grafana is installed by using a .tar.gz file, open the {PATH_TO}/grafana-8.0.6/conf/defaults.ini file.
Find [plugins] in the configuration file to configure the allow_loading_unsigned_plugins parameter.
allow_loading_unsigned_plugins = aliyun-log-service-datasource
Restart the Grafana service.
Run the kill command to terminate the Grafana process.
Run the following commands to start the Grafana service:
If Grafana is installed by using a YUM repository or an RPM package, run the following command:
systemctl restart grafana-serverIf Grafana is installed by using a .tar.gz file, run the following command:
./bin/grafana-server web
Step 2: Add a data source for Grafana
The following procedure describes how to add the Simple Log Service plug-in as a data source for Grafana:
Log on to Grafana.
In the left-side navigation pane, choose .
On the Data Sources tab, click Add data source.
On the Add data source page, click Select in the LogService card.
Configure the data source.
The following table describes the parameters.
Parameter
Description
Name
The name of the data source.
Default
The Default switch. In this example, turn on the switch.
Endpoint
The endpoint of the Simple Log Service project. Example:
http://cn-qingdao.log.aliyuncs.com. Enter an endpoint based on your business requirements. For more information, see Endpoints.Project
The name of the project.
Logstore
The name of the Logstore.
AccessKeyId
The AccessKey ID provided by Alibaba Cloud. The AccessKey ID is used to identify the user. To ensure the security of your account, we recommend that you use the AccessKey pair of a RAM user. For more information about how to obtain an AccessKey pair, see AccessKey pair.
AccessKeySecret
The AccessKey secret provided by Alibaba Cloud. The AccessKey secret is used to authenticate the key of the user. To ensure the security of your account, we recommend that you use the AccessKey pair of a RAM user. For more information about how to obtain an AccessKey pair, see AccessKey pair.
Click Save & Test.
Step 3: View imported trace data
The following procedure describes how to view the trace data imported from Simple Log Service:
In the left-side navigation pane, choose .
In the upper-left corner of the Explore page, select the data source.
Enter trace in the xcol(time) field. Then, click Run query in the upper-right corner.

 > Data Sources