This topic describes how Alibaba Cloud Flink SQL implements row filtering and column pruning by using Simple Log Service Processing Language (SPL) statements.
Background
When you configure Simple Log Service as the source table in Realtime Compute for Apache Flink, data in the Logstores of Simple Log Service is automatically consumed to build a dynamic table. You can specify the start time for the data consumption. Data that is generated after the start time is consumed. Two issues may exist:
The Simple Log Service connector pulls excessive unnecessary data rows or columns, which cause network overheads.
The unnecessary data must be cleansed in Realtime Compute for Apache Flink, but data cleansing is not the focus of data analysis and consumes additional computational resources. Data cleansing involves data filtering and data projection.
SPL provides the Simple Log Service connector with the filter pushdown and projection pushdown capabilities. You can specify a query statement for the Simple Log Service connector to enable the pushdown of filter conditions or configure the query parameter for the Simple Log Service connector to enable the pushdown of projection fields. The settings prevent full data transmission or computing and improve data transmission and computing efficiency.
Solution
No SPL statement is specified: Realtime Compute for Apache Flink pulls full logs of Simple Log Service, including all rows and lines.

An SPL statement is specified: If row filtering or column pruning settings are included in an SPL statement, Realtime Compute for Apache Flink pulls only partial data that is obtained after row filtering or column pruning for subsequent computing.

Preparations
Simple Log Service is activated. A project and a Logstore are created. For more information, see Activate Simple Log Service and Create a project and a Logstore.
In this topic, simulated Layer 7 access logs of Server Load Balancer (SLB) are collected to the Logstore of Simple Log Service. The logs contain more than 10 fields. Random simulated logs are continuously generated. Sample log:
{
  "__source__": "127.0.0.1",
  "__tag__:__receive_time__": "1706531737",
  "__time__": "1706531727",
  "__topic__": "slb_layer7",
  "body_bytes_sent": "3577",
  "client_ip": "114.137.XXX.XXX",
  "host": "www.pi.mock.com",
  "http_host": "www.cwj.mock.com",
  "http_user_agent": "Mozilla/5.0 (Windows NT 6.2; rv:22.0) Gecko/20130405 Firefox/23.0",
  "request_length": "1662",
  "request_method": "GET",
  "request_time": "31",
  "request_uri": "/request/path-0/file-3",
  "scheme": "https",
  "slbid": "slb-02",
  "status": "200",
  "upstream_addr": "42.63.XXX.XXX",
  "upstream_response_time": "32",
  "upstream_status": "200",
  "vip_addr": "223.18.XX.XXX"
}
The slbid field in the Logstore has three types of values. The following statement is used to query the page views (PVs) for the values of the slbid field in the logs that are generated within 15 minutes. The results show that the PVs of the
slb-01value are equivalent to the PVs of theslb-02value.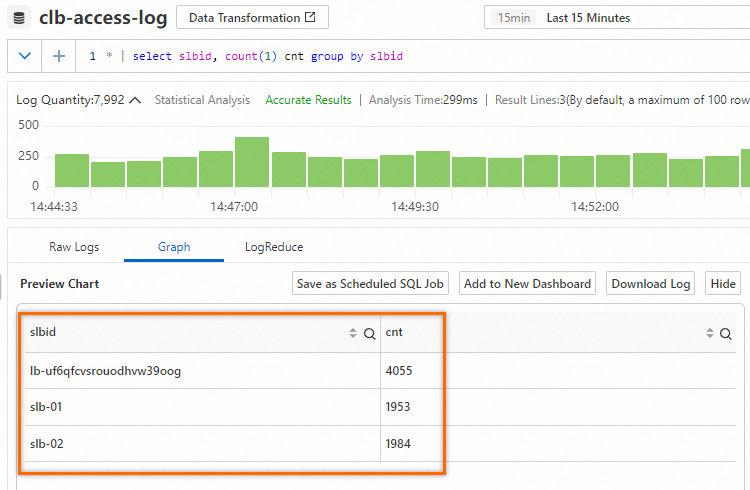
Procedure
Row filtering: SPL provides the Simple Log Service connector with the filter pushdown capability. You can specify a query statement for the Simple Log Service connector to enable the pushdown of filter conditions. This prevents full data transmission, and full data filtering and computing.
Column pruning: SPL provides the Simple Log Service connector with the projection pushdown capability. You can configure the query parameter for the Simple Log Service connector to enable the pushdown of projection fields. This prevents full data transmission, and full data filtering and computing.
Row filtering
Step 1: Create an SQL job
Log on to the Realtime Compute for Apache Flink console. Find the workspace that you want to manage and click Console in the Actions column.
In the left-side navigation pane, choose .
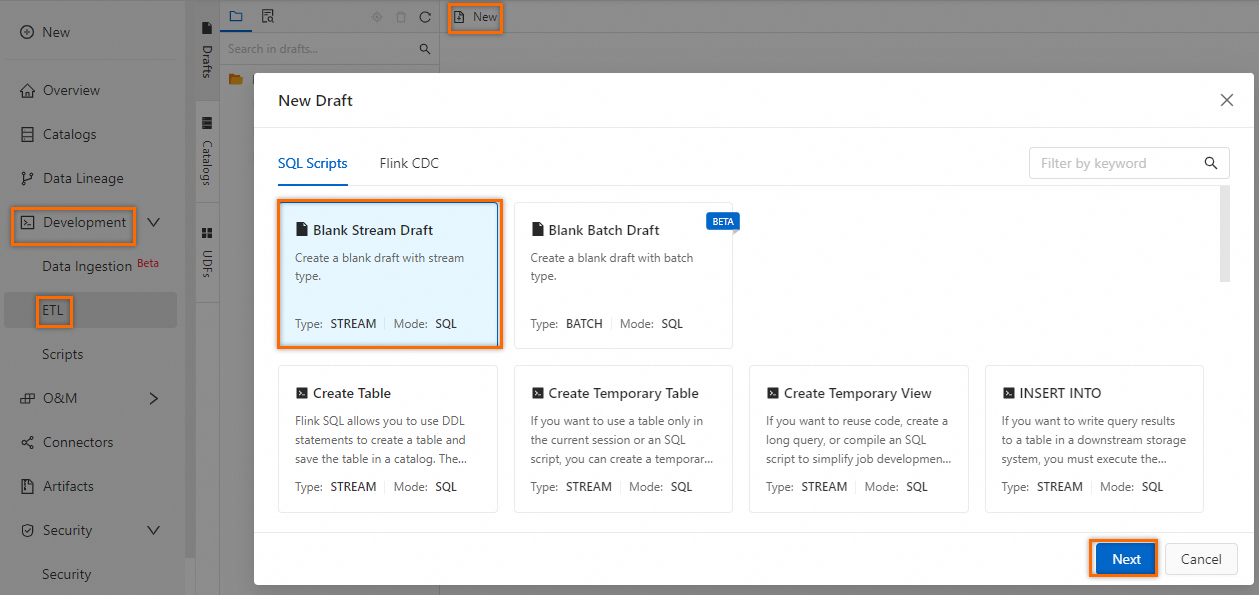
Click New. In the New Draft dialog box, choose and click Next.
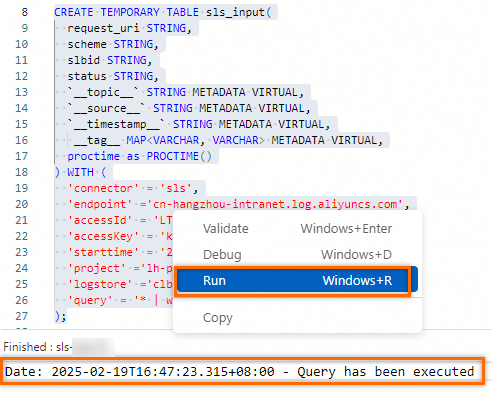
Copy the following SQL job settings used to create a temporary table to the SQL editor:
CREATE TEMPORARY TABLE sls_input(
  request_uri STRING,
  scheme STRING,
  slbid STRING,
  status STRING,
  `__topic__` STRING METADATA VIRTUAL,
  `__source__` STRING METADATA VIRTUAL,
  `__timestamp__` STRING METADATA VIRTUAL,
   __tag__ MAP<VARCHAR, VARCHAR> METADATA VIRTUAL,
  proctime as PROCTIME()
) WITH (
  'connector' = 'sls',
  'endpoint' ='cn-hangzhou-intranet.log.aliyuncs.com',
  'accessId' = 'yourAccessKeyID',
  'accessKey' = 'yourAccessKeySecret',
  'starttime' = '2025-02-19 00:00:00',
  'project' ='test-project',
  'logstore' ='clb-access-log',
  'query' = '* | where slbid = ''slb-01'''
);
The following table describes the parameters of the SQL job.
Parameter
Description
Example
connector
The Simple Log Service connector. For more information, see Supported connectors.
sls
endpoint
The internal Simple Log Service endpoint. For more information, see Endpoints.
cn-hangzhou-intranet.log.aliyuncs.com
accessId
The AccessKey ID. For more information, see Create an AccessKey pair.
LTAI****************
accessKey
The AccessKey secret. For more information, see Create an AccessKey pair.
yourAccessKeySecret
starttime
The point in time at which the query starts.
2025-02-19 00:00:00
project
The name of the Simple Log Service project.
test-project
logstore
The name of the Simple Log Service Logstore.
clb-access-log
query
The SPL statement. Note that in the development of an SQL job for Realtime Compute for Apache Flink, a string must be escaped by using single quotation marks ('').
* | where slbid = ''slb-01''
Select and right-click the SQL job settings. In the popover that appears, click Run to connect to Simple Log Service.
Step 2: Consecutive queries and results
Enter the following analytic statement in the SQL job and perform an aggregate query by slbid:
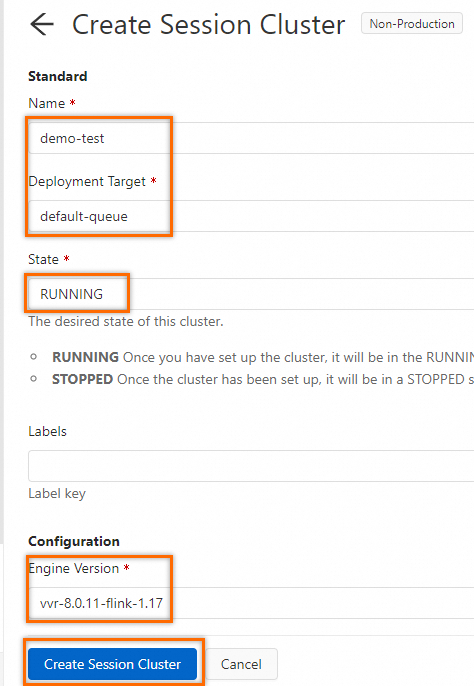
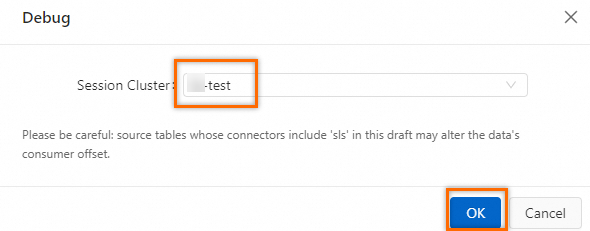
SELECT slbid, count(1) as slb_cnt FROM sls_input GROUP BY slbid;In the upper-right corner of the page, click the Debug icon. In the debug dialog box, select Create new session cluster from the Session Cluster drop-down list and configure the parameters based on the following figure.
In the debug drop-down list, select the created session cluster and click OK.
In the Results section, the value
slb-01is always displayed for the slbid field. The results show that after you specify an SPL statement, sls_input includes only data that matches slbid='slb-01'.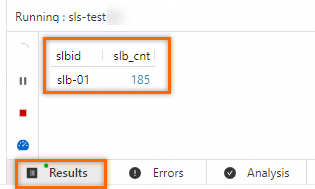
Column pruning
Step 1: Create an SQL job
Log on to the Realtime Compute for Apache Flink console. Find the workspace that you want to manage and click Console in the Actions column.
In the left-side navigation pane, choose .
Click New. In the New Draft dialog box, choose and click Next.
Copy the following SQL job settings used to create a temporary table to the SQL editor: Different from row filtering, a projection statement is added to the query parameter based on row filtering settings. Vertical bars (
|) are used to split instructions. The output of the previous instruction is used as the input of the next instruction. The output of the last instruction indicates the output of the entire pipeline. This way, only the content of specific fields is pulled from your Simple Log Service server.CREATE TEMPORARY TABLE sls_input_project( request_uri STRING, scheme STRING, slbid STRING, status STRING, `__topic__` STRING METADATA VIRTUAL, `__source__` STRING METADATA VIRTUAL, `__timestamp__` STRING METADATA VIRTUAL, __tag__ MAP<VARCHAR, VARCHAR> METADATA VIRTUAL, proctime as PROCTIME() ) WITH ( 'connector' = 'sls', 'endpoint' ='cn-hangzhou-intranet.log.aliyuncs.com', 'accessId' = 'yourAccessKeyID', 'accessKey' = 'yourAccessKeySecret', 'starttime' = '2025-02-19 00:00:00', 'project' ='test-project', 'logstore' ='clb-access-log', 'query' = '* | where slbid = ''slb-01'' | project request_uri, scheme, slbid, status, __topic__, __source__, "__tag__:__receive_time__"' );The following table describes the parameters of the SQL job.
Parameter
Description
Example
connector
The Simple Log Service connector. For more information, see Supported connectors.
sls
endpoint
The internal Simple Log Service endpoint. For more information, see Endpoints.
cn-hangzhou-intranet.log.aliyuncs.com
accessId
The AccessKey ID. For more information, see Create an AccessKey pair.
LTAI****************
accessKey
The AccessKey secret. For more information, see Create an AccessKey pair.
yourAccessKeySecret
starttime
The point in time at which the query starts.
2025-02-19 00:00:00
project
The name of the Simple Log Service project.
test-project
logstore
The name of the Simple Log Service Logstore.
clb-access-log
query
The SPL statement. Note that in the development of an SQL job for Realtime Compute for Apache Flink, a string must be escaped by using single quotation marks ('').
* | where slbid = ''slb-01''
Select and right-click the SQL job settings. In the popover that appears, click Run to connect to Simple Log Service.
Step 2: Consecutive queries and results
Enter the following analytic statement in the SQL job and perform an aggregate query by slbid:
SELECT slbid, count(1) as slb_cnt FROM sls_input_project GROUP BY slbid;In the upper-right corner of the page, click the Debug icon. In the debug dialog box, select Create new session cluster from the Session Cluster drop-down list and configure the parameters based on the following figure.
In the debug drop-down list, select the created session cluster and click OK.
The Results section displays the results, similar to those of the SQL job in which row filtering is performed.
NoteNote: The job in which row filtering is performed returns full fields. However, the Simple Log Service connector returns only specific fields based on the current SPL statement, further reducing the network transmission of data.