A donut chart is a variant of a pie chart and has a hollow center. A donut chart is similar to a pie chart in shape but displays more information, such as total numbers. This topic describes how to configure a donut chart.
Prerequisites
Data is collected. For more information, see Collect text logs from servers.
Indexes are created. For more information, see Create indexes.
A dashboard is created. For more information, see Create a dashboard.
Configuration effect

Query and analyze data: You can query and analyze the collected logs in the Simple Log Service console. For example, you can retrieve logs, aggregate logs, and collect statistics on logs.
Configure a donut chart: Set the Pie Chart Type parameter to Donut Chart in the Pie Chart Configurations section, configure the chart, and then add the chart to a dashboard.
Step 1: Query and analyze data
Log on to the Simple Log Service console. In the Projects section, click the project you want.
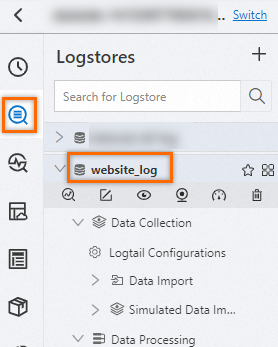
In the left-side navigation pane, click Log Storage. In the Logstores list, click the Logstore that you want to manage.

On the page that appears, enter the following query statement in the search box to query the page views (PVs) of different browsers and click Search & Analyze to view the logs.
* | select count(1) as pv, case when http_user_agent like '%Chrome%' then 'Chrome' when http_user_agent like '%Firefox%' then 'Firefox' when http_user_agent like '%Safari%' then 'Safari' else 'unKnown' end as http_user_agent group by case when http_user_agent like '%Chrome%' then 'Chrome' when http_user_agent like '%Firefox%' then 'Firefox' when http_user_agent like '%Safari%' then 'Safari' else 'unKnown' end order by pv desc limit 10
Step 2: Configure a donut chart
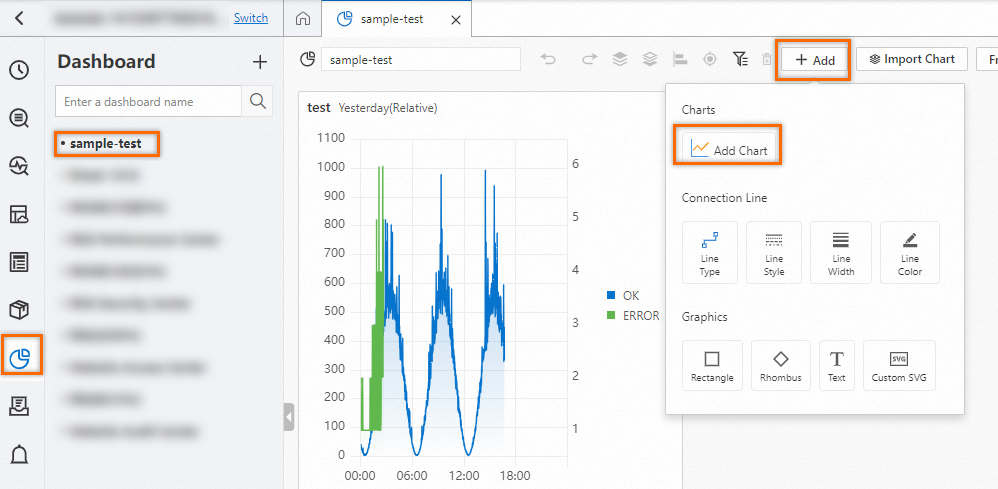
In the left-side navigation pane, choose . In the Dashboard list, click the dashboard that you want to manage. In the upper-right corner of the dashboard page, click Edit. In edit mode, choose .

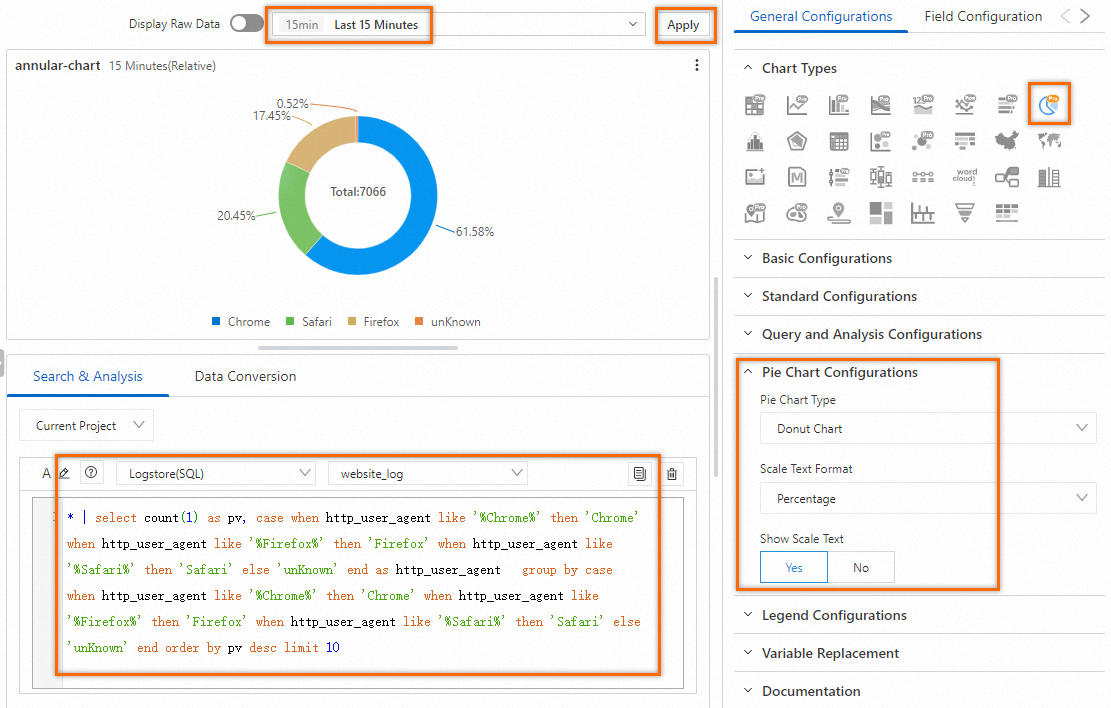
On the right side of the Edit Chart page, choose based on the following figure. On the left side of the Edit Chart page, configure the query time range, Logstore, and query statement for the donut chart. After you complete the configuration, click Apply in the upper part of the Edit Chart page to view the configuration effects of the donut chart.
: Select Donut Chart from the drop-down list.
: Select Percentage to display the scale text in the percentage format. Example: 1.98%.
: Select Yes to display the scale text of each slice in the donut chart.
