Alert OpsCenter is a business-centric alert management and O&M platform. You can add alerts that are generated by third-party monitoring platforms, such as Zabbix and Prometheus, and alerts that are generated by Simple Log Service resources to a business. This way, you can use the business to manage alerts and send alert notifications in a unified manner and improve the O&M efficiency. This topic describes the architecture and features of Alert OpsCenter.
Architecture
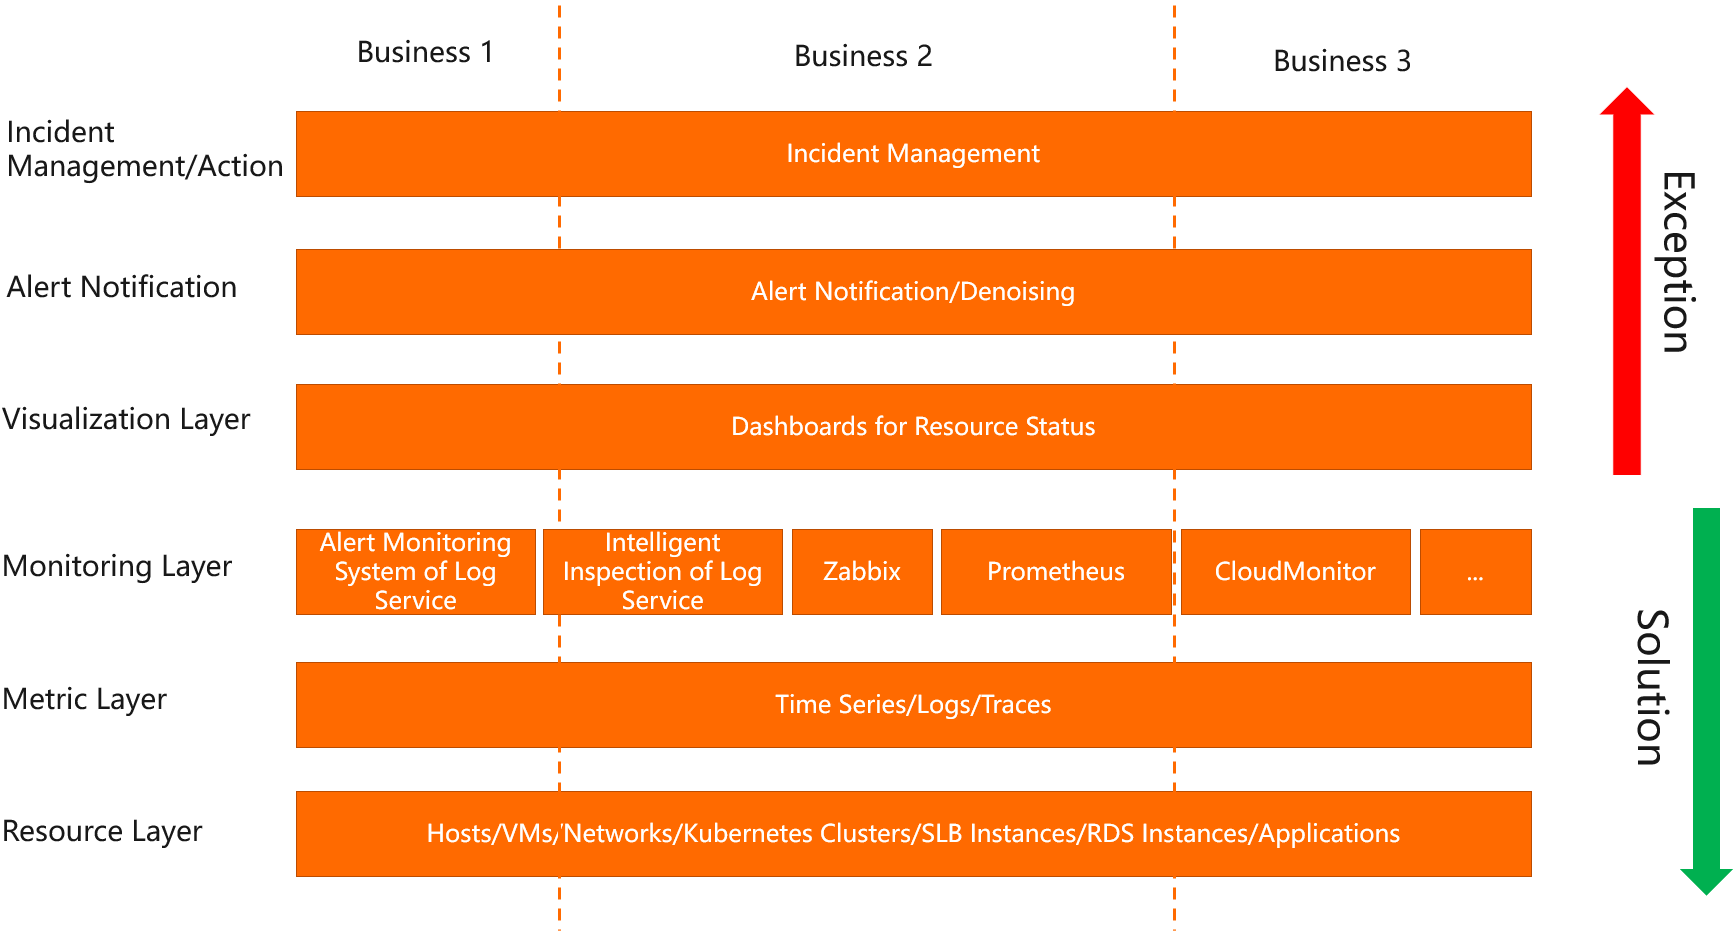
Simple Log Service Alert OpsCenter allows you to manage alerts by business. Each business includes a complete pipeline that starts from the resource layer and ends at incident management.

Resource layer: includes computing, storage, and network resources, such as hosts, virtual machines, Server Load Balancer (SLB) resources, Java applications, and Go applications.
Metric layer: includes time series data, log data, and trace data. Metrics can show the health status of each resource.
Monitoring layer: allows you to create alert monitoring rules to monitor metrics by using monitoring tools such as Zabbix, Prometheus, the alert monitoring system of Simple Log Service, and the intelligent inspection feature of Simple Log Service. For example, you can monitor high CPU utilization and transient, sharp increases in network traffic.
Visualization layer: provides visualized reports to display the alert status for different resources, such as the trends in the number of triggered alerts, the handling status of alerts, and the status of alert notifications.
Alert notifications: If an alert is triggered, Simple Log Service sends alert notifications based on a specified action policy. Simple Log Service can send alert notifications to specified users by using SMS messages, voice calls, DingTalk, custom webhooks, EventBridge, and Function Compute. Before Simple Log Service sends alert notifications, you can use alert policies to denoise alerts.
Incident management: After alerts are sent to the alert management system, the alerts are merged into different sets based on a route consolidation policy. An incident is automatically created for each set. O&M engineers can manage different alert incidents. For example, you can change the status of an incident to resolved, confirmed, or ignored. You can also specify incident handlers.
Features
Alert OpsCenter provides the following features:
Alert source integration: An alert source is the source of alerts in a business. Alert sources include Log Business resources and third-party alert sources. You can use the following methods to integrate alert sources:
Vertical alert sources
You can integrate alert sources based on your technical deployment. For example, if you use resources from the access layer, computing layer, and storage layer, you can add the resources to a business for unified management.
Horizontal alert sources
You can integrate alert sources based on your O&M requirements. For example, if your database O&M team wants to manage all RDS instances, you can add the data of the RDS instances to a business for unified management.
Third-party alert sources
If an enterprise has one or more monitoring platforms, such as Zabbix and Prometheus, the enterprise can add the alert data that is generated by the monitoring platforms to a business for unified management.
Business policies: Alert OpsCenter allows you to configure business policies to merge, suppress, or silence alerts. Business policies support the following three configuration modes: Enable, Disable, and Mixed.
Enable
In Enable mode, the alert policy and the action policy that are configured for the current business are applied. If an alert source in the business is associated with an available alert policy and an available action policy in Alert Center, the policies that are associated with the alert source are disabled.
Disable
In Disable mode, the alert policy and the action policy that are configured for the current business are not applied. If an alert source in the business is associated with an available alert policy and an available action policy in Alert Center, the policies that are associated with the alert source are enabled.
Mixed
If an alert source in the business is associated with an available alert policy and an available action policy in Alert Center, the policies that are associated with the alert source and the policies that are configured for the business are all enabled.
Incident management: You can change the status of an incident to confirmed, ignored, or resolved. You can also specify incident handlers.
Alert Status dashboard: Alert OpsCenter provides the Alert Status dashboard that displays the status of an alert source, or the details of triggered alerts and alert status in a business.
Troubleshooting dashboards: Alert OpsCenter provides troubleshooting dashboards that include the following dashboards: Global Alert Pipeline Center, Global Alert Rule Center, Global Alert Troubleshooting Center, and Pub Alert Center. The preceding dashboards display information about alerts.