Zabbix is a common open source monitoring system. Zabbix provides a variety of alert rules for system monitoring and supports different alert notification channels. You can add a notification channel in Zabbix so that Zabbix can send alerts to the alerting system of Log Service. Then, the alerting system processes the alerts, such as denoising the alerts and sending alert notifications.
Prerequisites
- An alert ingestion application is created. For more information, see Configure webhook URLs for alert ingestion.
- alibaba_cloud_sls.yml is downloaded.
Configure Zabbix
Alert parsing
A Zabbix alert contains more than 100 variables. For more information, see Zabbix documentation. Log Service retains only dozens of the variables. The following table describes the variables retained by Log Service.
| Zabbix macro | Example value |
|---|---|
| {TRIGGER.ID} | 19006 |
| {TRIGGER.NAME} | test used |
| {EVENT.UPDATE.STATUS} | 0 |
| {EVENT.VALUE} | 1 |
| {DATE} | 2021.06.10 |
| {TIME} | 12:44:23 |
| {EVENT.DATE} | 2021.06.10 |
| {EVENT.TIME} | 19:23:01 |
| {EVENT.RECOVERY.DATE} | "" |
| {EVENT.RECOVERY.TIME} | "" |
| {HOST.NAME} | zabbix-agent |
| {HOST.IP} | 192.0.2.0 |
| {TRIGGER.HOSTGROUP.NAME} | Linux servers |
| {EVENT.DURATION} | 20h 1m 31s |
| {TRIGGER.DESCRIPTION} | The system is running out of free memory. |
| {EVENT.OPDATA} | 73.22 % |
| {EVENT.TAGS} | Application:Memory |
| {NSEVERITY} | 2 |
| {EVENT.ID} | 1036 |
Field mapping
The following table describes the mappings between Log Service fields and Zabbix fields.
| Log Service | Zabbix | Description |
|---|---|---|
| aliuid | None | The ID of the Alibaba Cloud account to which the alert ingestion application belongs. |
| alert_id | {TRIGGER.ID} | The ID of the alert monitoring rule. |
| alert_type | None | The alert type. The value is fixed as sls_pub. |
| alert_name | {TRIGGER.NAME} | The name of the alert monitoring rule. |
| status | {EVENT.UPDATE.STATUS} and {EVENT.VALUE} | The alert status.
If the values of {EVENT.UPDATE.STATUS} and {EVENT.VALUE} in the Zabbix alert are both 0, the status is resolved, which indicates that the alert is cleared. If the values are not 0, the status is firing, which indicates that the alert is triggered. |
| next_eval_interval | None | The interval at which the alert is evaluated. The value is fixed as 0. |
| alert_time | None | The time at which the evaluation is performed.
The time is obtained by using {DATE} and {TIME}. |
| fire_time | None | The time at which the alert is first triggered.
The time is obtained by using {EVENT.DATE} and {EVENT.TIME}. |
| resolve_time | None | The time at which the alert is cleared.
|
| labels | {HOST.NAME} | The labels of the alert.
If you add a label on the Enrichment tab when you create the alert ingestion application, the label is added to the labels field.
Note If the key of the label specified on the Enrichment tab is the same as a field in the tags field of the Zabbix alert, the label on the Enrichment tab prevails.
|
| annotations | {EVENT.TAGS} | After the Zabbix alert is ingested into Log Service, Log Service expands the {EVENT.TAGS} field into multiple key-value pairs and adds the pairs to the annotations field.
In addition to the preceding fields, the following fields are added:
If you add an annotation on the Enrichment tab when you create the alert ingestion application, the annotation is added to the annotations field. |
| severity | {NSEVERITY} | The alert severity. For more information, see Table 2. |
| policy | None | The alert policy that is specified for the alert ingestion application. For more information, see Data structure of the policy variable. |
| project | None | The project to which Alert Center belongs. For more information, see Project. |
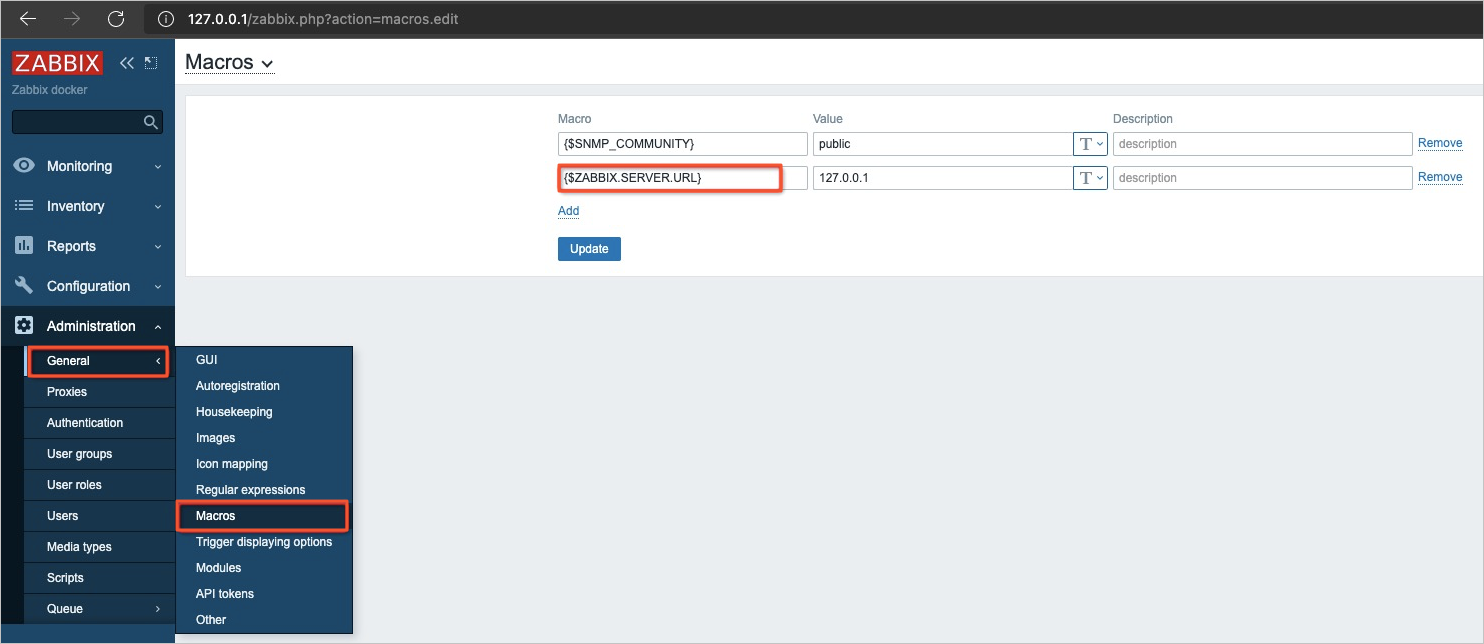
| drill_down_query | {$ZABBIX.SERVER.URL}, {TRIGGER.ID}, and {EVENT.ID} | The link to the alert management page of the Zabbix console. You can click the link to go to the page. |
| Severity in Zabbix | Severity in Log Service |
|---|---|
| Not Classified | report |
| Information | low |
| Warning | medium |
| Average | medium |
| High | high |
| Disaster | critical |
FAQ
How do I view operation logs?


