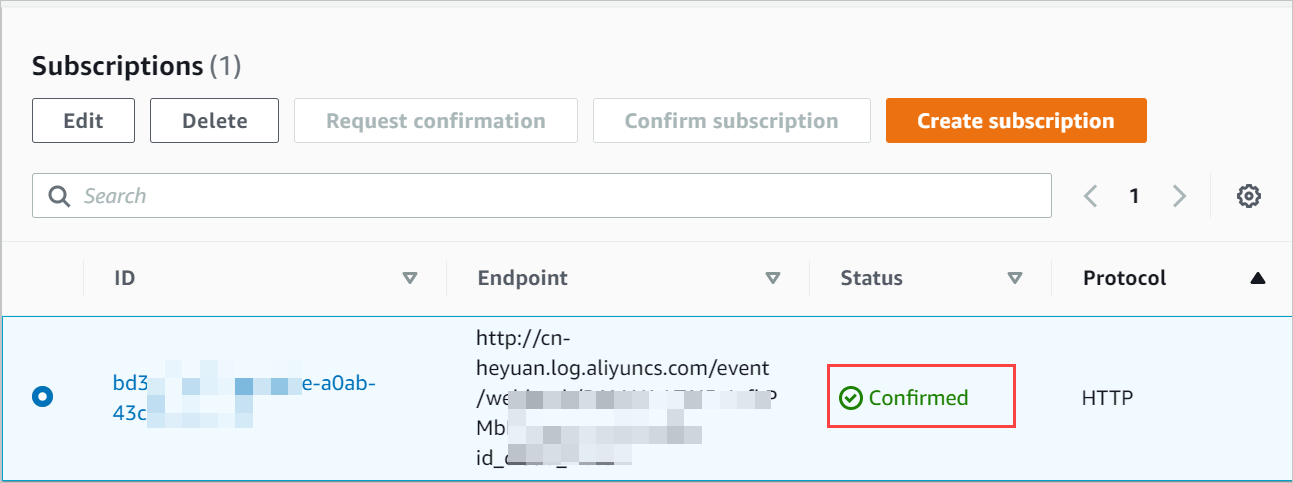
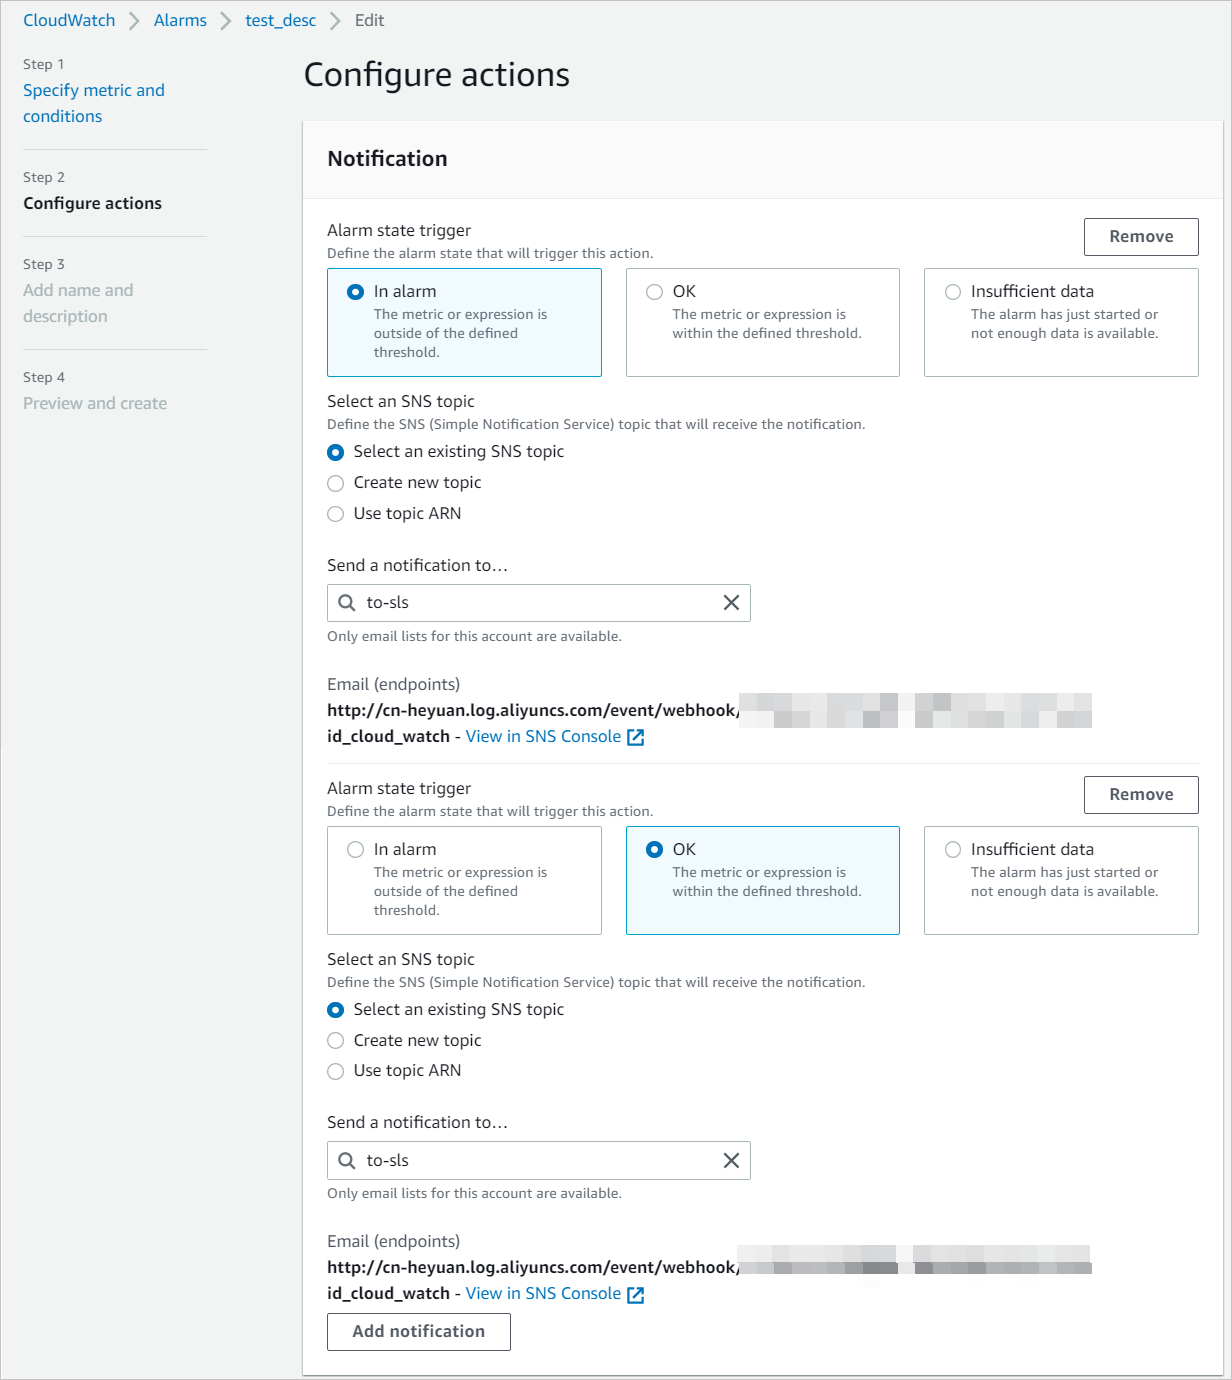
Amazon CloudWatch is a service that monitors Amazon Web Services (AWS) resources and applications on AWS in real time. CloudWatch can work with Amazon Simple Notification Service (Amazon SNS) to send alerts. You need only to configure the webhook URL that is provided by the alert ingestion system of Log Service in Amazon SNS. This way, alerts can be sent from CloudWatch to Log Service. The alerting system of Log Service processes the alerts, such as denoising the alerts and sending alert notifications.
Prerequisites
Configure CloudWatch
CloudWatch alerts
- For alerts that are created based on static thresholds, the value of the Trigger field contains fields such as MetricName and Dimensions.
- For alerts that are created based on anomaly detection, the value of the Trigger field contains fields such as Metrics. The value of the Metrics field is a list of metrics.
- Alerts that are created based on static thresholds
{ "AlarmName": "test-alert", "AlarmDescription": "this is a test alert", "AWSAccountId": "123456", "NewStateValue": "ALARM", "NewStateReason": "Threshold Crossed: 1 out of the last 1 datapoints [1.0 (04/08/21 03:06:00)] was greater than or equal to the threshold (1.0) (minimum 1 datapoint for OK -> ALARM transition).", "StateChangeTime": "2021-08-04T03:10:10.215+0000", "Region": "US East (Ohio)", "AlarmArn": "arn:aws:cloudwatch:us-east-2:123456:alarm:test-alert", "OldStateValue": "OK", "Trigger": { "MetricName": "NumberOfMessagesPublished", "Namespace": "AWS/SNS", "StatisticType": "Statistic", "Statistic": "SUM", "Unit": null, "Dimensions": [ { "value": "my-topic", "name": "TopicName" } ], "Period": 60, "EvaluationPeriods": 1, "ComparisonOperator": "GreaterThanOrEqualToThreshold", "Threshold": 1.0, "TreatMissingData": "- TreatMissingData: missing", "EvaluateLowSampleCountPercentile": "" } } - Alerts that are created based on anomaly detection
{
    "AlarmName": "cpu alrm",
    "AlarmDescription": "this is a cpu alarm",
    "AWSAccountId": "123456",
    "NewStateValue": "INSUFFICIENT_DATA",
    "NewStateReason": "Threshold Crossed: no datapoints were received for 2 periods and 2 missing datapoints were treated as [Breaching].",
    "StateChangeTime": "2021-08-05T08:38:47.104+0000",
    "Region": "US East (Ohio)",
    "AlarmArn": "arn:aws:cloudwatch:us-east-2:123456:alarm:cpu alrm",
    "OldStateValue": "OK",
    "Trigger":
    {
        "Period": 60,
        "EvaluationPeriods": 2,
        "ComparisonOperator": "GreaterThanUpperThreshold",
        "ThresholdMetricId": "ad1",
        "TreatMissingData": "- TreatMissingData:                    breaching",
        "EvaluateLowSampleCountPercentile": "",
        "Metrics":
        [
            {
                "Id": "m1",
                "MetricStat":
                {
                    "Metric":
                    {
                        "Dimensions":
                        [
                            {
                                "value": "i-1a2b3c4d",
                                "name": "InstanceId"
                            }
                        ],
                        "MetricName": "CPUUtilization",
                        "Namespace": "AWS/EC2"
                    },
                    "Period": 60,
                    "Stat": "Average"
                },
                "ReturnData": true
            },
            {
                "Expression": "ANOMALY_DETECTION_BAND(m1, 0.1)",
                "Id": "ad1",
                "Label": "CPUUtilization (expected)",
                "ReturnData": true
            }
        ]
    }
}
Field mappings
After a CloudWatch alert is ingested into Log Service, the alert is converted to a Log Service alert based on field mappings. The following sample code provides an example of a Log Service alert:
- Alerts that are created based on static thresholds
{ "aliuid": "aliuid1", "alert_instance_id": "{Automatically generated}", "alert_id": "CloudWatch_test-alert", "alert_type": "sls_pub", "alert_name": "test-alert", "region": "{The region of the project to which Alert Center belongs}", "project": "{The project to which Alert Center belongs}", "project_id": 0, "next_eval_interval": 60, "alert_time": 1628046610, "fire_time": 1628046610, "fire_results": null, "fire_results_count": 0, "resolve_time": 0, "status": "firing", "results": null, "labels": { "TopicName": "my-topic", "__comparison_operator__": "GreaterThanOrEqualToThreshold", "__statistic__": "SUM", "__statistic_type__": "Statistic", "__threshold__": "1", "metric_name": "NumberOfMessagesPublished" }, "annotations": { "__alarm_arn__": "arn:aws:cloudwatch:us-east-2:123456:alarm:test-alert", "__aws_accountId__": "123456", "__aws_region__": "US East (Ohio)", "__cloud_watch_alert_type__": "StaticThreshold", "__config_app__": "sls_pub_alert", "__pub_alert_app__": "{The ID of the alert ingestion application}", "__pub_alert_protocol__": "cloud_watch", "__pub_alert_region__": "{The region of the endpoint to which the alert is sent}", "__pub_alert_service__": "{The ID of the alert ingestion service}", "desc": "this is a test alert", "title": "Threshold Crossed: 1 out of the last 1 datapoints [1.0 (04/08/21 03:06:00)] was greater than or equal to the threshold (1.0) (minimum 1 datapoint for OK -> ALARM transition)." }, "severity": 10, "policy": { "alert_policy_id": "{The ID of the alert policy that is specified for the alert ingestion application}", "action_policy_id": "{The ID of the action policy that is specified for the alert ingestion application}", "use_default": false, "repeat_interval": "{The cycle that is specified for the alert ingestion application}" }, "template": null, "drill_down_query": "https://us-east-2.console.aws.amazon.com/cloudwatch/home?region=us-east-2#alarmsV2:alarm/test-alert" } - Alerts that are created based on anomaly detection
{
    "aliuid": "aliuid1",
    "alert_instance_id": "{Automatically generated}",
    "alert_id": "CloudWatch_cpu alrm",
    "alert_type": "sls_pub",
    "alert_name": "cpu alrm",
    "region": "{The region of the project to which Alert Center belongs}",
    "project": "{The project to which Alert Center belongs}",
    "project_id": 0,
    "next_eval_interval": 120,
    "alert_time": 1628152727,
    "fire_time": 1628152727,
    "fire_results": null,
    "fire_results_count": 0,
    "resolve_time": 0,
    "status": "firing",
    "results": null,
    "labels":
    {
        "__comparison_operator__": "GreaterThanUpperThreshold",
        "__threshold_metricId__": "ad1"
    },
    "annotations":
    {
        "__alarm_arn__": "arn:aws:cloudwatch:us-east-2:123456:alarm:cpu alrm",
        "__aws_accountId__": "123456",
        "__aws_region__": "US East (Ohio)",
        "__cloud_watch_alert_type__": "AnomalyDetection",
        "__config_app__": "sls_pub_alert",
        "__pub_alert_app__": "{The ID of the alert ingestion application}",
        "__pub_alert_protocol__": "cloud_watch",
        "__pub_alert_region__": "{The region of the endpoint to which the alert is sent}",
        "__pub_alert_service__": "{The ID of the alert ingestion service}",
        "desc": "this is a cpu alarm",
        "title": "Threshold Crossed: no datapoints were received for 2 periods and 2 missing datapoints were treated as [Breaching]."
    },
    "severity": 8,
    "policy":
    {
        "alert_policy_id": "{The ID of the alert policy that is specified for the alert ingestion application}",
        "action_policy_id": "{The ID of the action policy that is specified for the alert ingestion application}",
        "use_default": false,
        "repeat_interval": "{The cycle that is specified for the alert ingestion application}"
    },
    "template": null,
    "drill_down_query": "https://us-east-2.console.aws.amazon.com/cloudwatch/home?region=us-east-2#alarmsV2:alarm/cpu%20alrm"
}
The following table describes the field mappings between Log Service and CloudWatch alerts.
| Log Service field | CloudWatch field | Description |
|---|---|---|
| aliuid | None | The ID of the Alibaba Cloud account to which the alert ingestion application belongs. |
| alert_id | None | The ID of the alert monitoring rule.
The value of the alert_id field is in the CloudWatch_{$alert_name} format. {$alert_name} is the name of the alert monitoring rule. |
| alert_type | None | The type of the alert. The value is fixed as sls_pub. |
| alert_name | AlarmName | The name of the alert monitoring rule. |
| status | NewStateValue | The status of the alert.
|
| next_eval_interval |
|
The interval at which the alert is evaluated. The value is the product of the values of the Period field and the EvaluationPeriods field in the CloudWatch alert. |
| alert_time | StateChangeTime | The time at which the alert is triggered. |
| fire_time | StateChangeTime | The time at which the alert is first triggered. |
| resolve_time | StateChangeTime | The time at which the alert is cleared.
|
| labels | None | The labels of the alert.
|
| annotations | None | The annotations of the alert. The following fields are added to the annotations field:
|
| severity | NewStateValue | The severity of the alert.
|
| policy | None | The alert policy that is specified for the alert ingestion application. For more information, see Description of the policy variable. |
| project | None | The project to which Alert Center belongs. For more information, see Project. |
| drill_down_query | None | The URL to the CloudWatch alert. |

