The operator profiling feature allows you to view the intermediate results of a deployment without the need to modify the deployment. This feature simplifies the check of data correctness, improves human resource efficiency and business continuity, and reduces the interruption time of major real-time services. This topic describes how to perform operator profiling.
Background information
When you perform O&M on a fully managed Flink deployment, the results may not meet your expectations. This is regarded as a data correctness issue. The causes of data correctness issues are complex and difficult to identify. In most cases, you can logically disassemble an SQL deployment, print the results of each step by using the Print connector, and then analyze the results to identify the possible causes. This process is time-consuming, and you may fail to identify the cause due to differences between test data and online data or inconsistency between state data. Therefore, a long period of time is required to resolve data correctness issues, and you need to cancel and then start the deployment multiple times. To resolve data correctness issues, Realtime Compute for Apache Flink provides the operator profiling feature. This feature allows you to view the input and output of a specific operator without the need to modify the deployment. This helps you troubleshoot data correctness issues in an efficient manner.
Limits
Only SQL deployments that are running support the operator profiling feature.
Only deployments that use Ververica Runtime (VVR) 8.0.4 or later support the operator profiling feature.
Deployments that execute the CREATE TABLE AS or CREATE DATABASE AS statement do not support the operator profiling feature.
Deployments that are deployed in session clusters do not support the operator profiling feature.
You can perform operator profiling again only if the previous operator profiling operation is complete.
Procedure
Log on to the Realtime Compute for Apache Flink console. On the Fully Managed Flink tab, find the workspace that you want to manage and click Console in the Actions column.
In the left-side navigation pane, click .
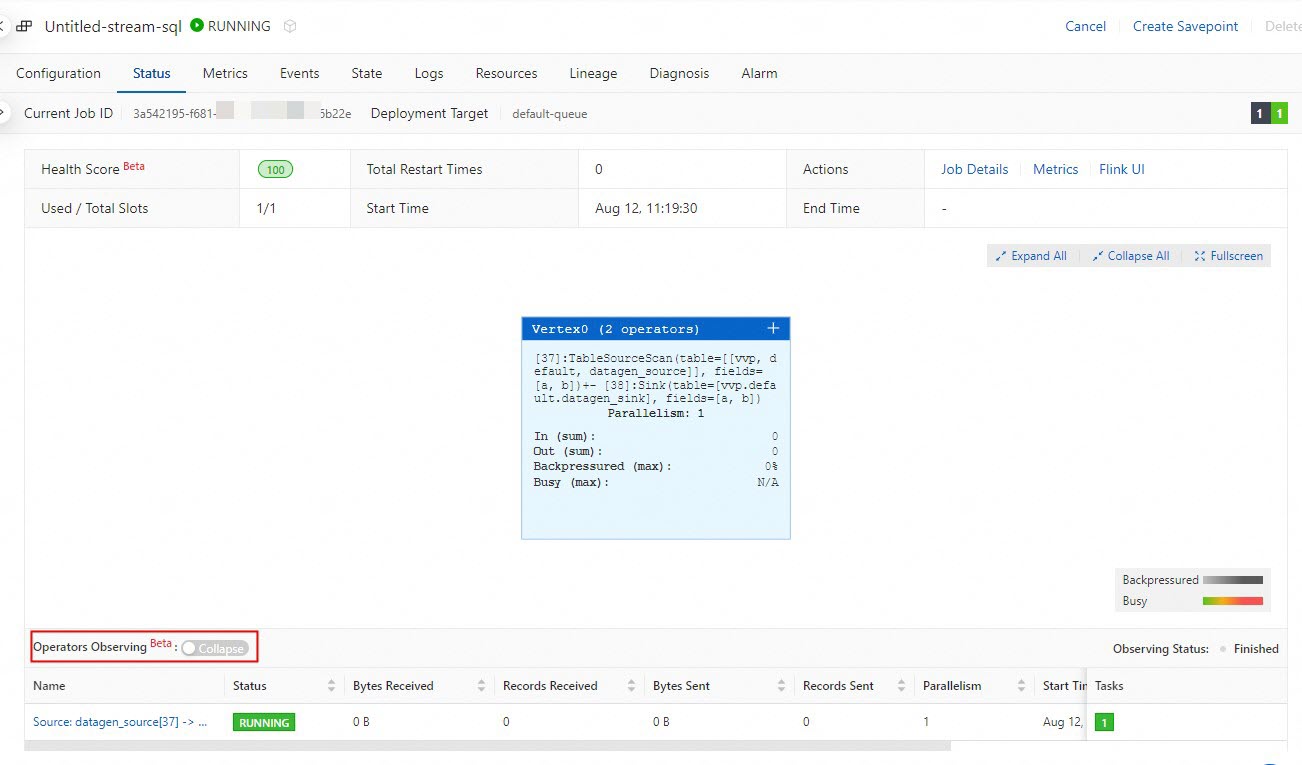
On the Deployments page, find the desired deployment and click the name of the deployment. On the deployment details page, click the Status tab.
Enable the operator profiling feature.
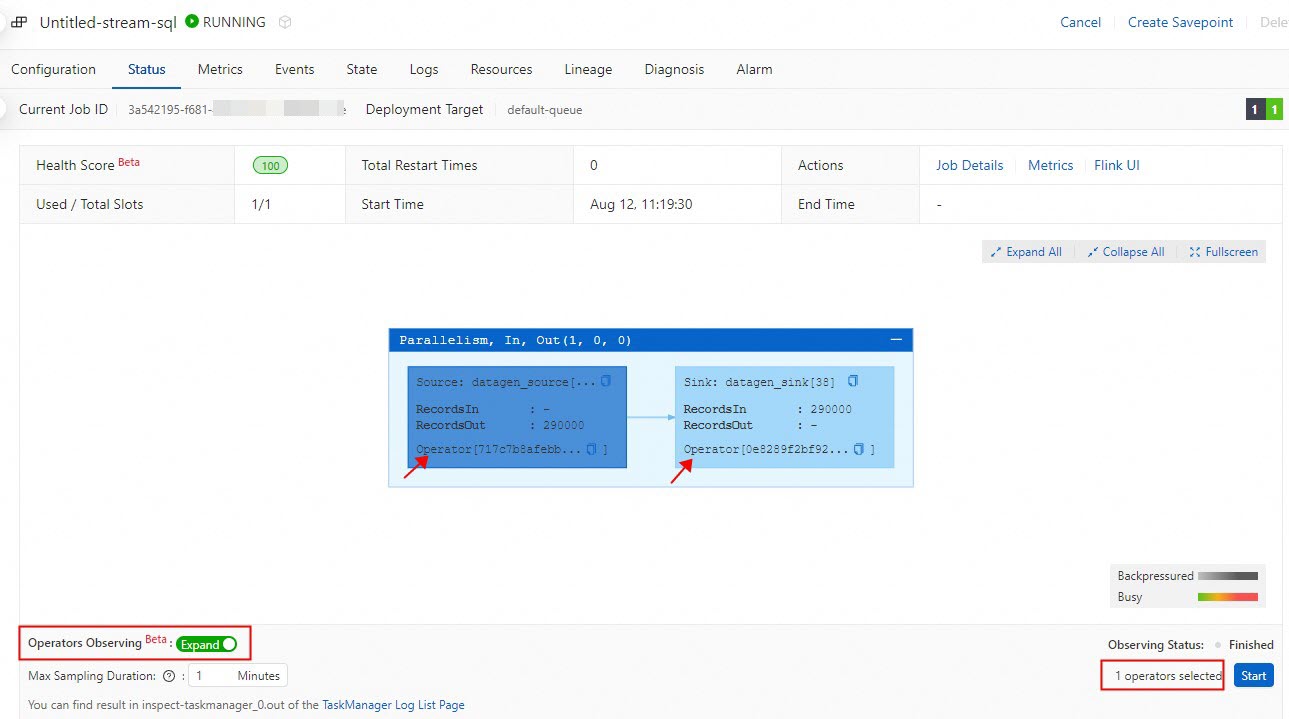
Turn on Operators Observing.

Select one or more operators that you want to detect.

Configure the Max Sampling Duration parameter.
You can set the Max Sampling Duration parameter to a value that ranges from 1 minute to 30 minutes. If the maximum storage is reached during the sampling process, the sampling is terminated.
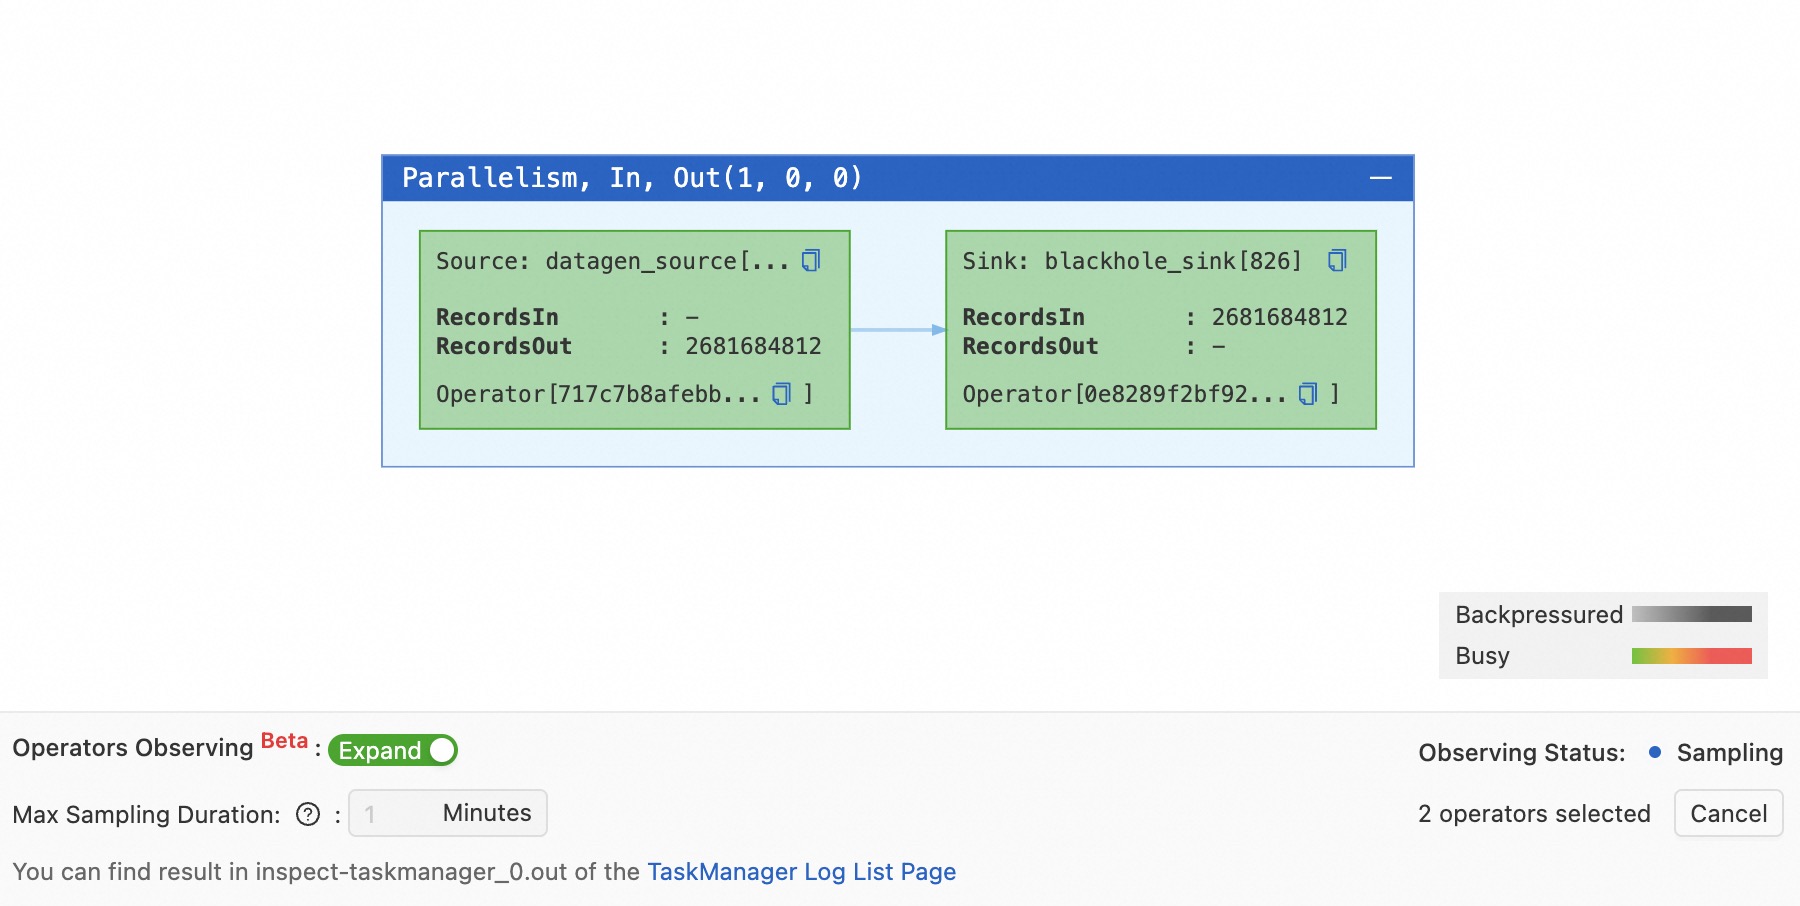
Click Start. The value of the Observing Status parameter changes to Sampling.
NoteYou can perform operator profiling again only if the previous operator profiling operation is complete.

View the operator profiling results.
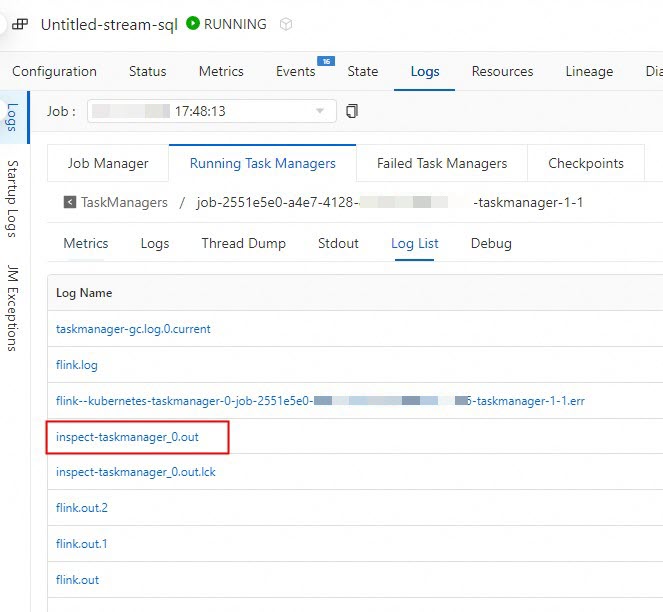
You can click TaskManager Log List Page to go to the Running Task Managers tab and view the log whose Log Name is inspect-taskmanager_0.out.

The following figure shows the results. You can copy the operator name in the directed acyclic graph (DAG) on the Status tab and search for the operator output by operator name on the Logs tab.

Termination of operator profiling
Operator profiling for a deployment automatically stops if a JobManager or TaskManager failover occurs.
Sampling is terminated if the maximum storage is reached.
Operator profiling stops when the sampling time is reached.
You can manually stop operator profiling.