Realtime Compute for Apache Flink provides the Prometheus service for workspaces. If you no longer require the Prometheus service for a workspace or a metric for deployments in fully managed Flink, you can disable the Prometheus service or discard the metric. This helps reduce monitoring costs. You can restore the metric that you discard based on your business requirements. This topic describes how to disable and enable the Prometheus service and how to discard and restore a metric.
Important notes
If you use a RAM user or RAM role to access fully managed Flink, the RAM user or RAM role must have the permissions to access Application Real-Time Monitoring Service (ARMS). For more information, see Overview.
This feature is available for workspaces that has enabled Managed Service for Prometheus.
Disable or enable the Prometheus service
You can uninstall a Prometheus instance to disable the Prometheus service for a workspace. After you disable the Prometheus service for a workspace, all metrics in the workspace are discarded.
Find the Prometheus instance that corresponds to the workspace.
Log on to the Realtime Compute for Apache Flink console.
Find your workspace and select in the Actions column to go to the ARMS console.

Click the
 icon in the upper-left corner of the Service Discovery page to go to the Managed Service for Prometheus page. The name in the upper-left corner of the Service Discovery page is the name of the Prometheus instance that corresponds to the workspace.
Disable or enable the Prometheus service.
Find the desired Prometheus instance and click Uninstall in the Actions column to disable the Prometheus service or click Install in the Actions column to enable the Prometheus service.
In the message that appears, click OK.
Discard a metric
You can discard specific metrics for deployments of a workspace.
Find the desired Prometheus instance that corresponds to the workspace.
Log on to the Realtime Compute for Apache Flink console.
Find your workspace and select in the Actions column.
You are redirected to the Service Discovery page for the Prometheus instance corresponding to your Flink workspace in the ARMS console.
Discard the metric.
In the left-side navigation pane, click Service Discovery.
On the Metrics tab, find the desired metric.
You can directly search for the name of the metric. You can also search for the flink keyword to obtain all metrics for Flink job deployments.
Select the metric that you want to discard and click Discard in the Actions column.
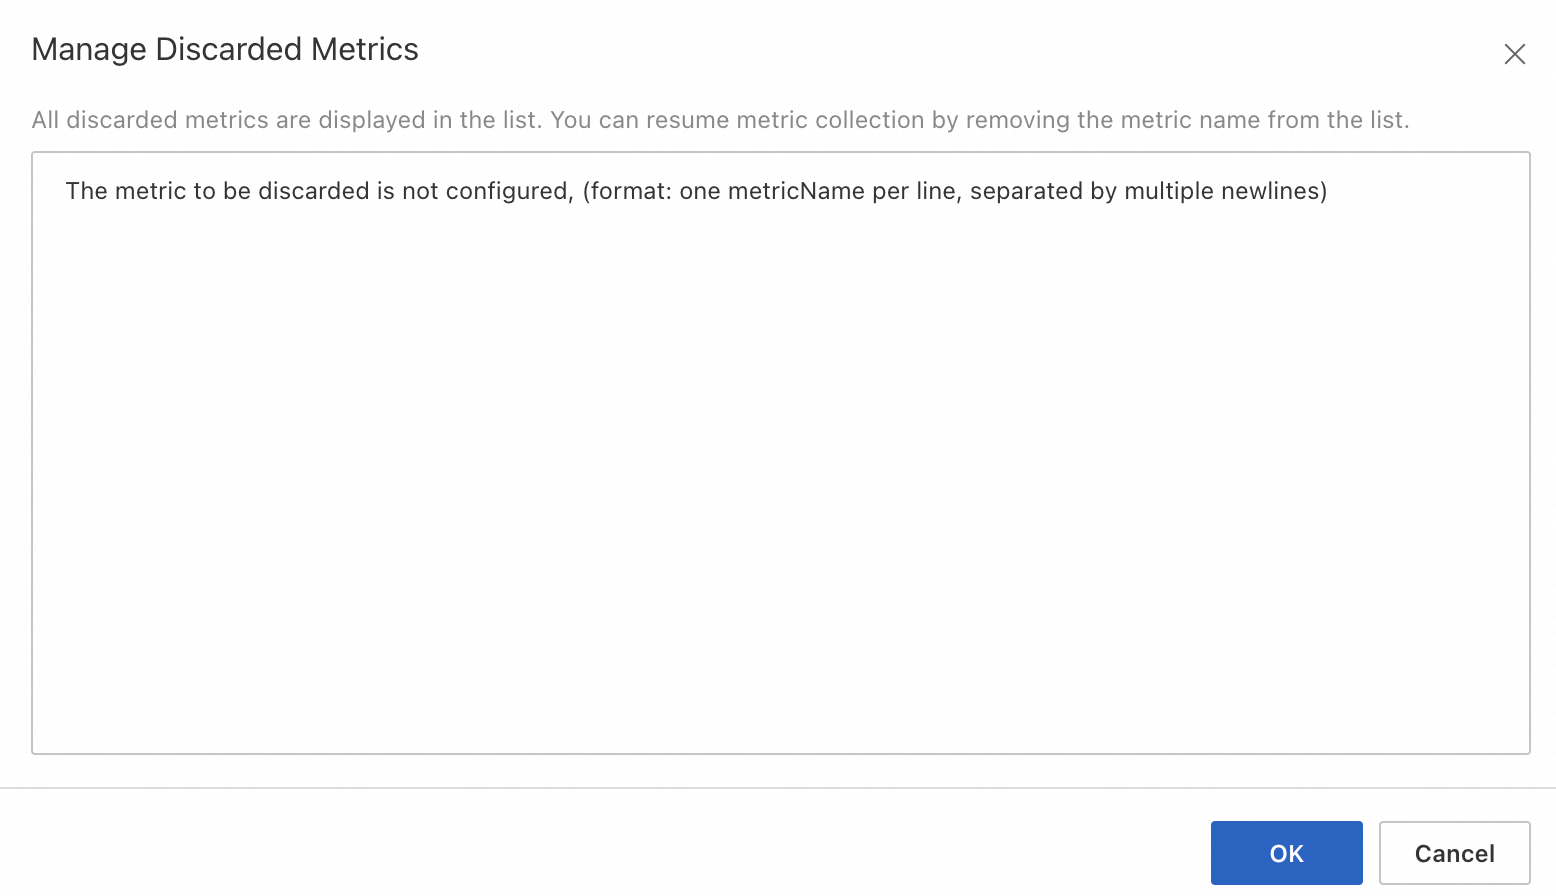
In the Manage Discarded Metrics dialog box, confirm the metric name and click OK.
Restore a metric
Find the Prometheus instance that corresponds to the workspace.
Log on to the Realtime Compute for Apache Flink console.
Find your workspace and select in the Actions column.
You are redirected to the Service Discovery page for the Prometheus instance corresponding to your Flink workspace in the ARMS console.
Restore the metric.
In the left-side navigation pane of the page that appears, click Service Discovery.
Click Manage Discarded Metrics.
In the Manage Discarded Metrics dialog box, delete the metric.

Click OK.
References
You can view the metrics of a deployment to check whether the deployment data is normal. For more information, see Metrics.
You can view metrics in the console of fully managed Flink or configure parameters to report metrics to other platforms. For more information, see Report metrics of Realtime Compute for Apache Flink to other platforms.
You can configure alert rules for deployments that are running in the console of fully managed Flink. For more information, see Configure monitoring and alerts.
 > Monitoring Indicator Configuration