ApsaraDB RDS uses CloudMonitor to track database metrics and send alert notifications when thresholds are breached. Configure alert rules to detect issues such as high CPU usage, storage exhaustion, or connection spikes, and notify your team by email.
How it works
CloudMonitor collects metrics from your RDS instances and evaluates them against alert rules. When a metric meets the conditions in a rule, CloudMonitor sends email notifications to all contacts in the associated alert contact group.
To receive alerts, create an alert contact group and assign it to your alert rules.
For other database engines, see:
Prerequisites
Before you begin, ensure that you have:
An ApsaraDB RDS for MySQL instance
Enable initiative alerts
The Initiative Alert feature sets up predefined alert rules for key RDS metrics in one step. After you turn on this feature, the system monitors critical metrics and sends notifications when exceptions occur. For more information, see Enable the initiative alert feature.
Go to the Instances page. In the top navigation bar, select the region in which the RDS instance resides. Find the RDS instance and click the instance ID.
In the left-side navigation pane, click Monitoring and Alerts.
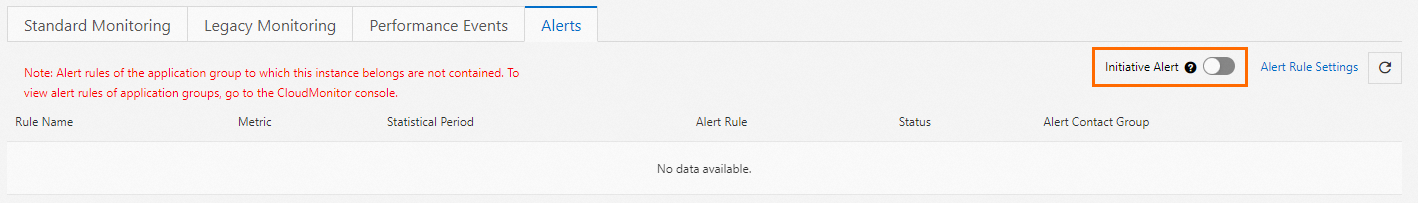
Click the Alerts tab.
Turn on the Initiative Alert switch.
Create an alert rule
Create custom alert rules to monitor specific metrics with thresholds tailored to your workload.
Go to the Instances page. In the top navigation bar, select the region in which the RDS instance resides. Find the RDS instance and click the instance ID.
In the left-side navigation pane, click Monitoring and Alerts.
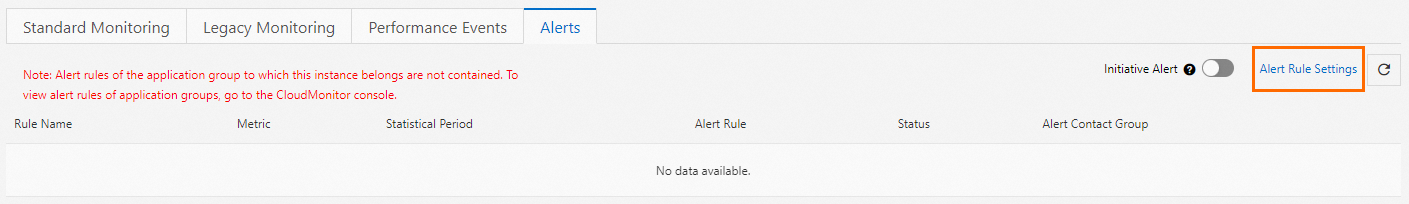
Click the Alerts tab.
Click Alert Rule Settings. The CloudMonitor console opens.
Create an alert contact group if you have not already. For more information, see Create an alert contact or alert contact group.
Create an alert rule. For more information, see Create an alert rule.
To automatically monitor resources that share the same tag, see Monitor resources based on tags.
Manage alert rules
View, modify, disable, enable, or delete existing alert rules from the CloudMonitor console.
Go to the Instances page. In the top navigation bar, select the region in which the RDS instance resides. Find the RDS instance and click the instance ID.
In the left-side navigation pane, click Monitoring and Alerts.
Click the Alerts tab.
Click Alert Rule Settings. The CloudMonitor console opens.
On the Alert Rules page, find the target alert rule and select an action from the Actions column:
Action Description More View the alert rule configuration and conditions. Alert History View alerts triggered by this rule within a specific time range. Modify Edit the alert rule. For more information, see Create an alert rule. Disable Stop the rule from triggering alerts. The rule is preserved but inactive. Enable Reactivate a disabled rule so it resumes triggering alerts when conditions are met. Delete Permanently remove the alert rule. Deleted rules cannot be restored.