Quick BI enables the consolidation of data cards from various dashboards into a personalized Pinboard, offering a comprehensive view of your data interests. This topic details the operations associated with the Pinboard.
The Pinboard is not compatible with the Internet Explorer browser. The use of Chrome or Safari browsers is recommended.
Scenarios
If you or your colleagues need to monitor data from multiple dashboards on a daily basis, the Pinboard feature allows you to consolidate your preferred data cards from various dashboards into a single Pinboard. You can then customize the layout to suit your preferences and set filters to focus on the conditions you frequently examine.
Operation entry
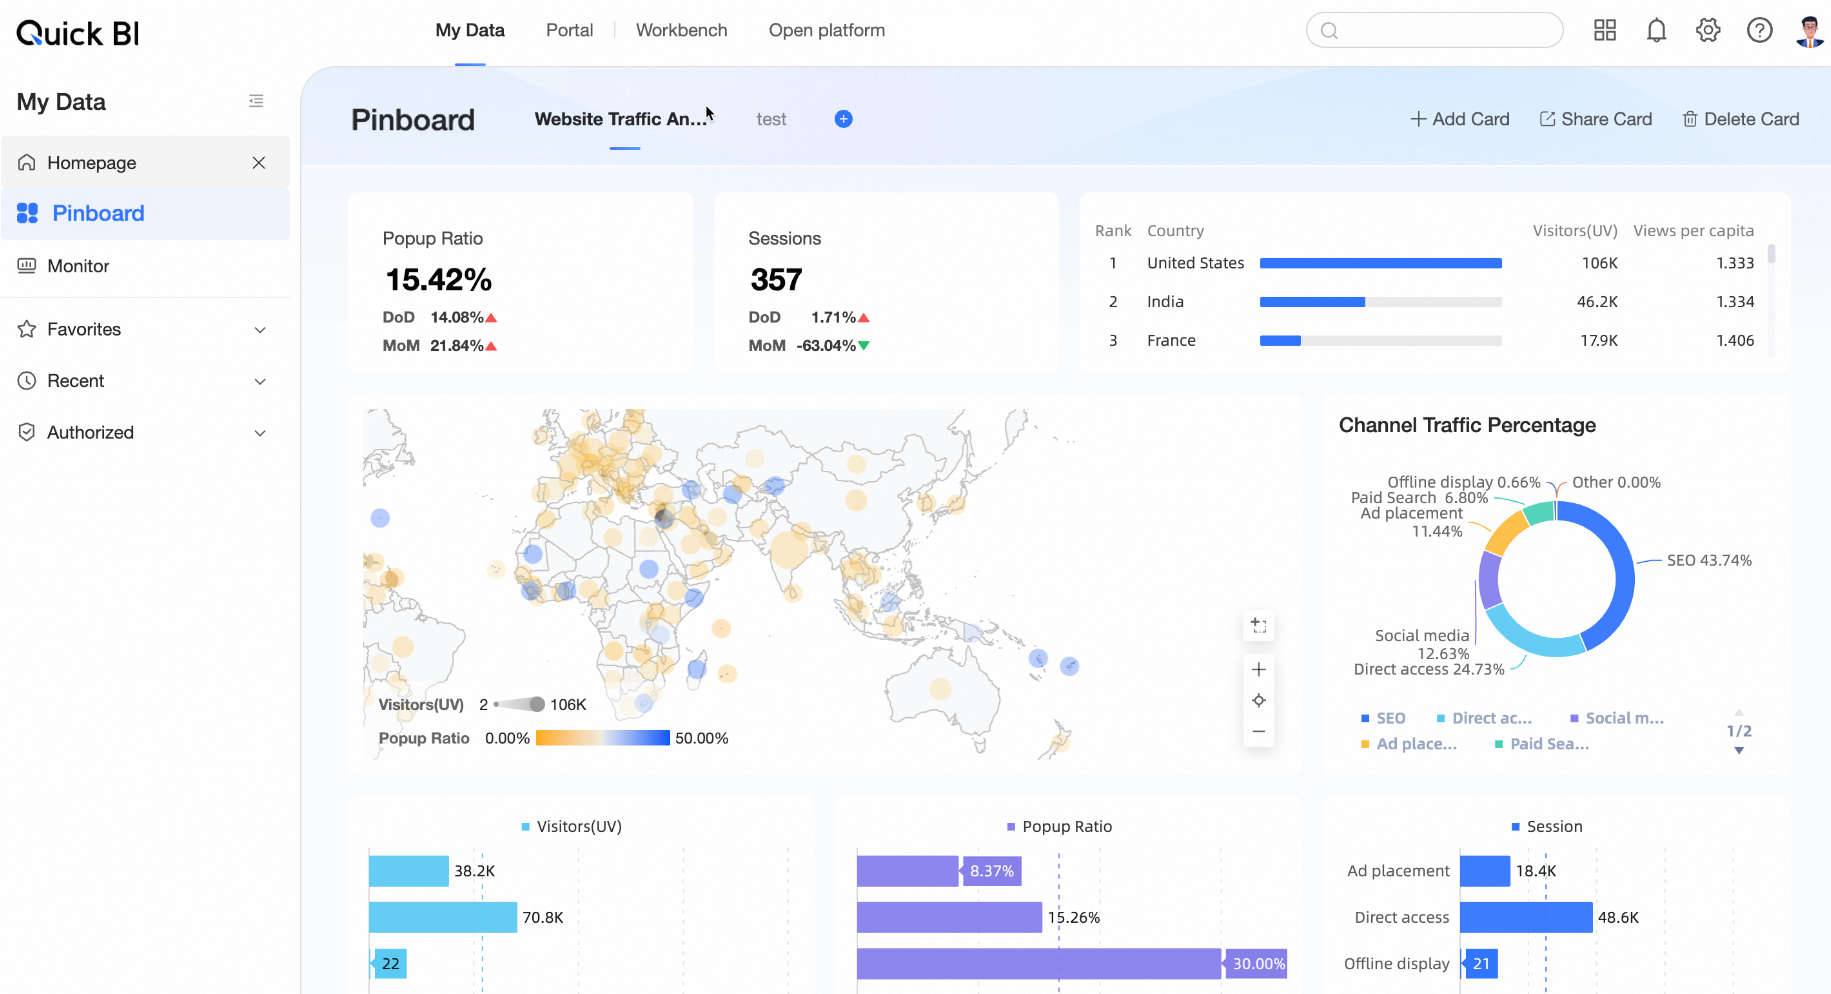
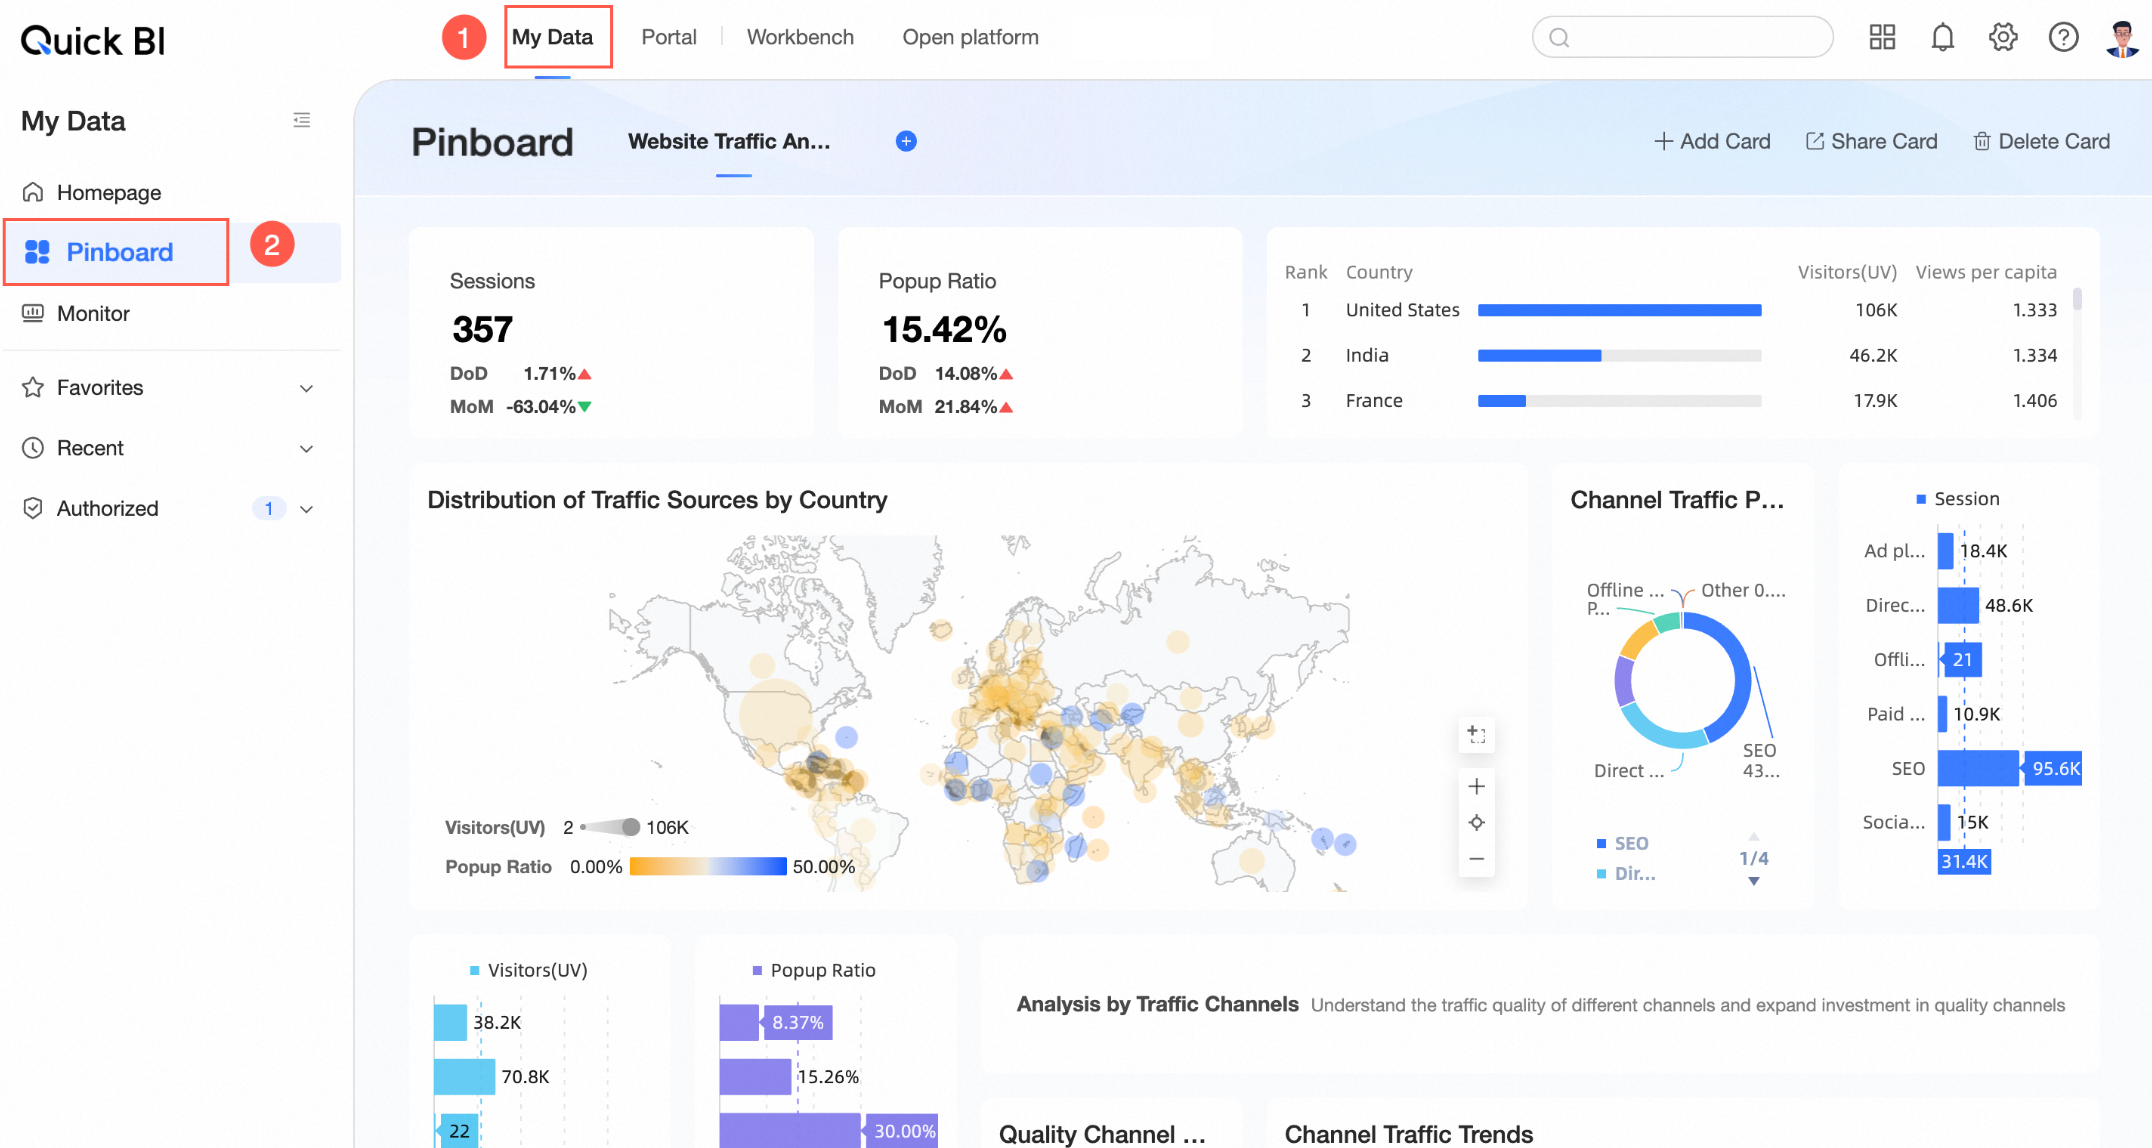
You can access the Pinboard by clicking My Dashboard -> Pinboard.
Create a new Pinboard
A maximum of 10 dashboards are supported.
To create a new Pinboard, click the
 icon on the right side of the Pinboard.
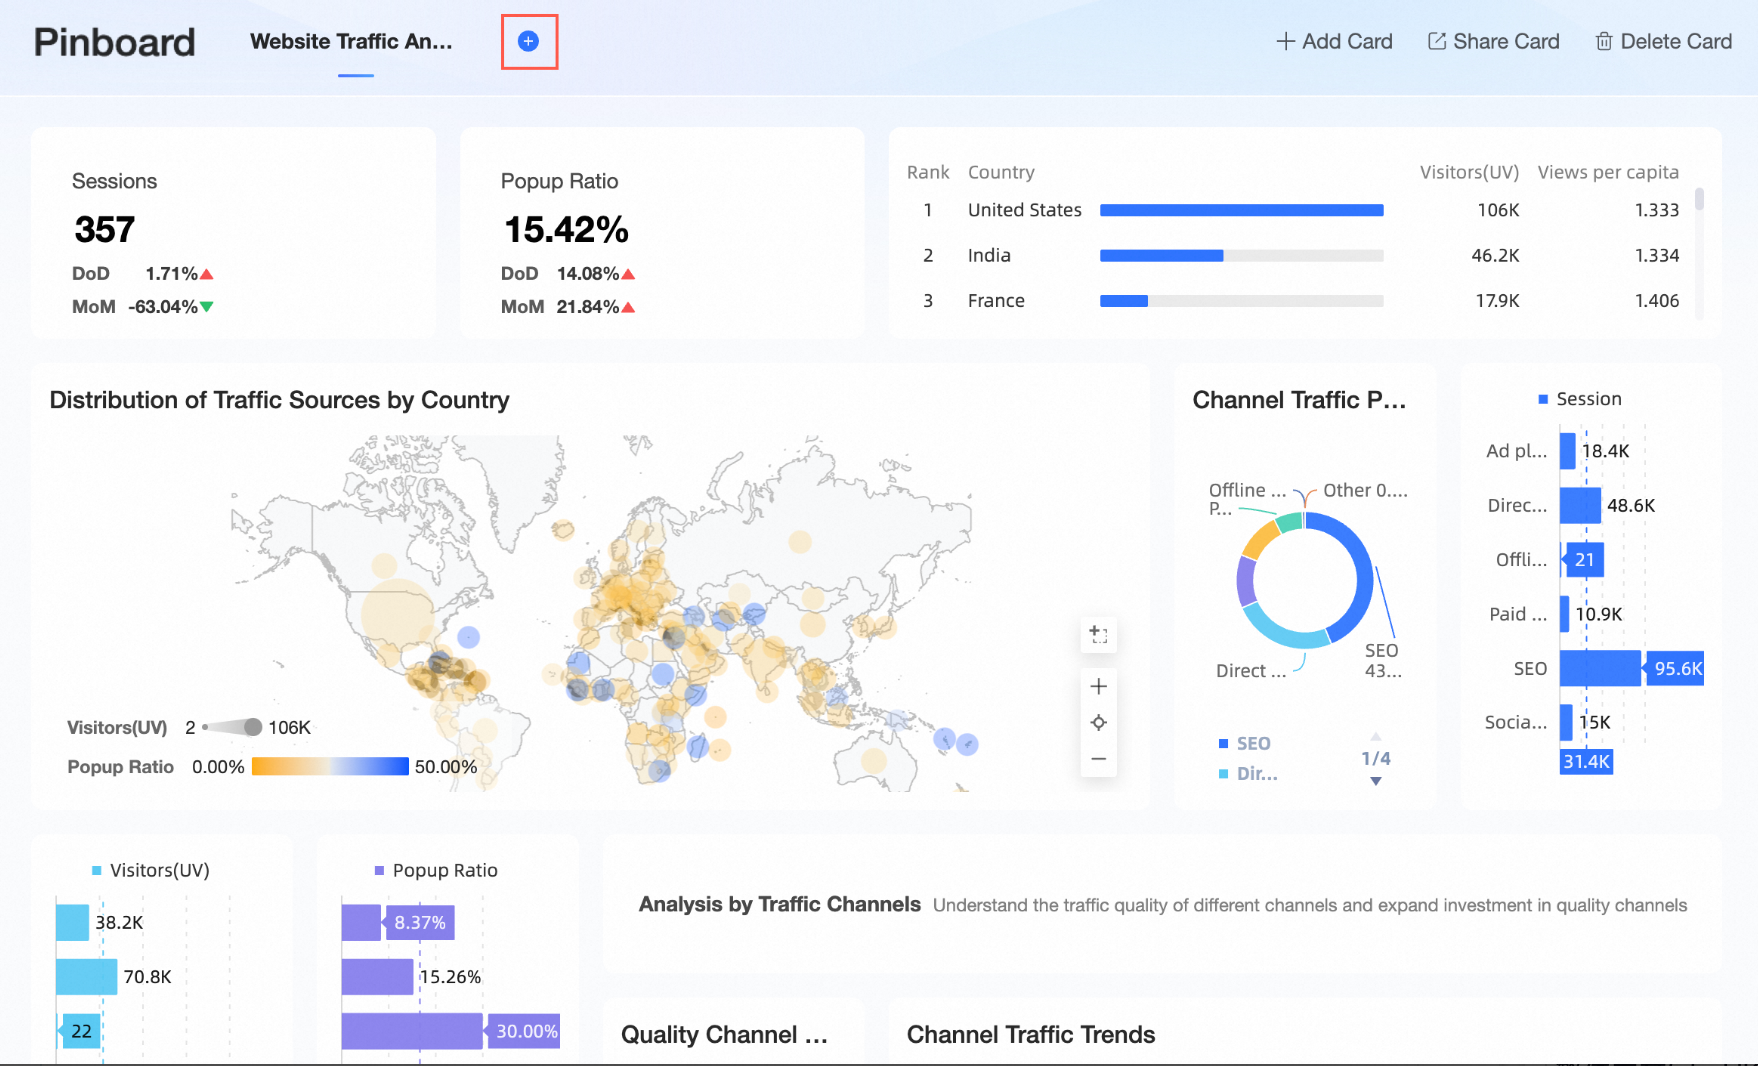 If no Pinboard has been created, you can click Create Now to initiate one.
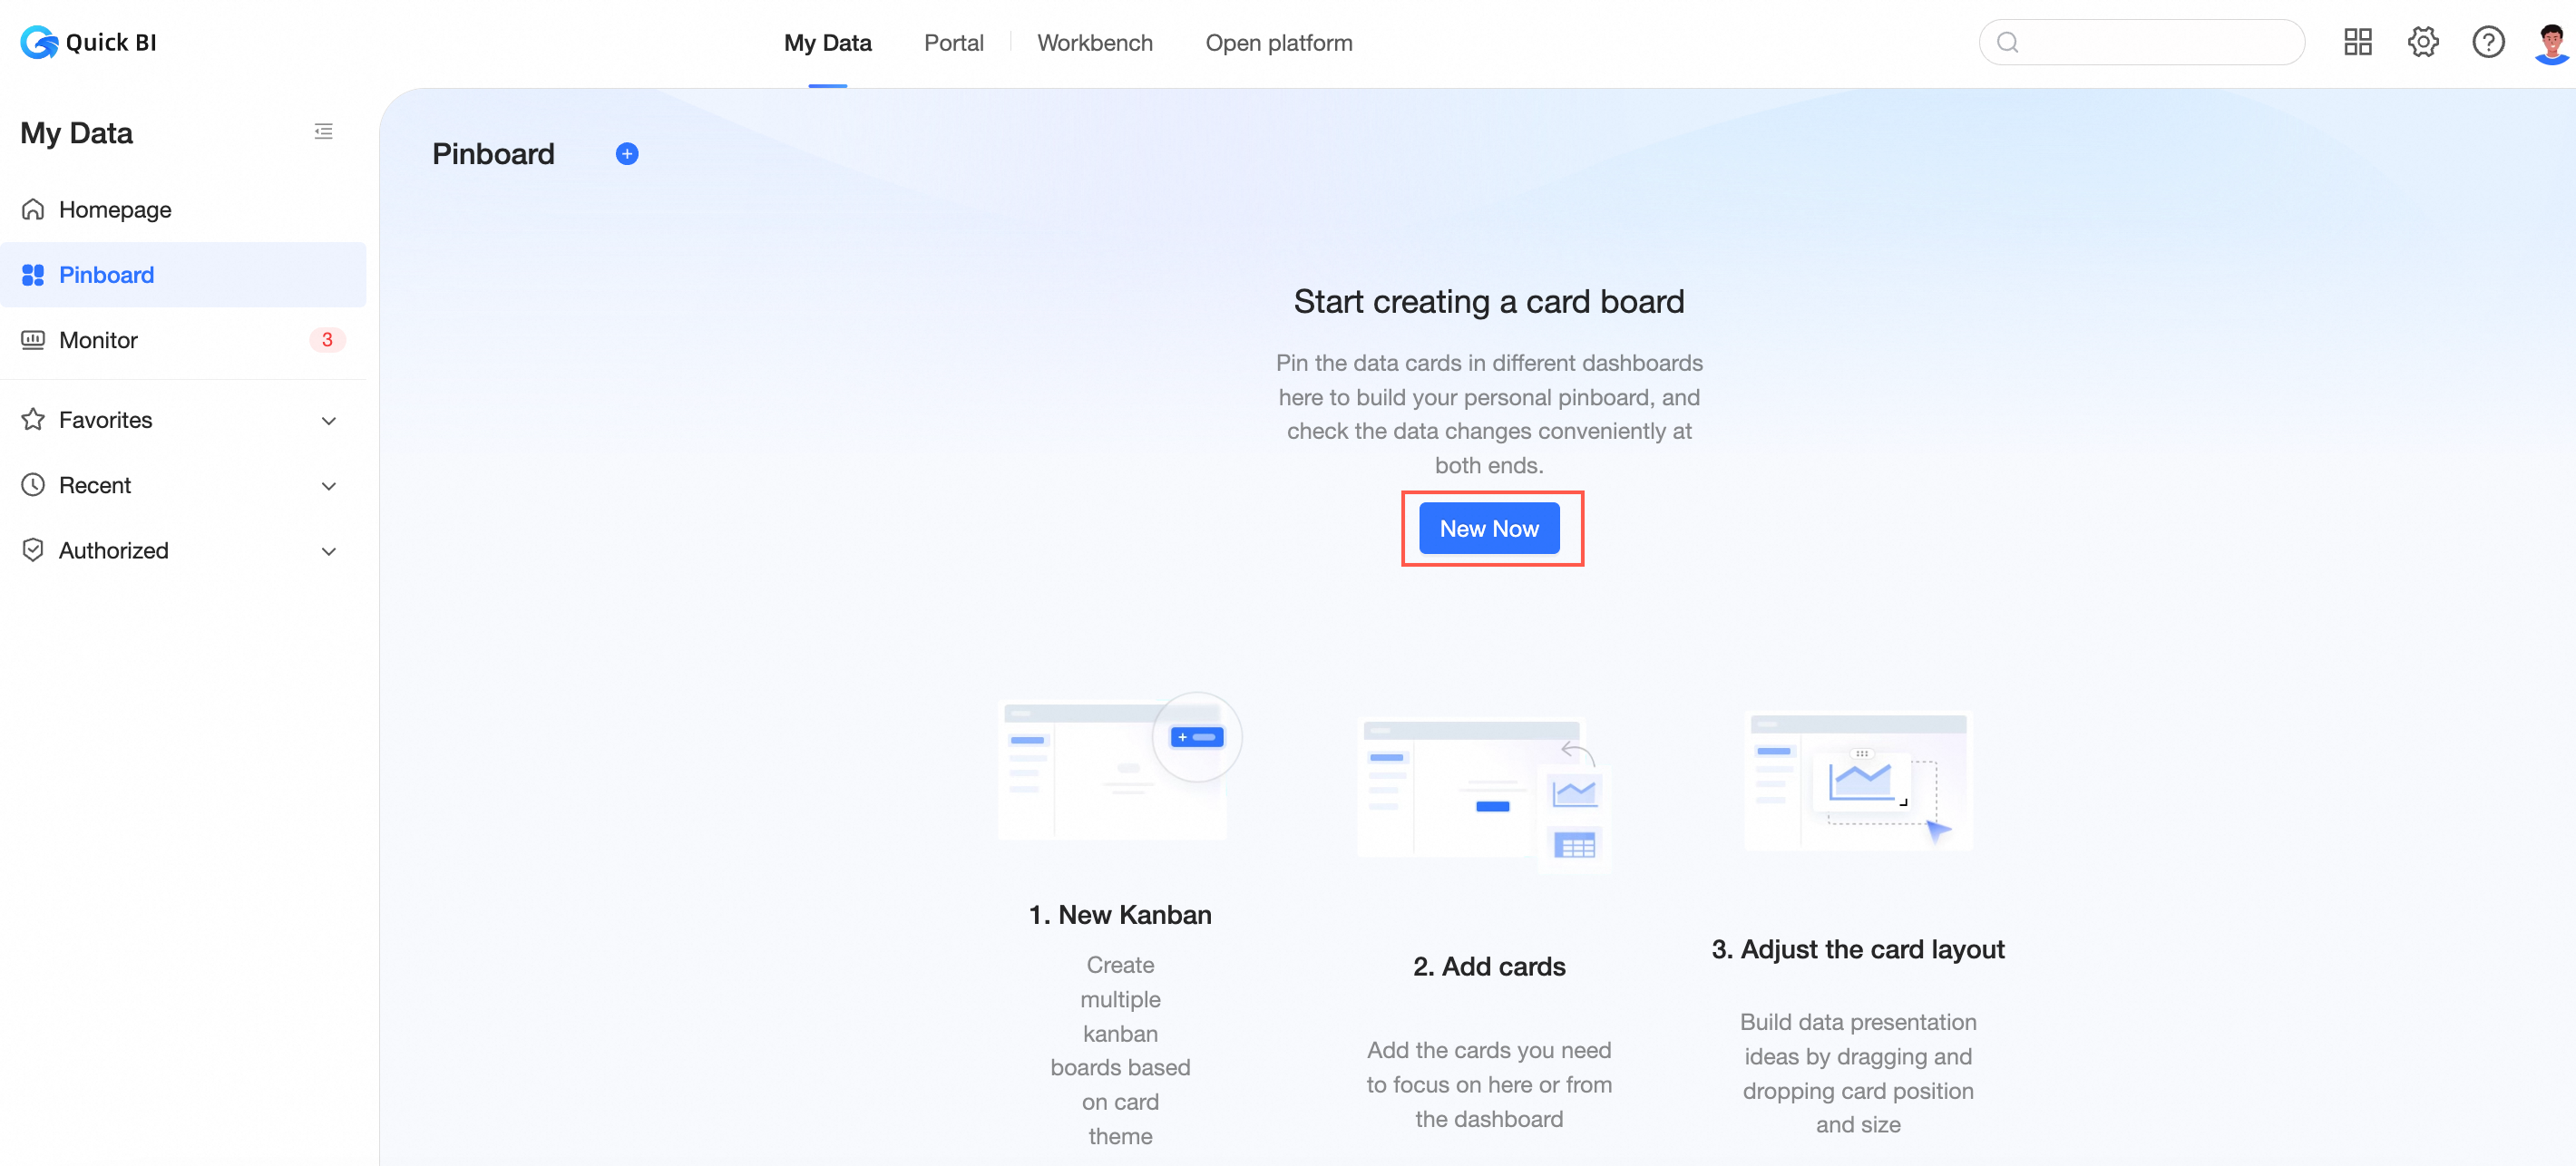
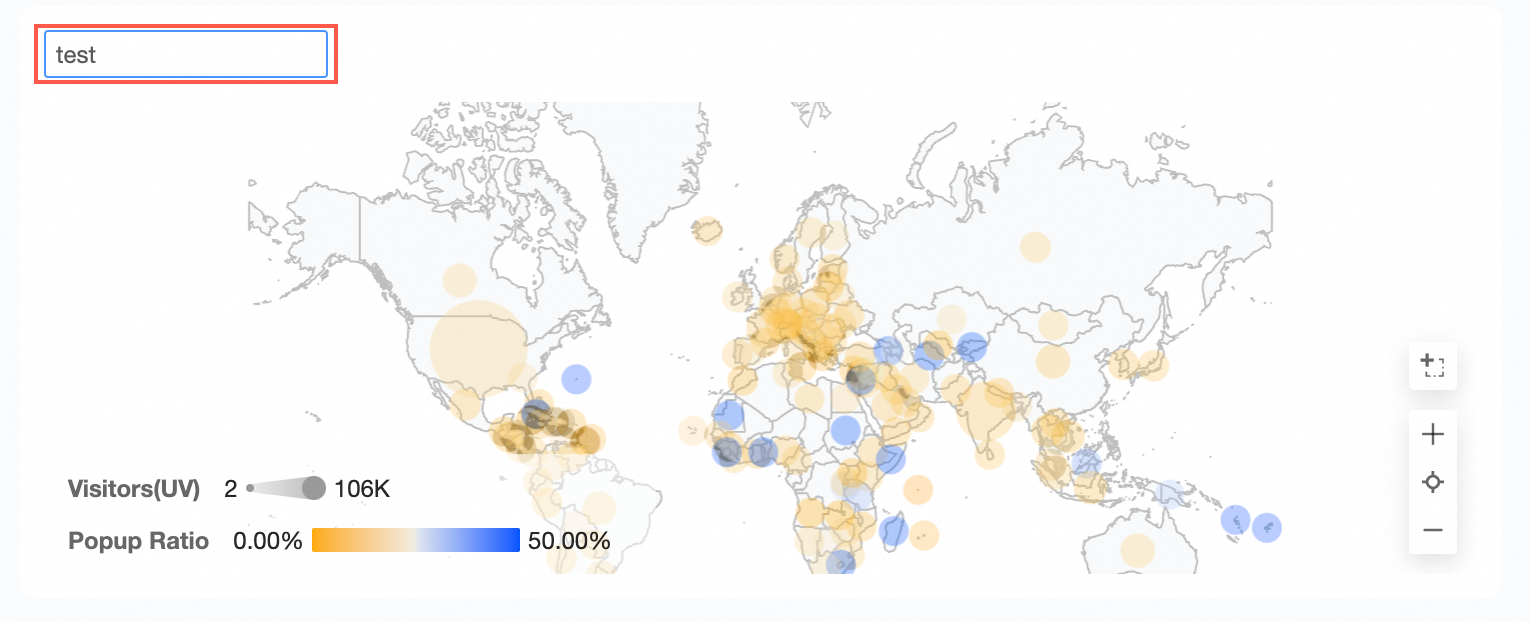
Enter the desired name for the card.
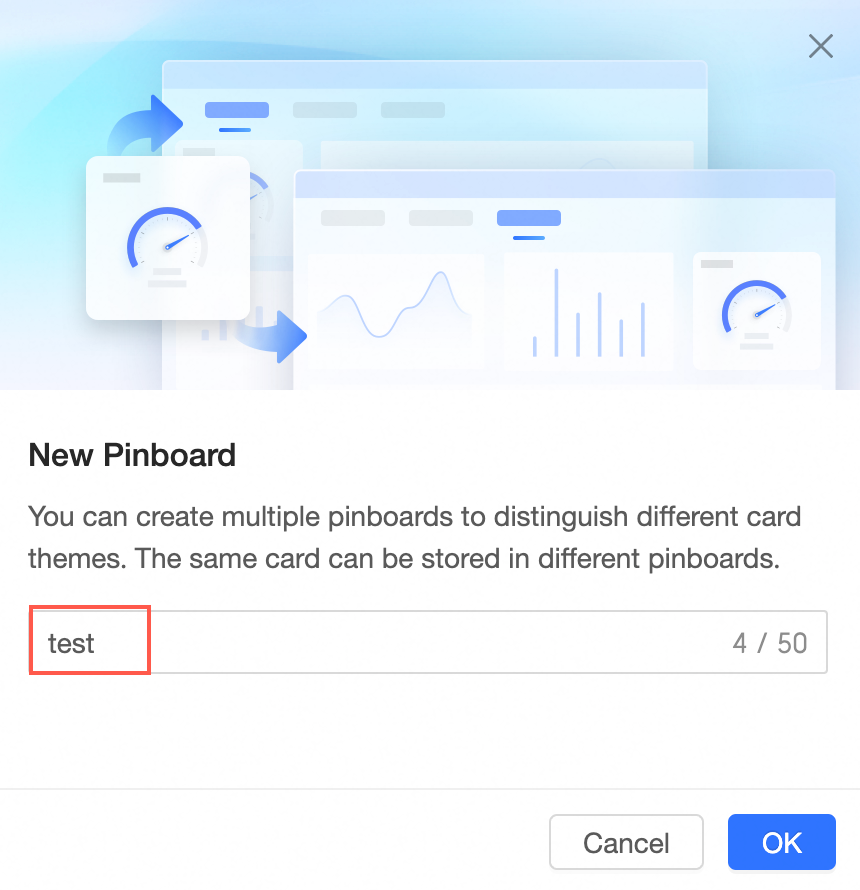
Click OK to confirm the creation of the Pinboard.
To add cards to your Pinboard, click Add Now or Add Card in the upper right corner.
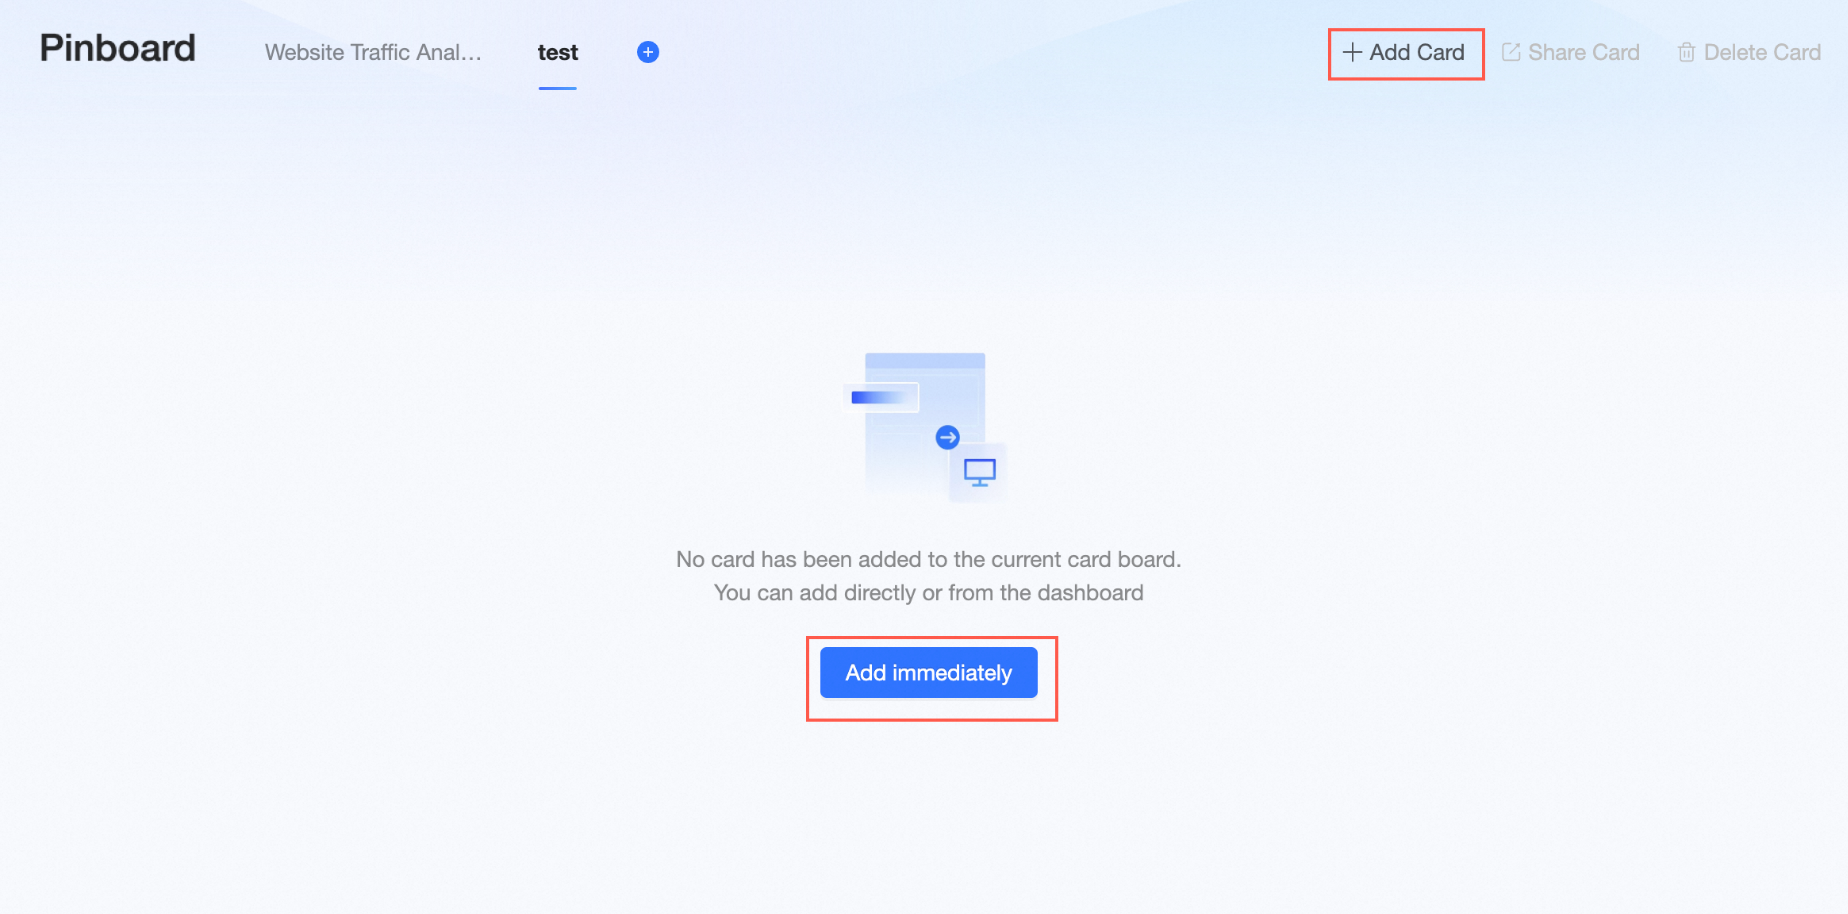
For more information, see Add Card.
To delete or rename the Pinboard, hover over it and click the
 icon.
icon.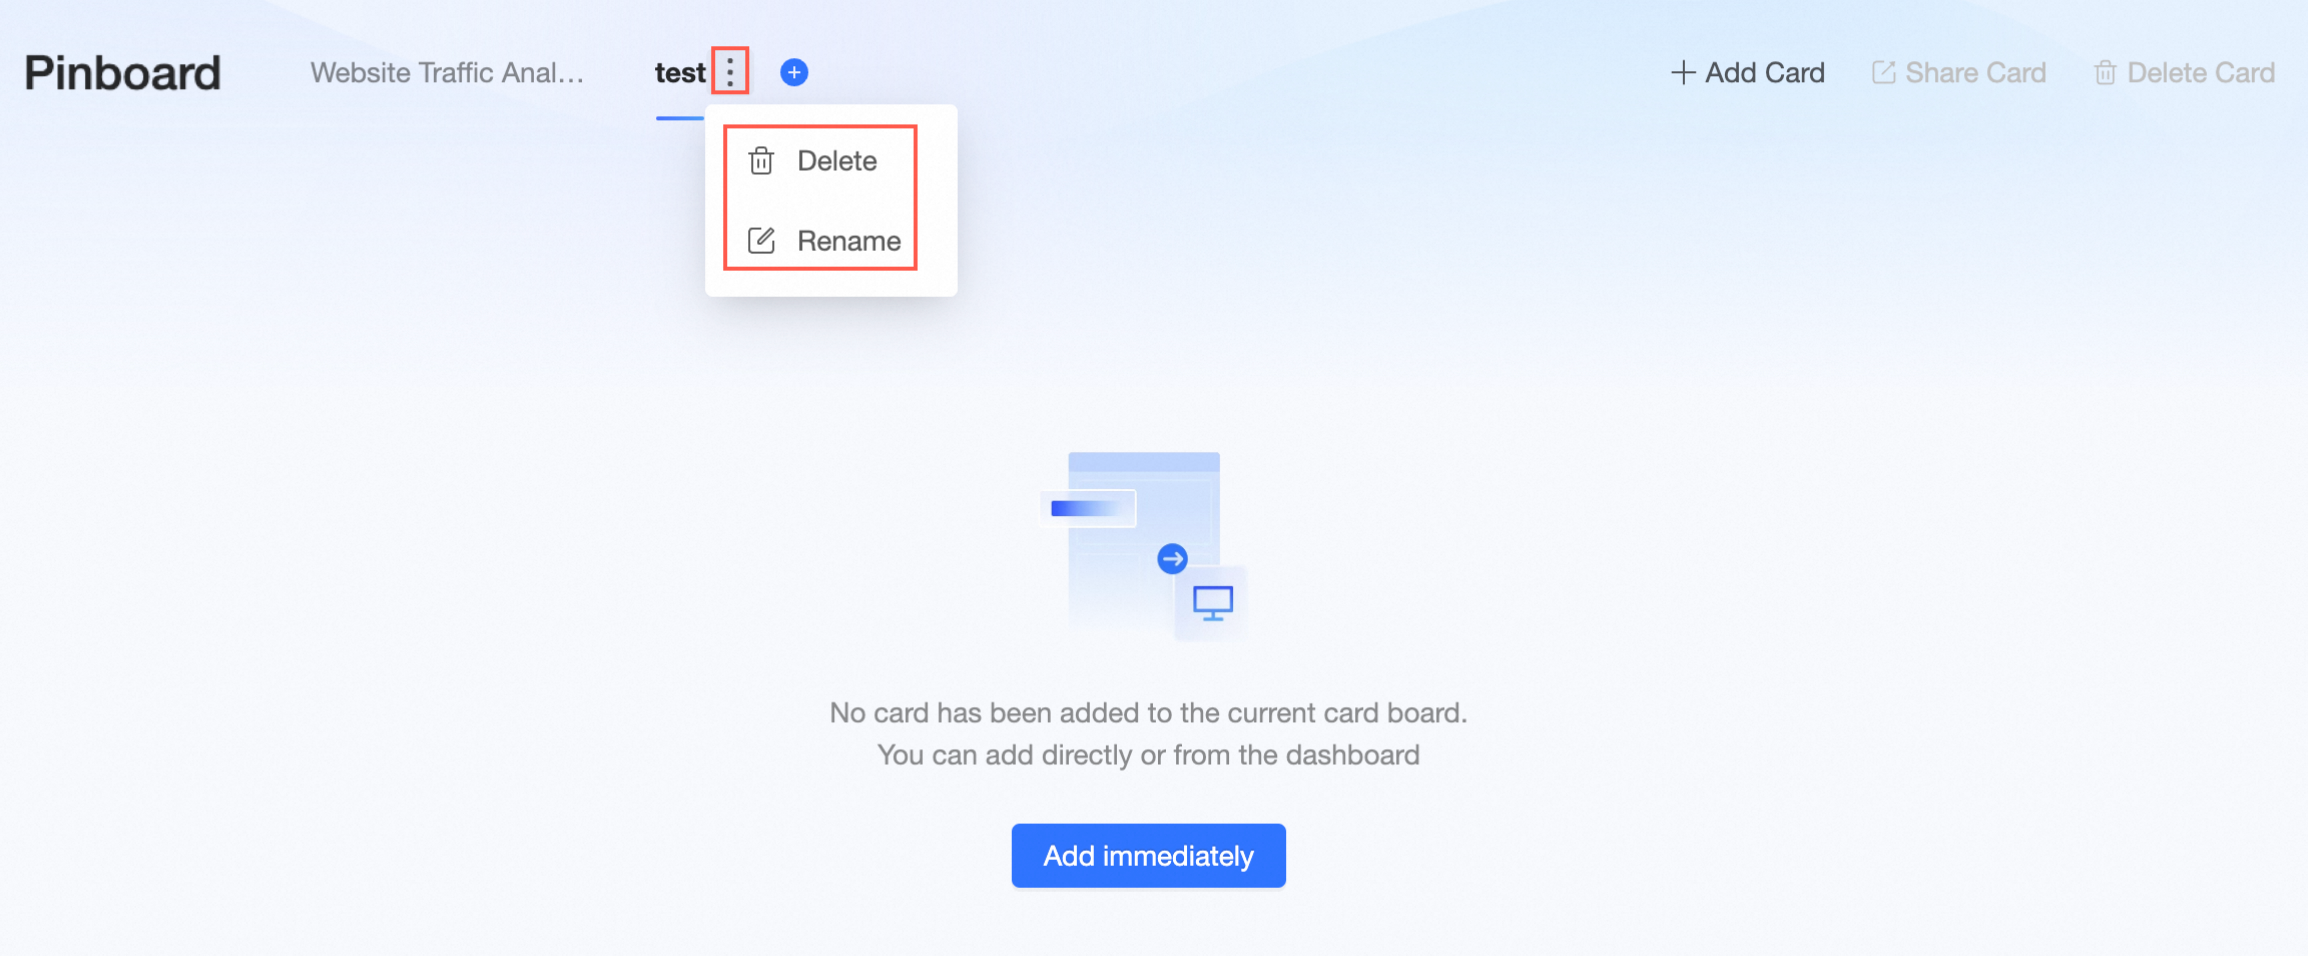
If you have multiple Pinboards, you can drag them to reorder as desired.
Add card
Adding Cards
Add cards within the Pinboard.
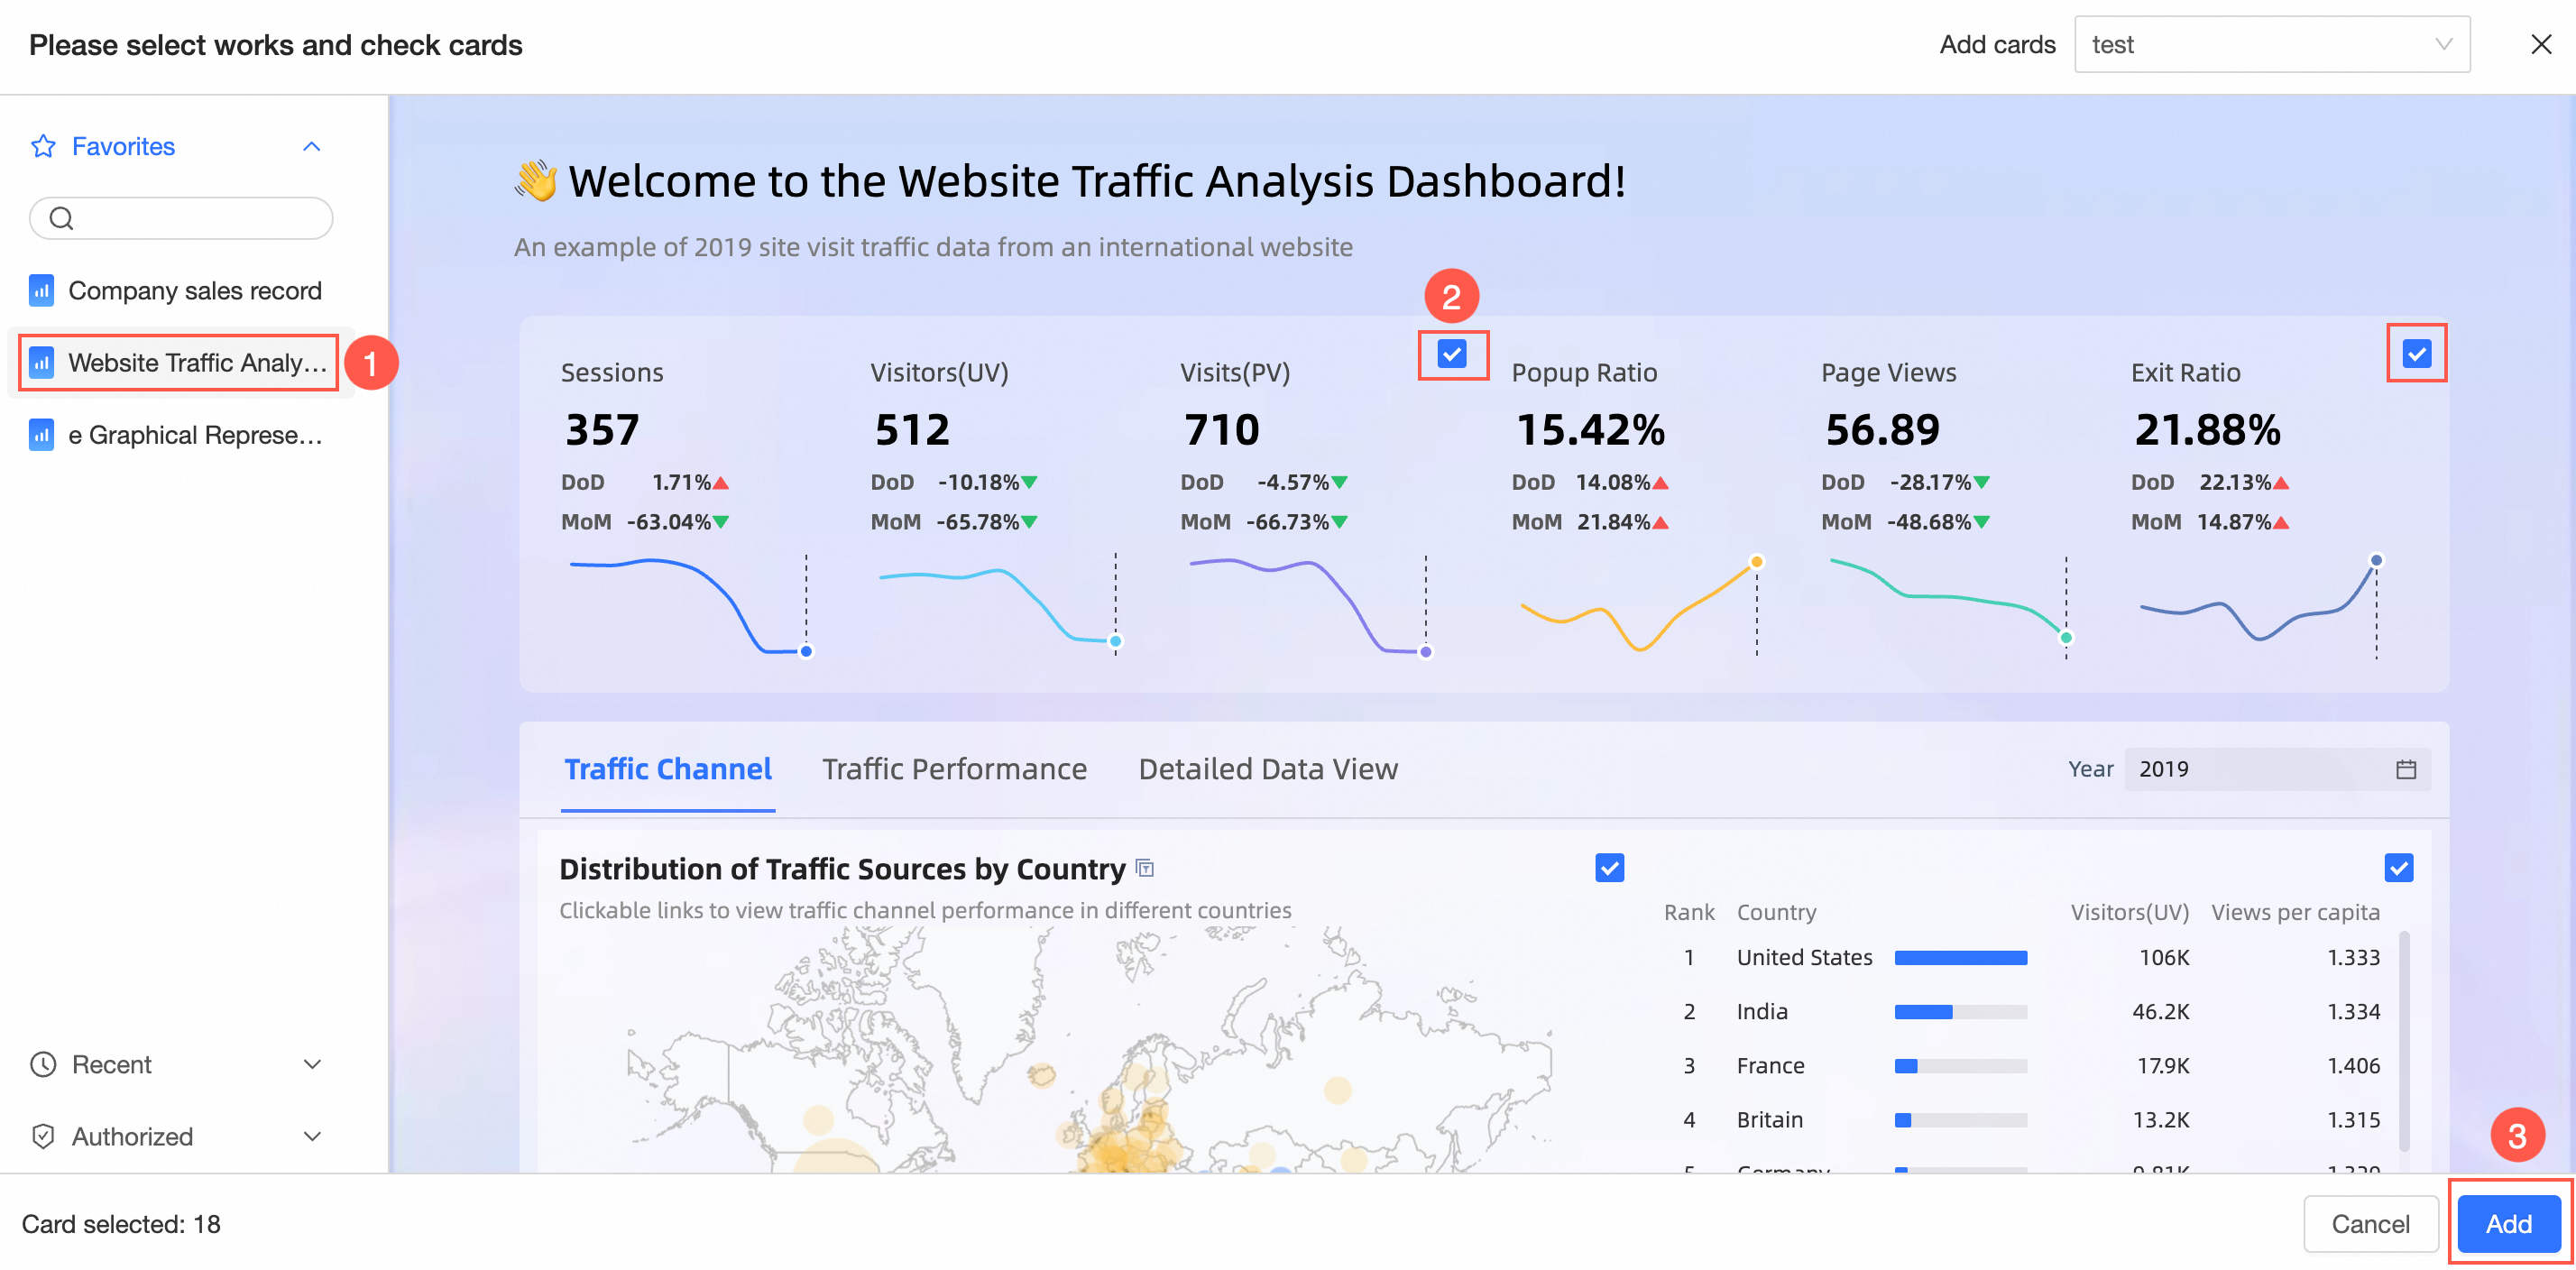
Click Add Card and follow the steps in the diagram to select dashboards or dashboards within the BI portal, check the desired cards, and click Add.
Add cards from the dashboard preview page.
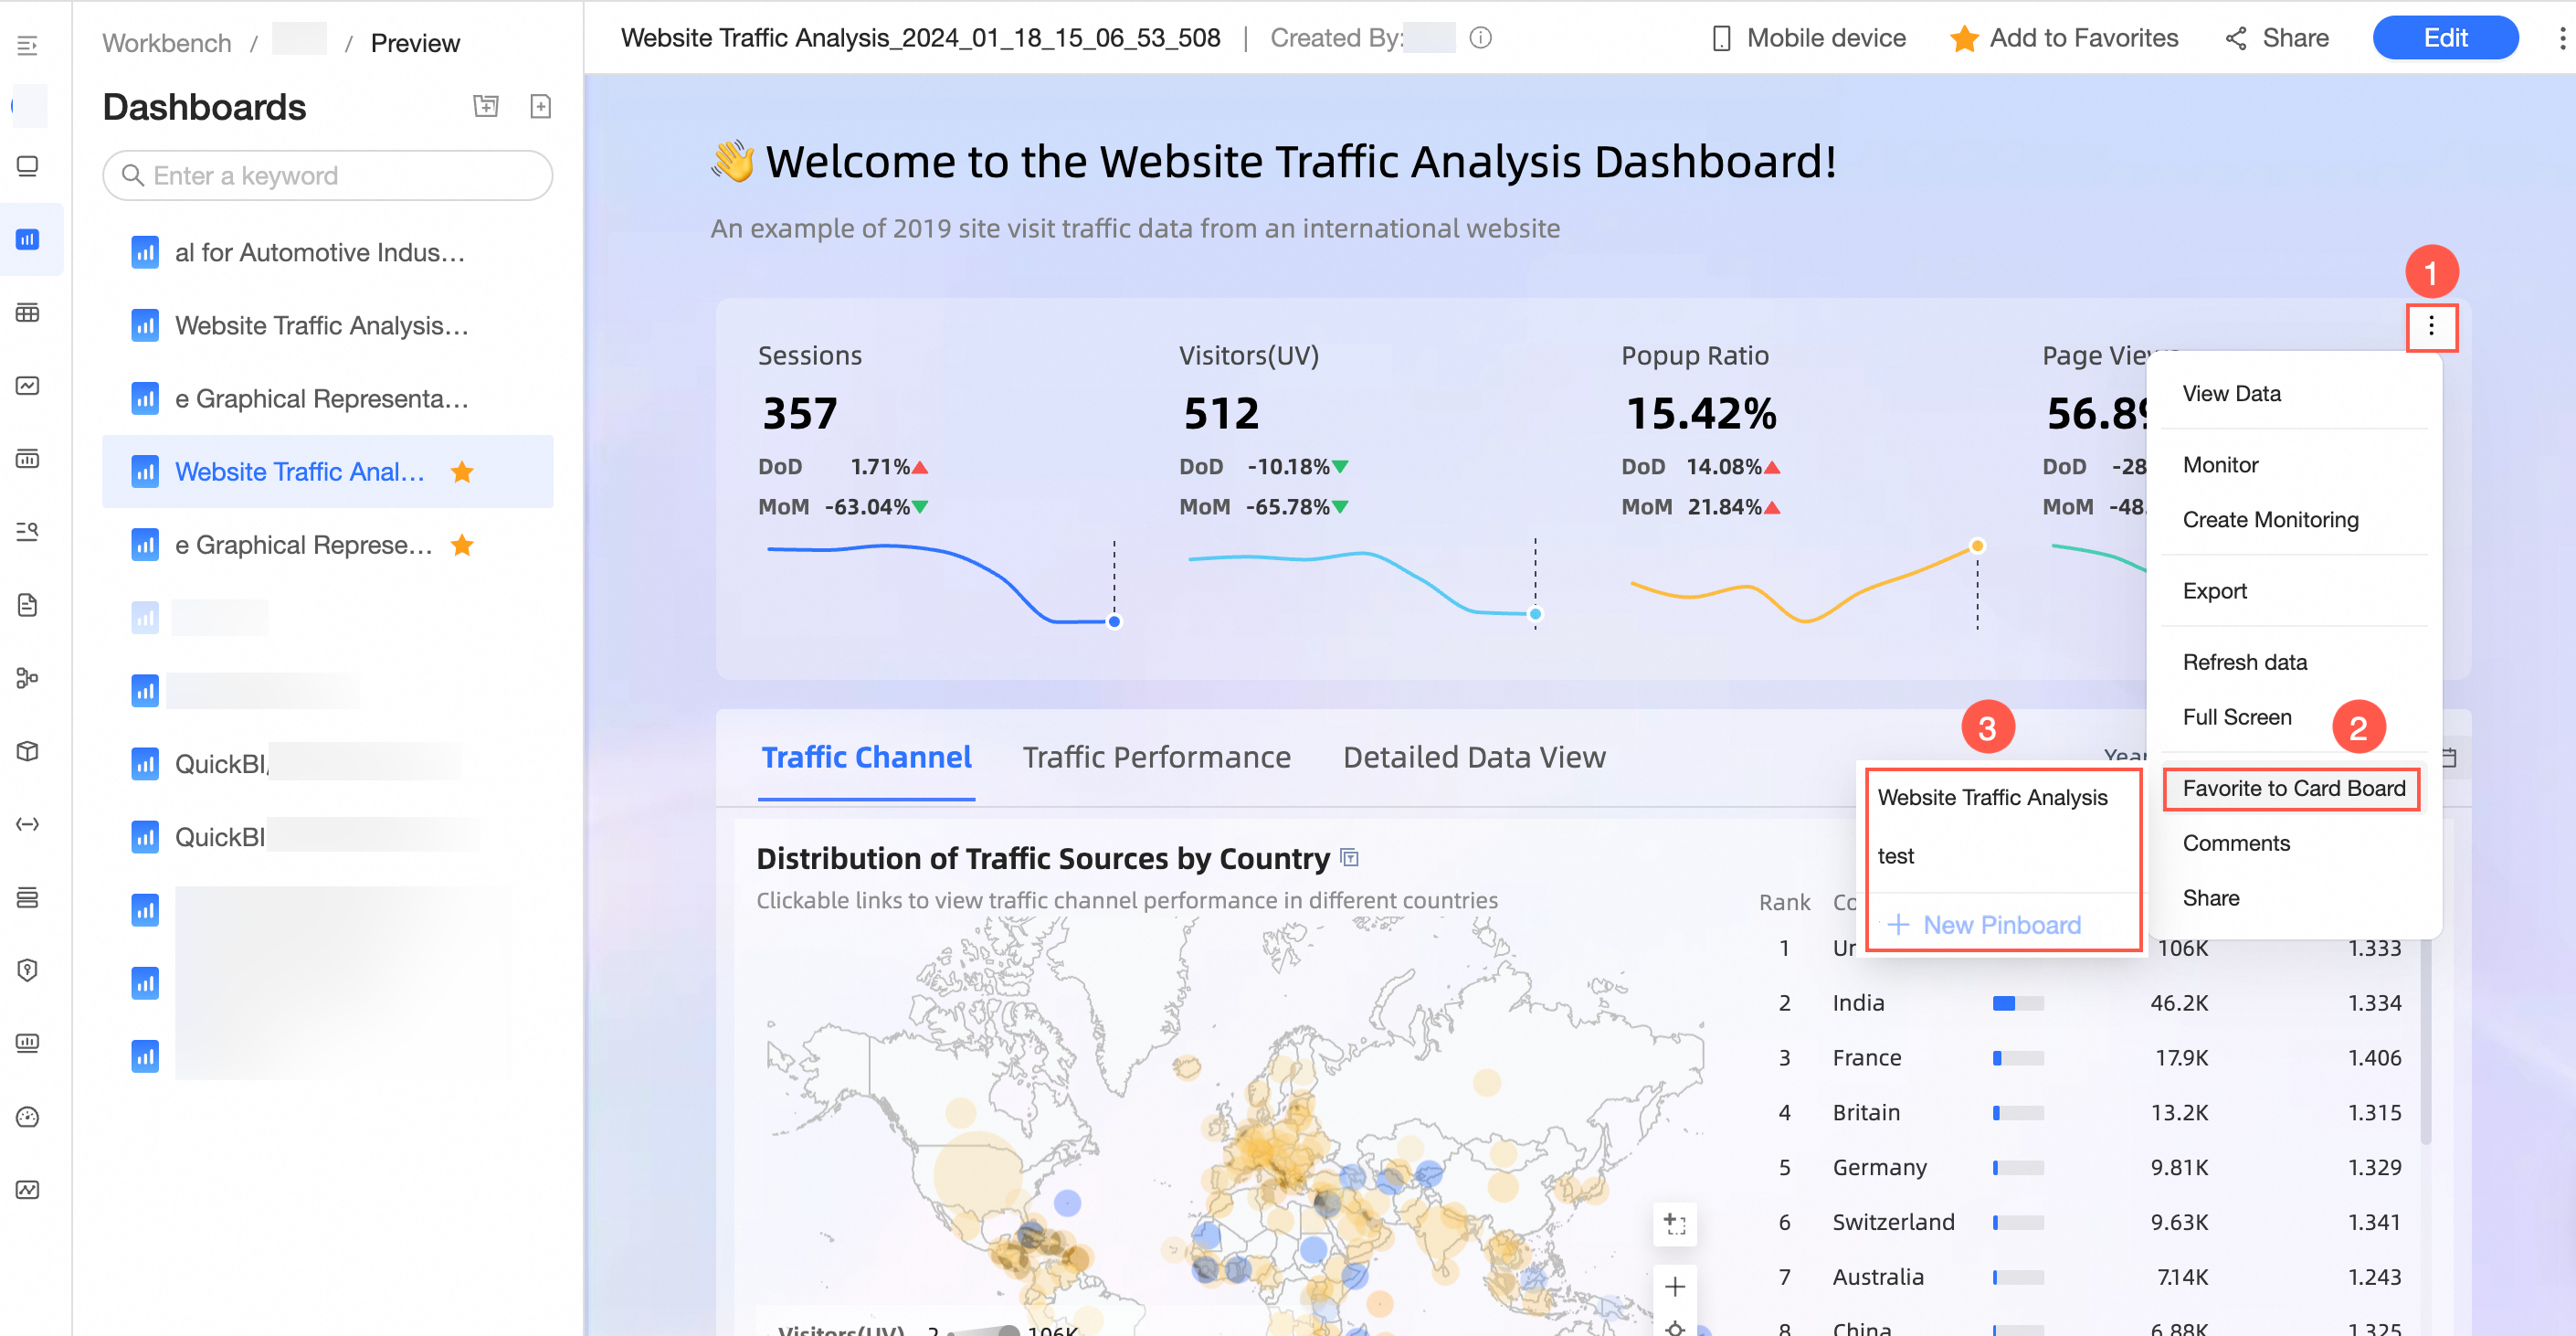
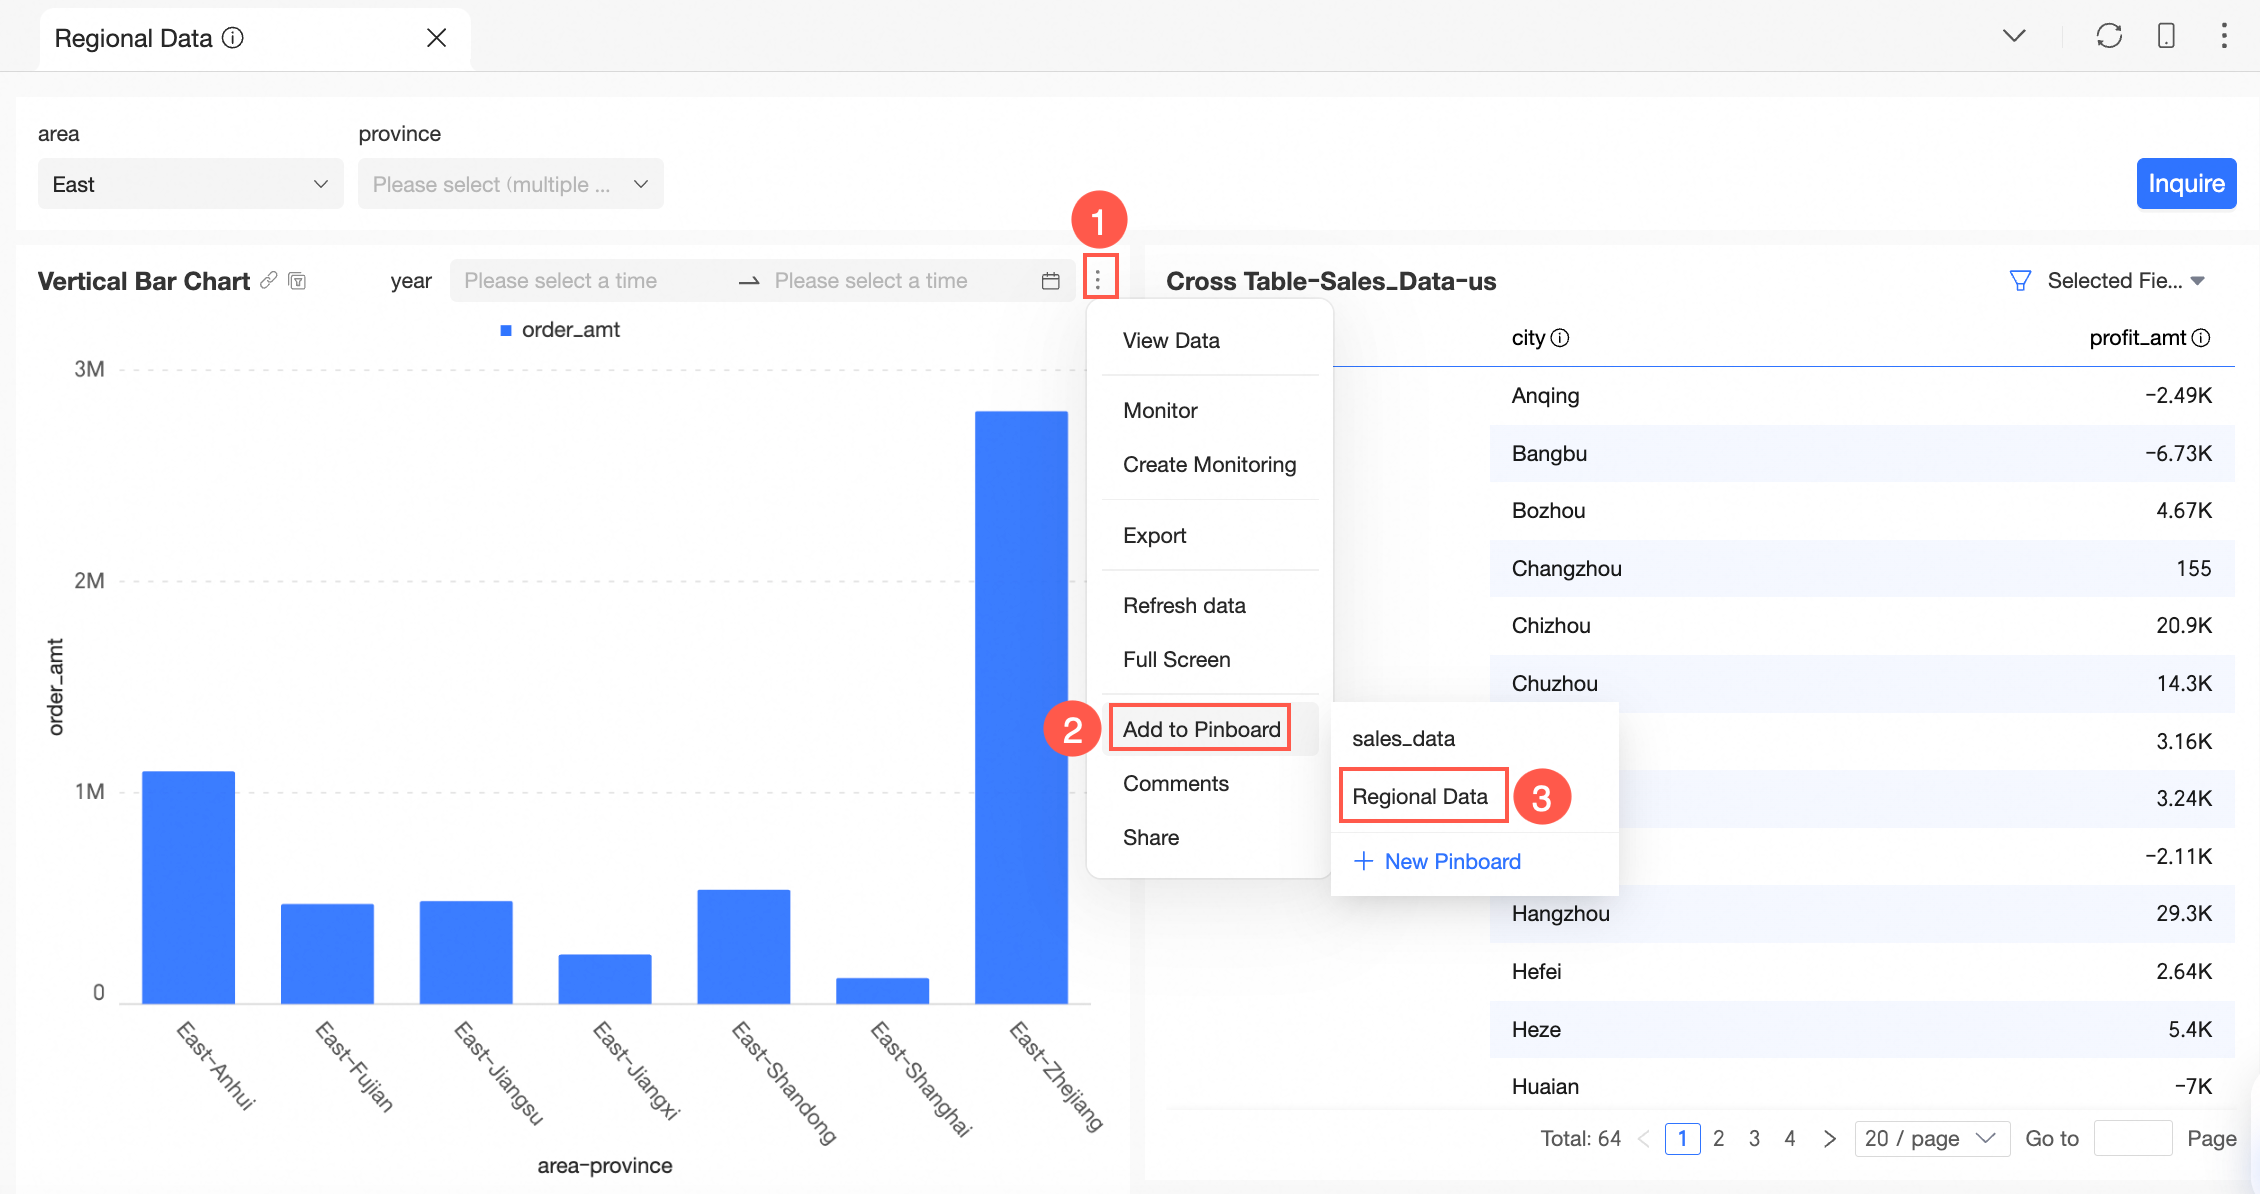
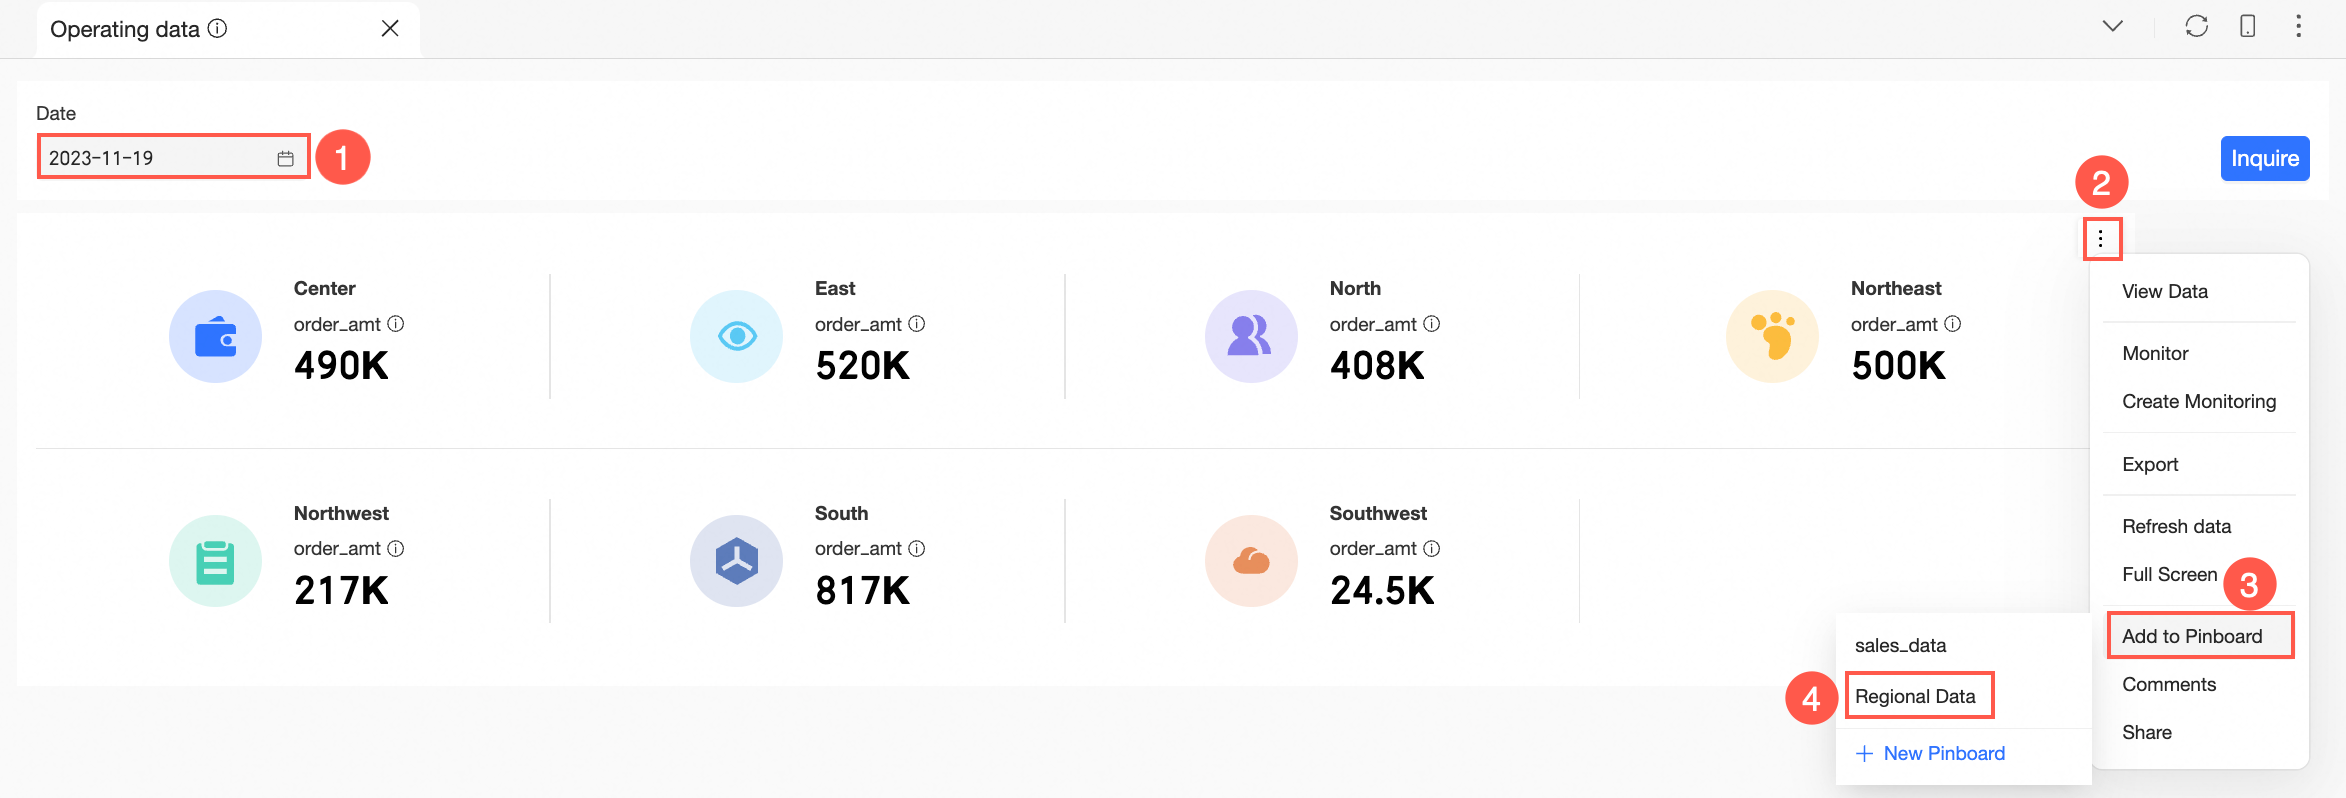
On the dashboard preview page, follow the steps in the diagram to add cards to the Pinboard. You can add to an existing Pinboard or create a new one.
Add cards from the BI portal.
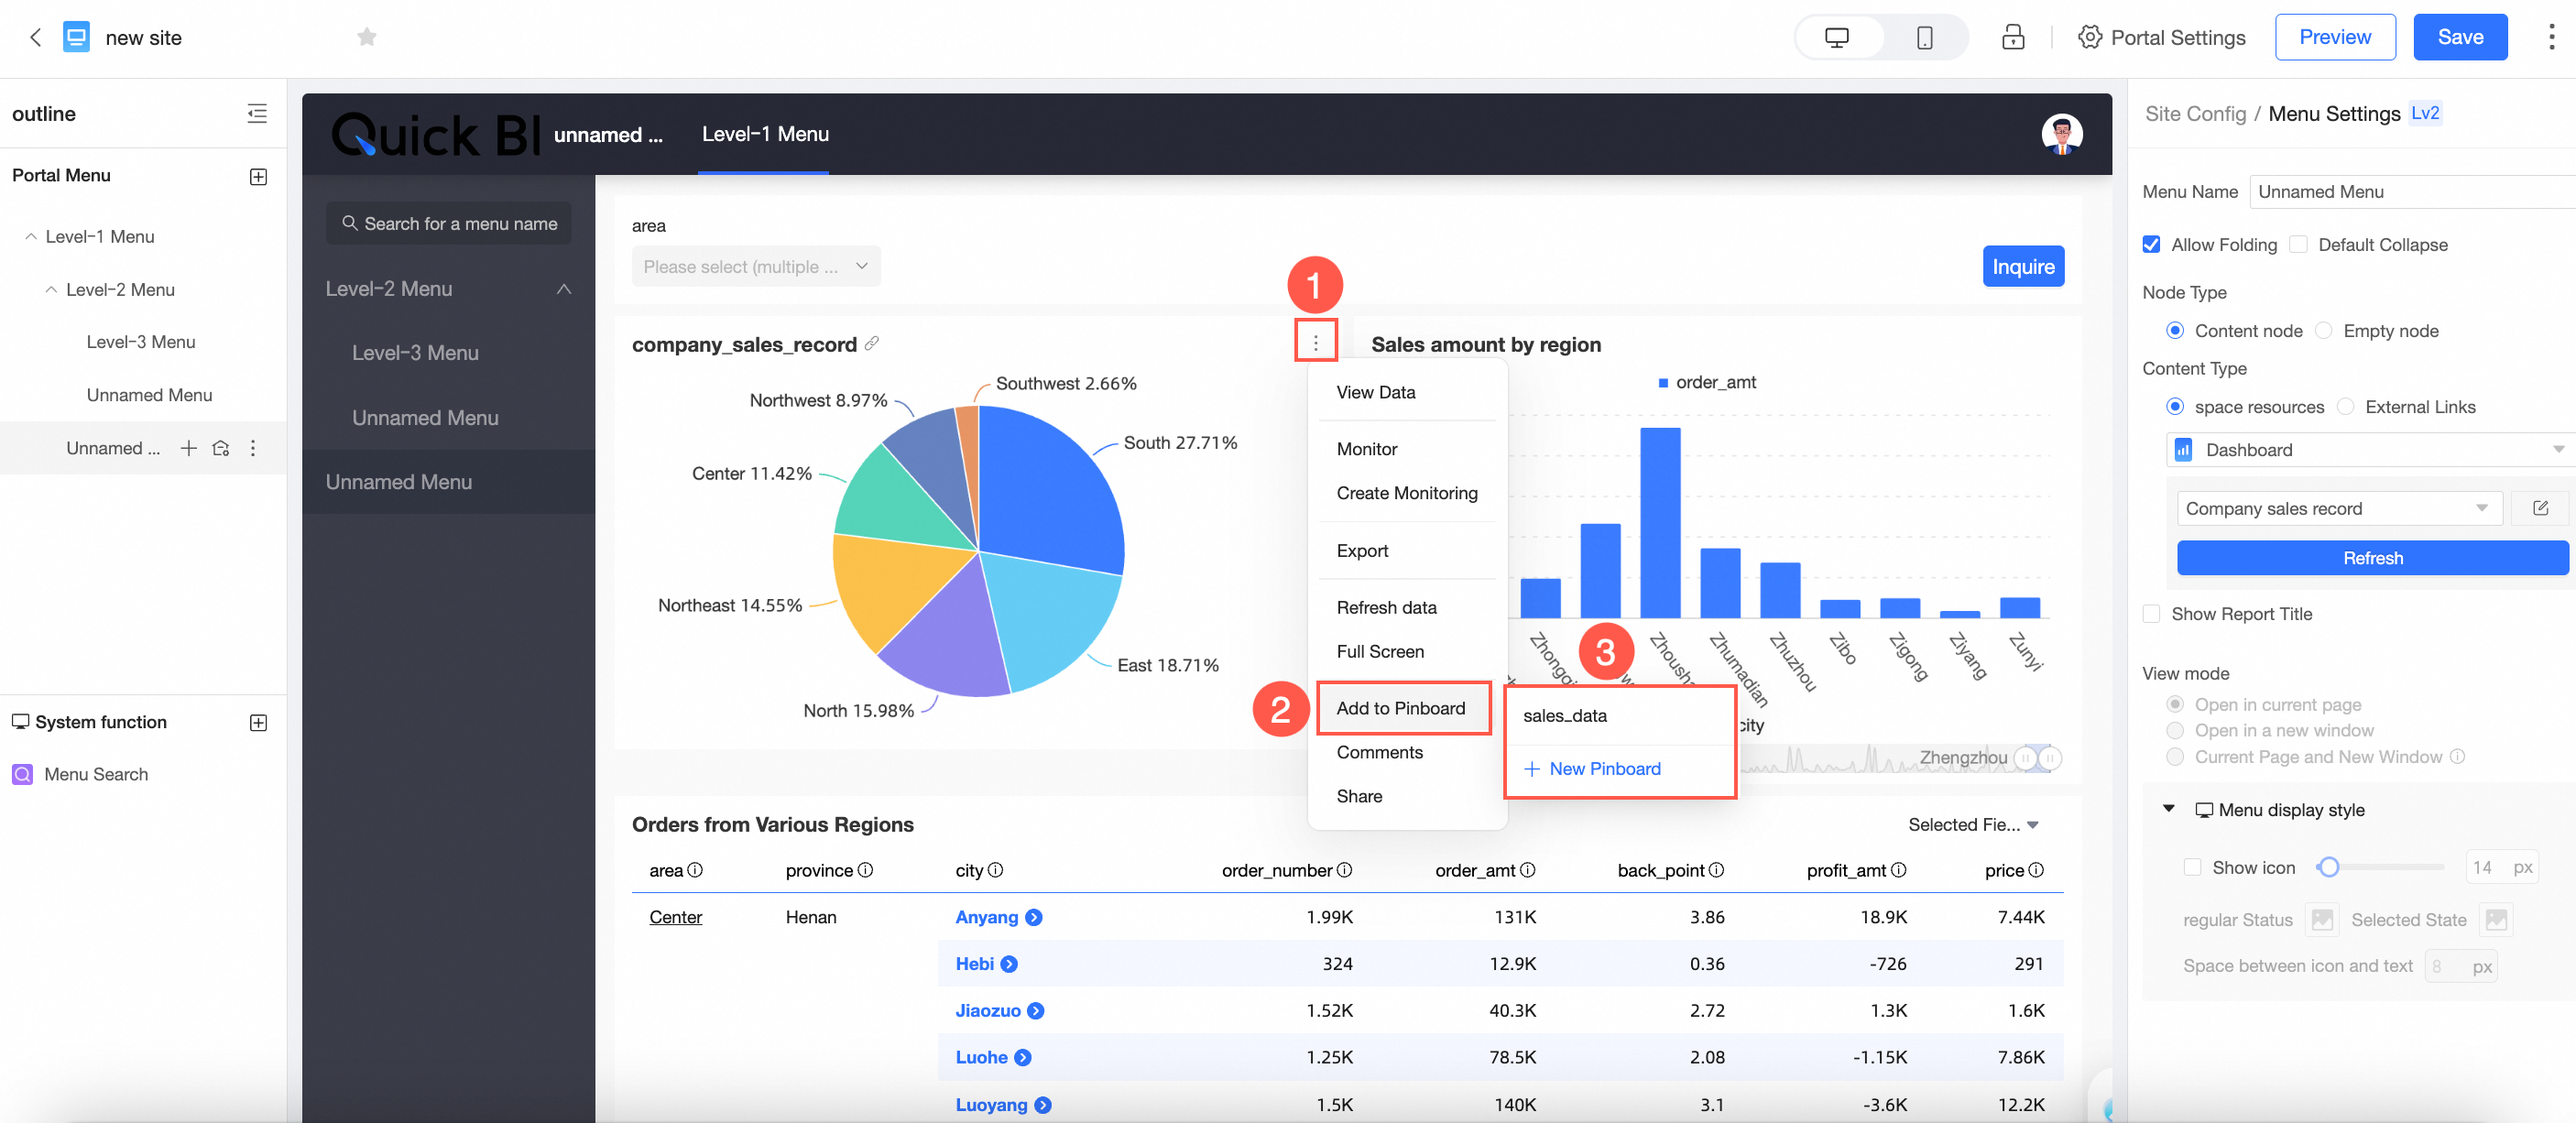
In the BI portal preview page, follow the steps in the diagram to add cards to the Pinboard. You can add to an existing Pinboard or create a new one.
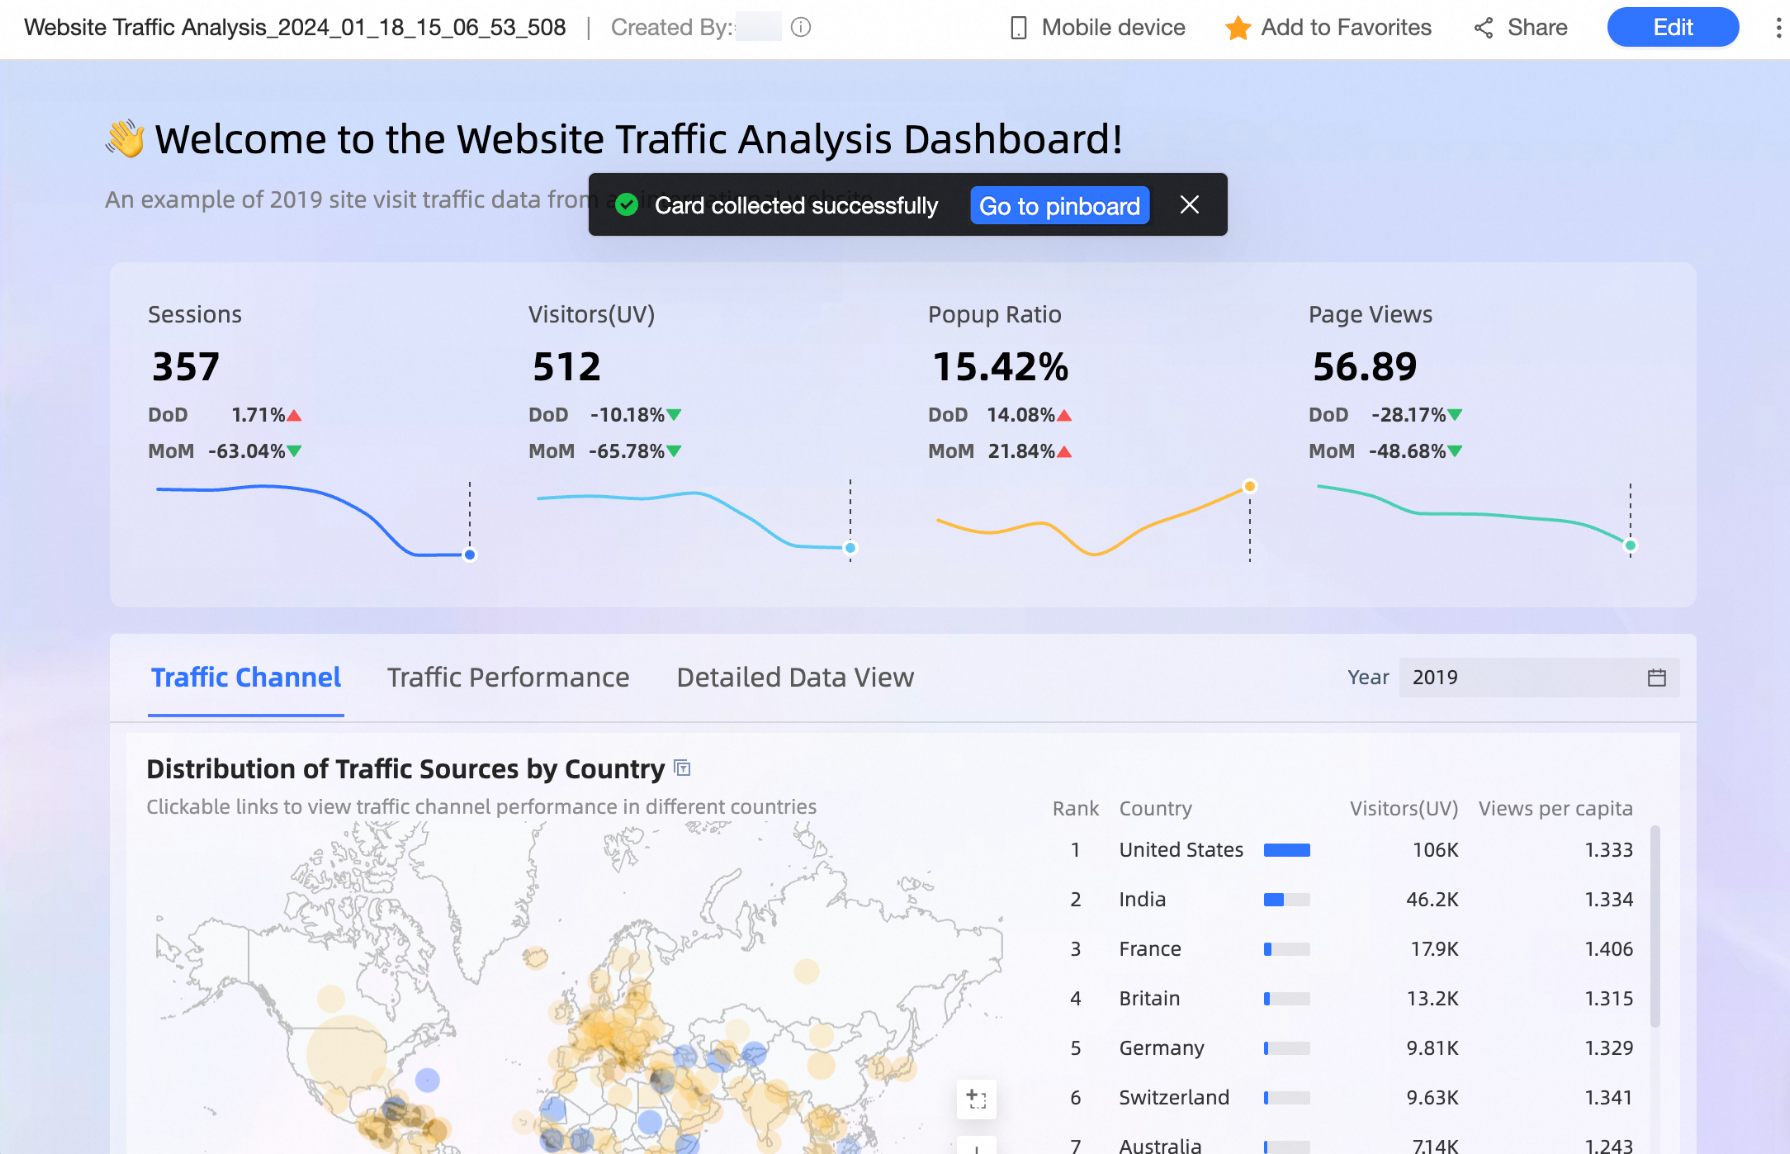
NoteAfter adding, the data will synchronize with the source card, and the chart style will automatically adjust to fit the Pinboard's layout and style.
Click Go to Dashboard to navigate to the corresponding Pinboard interface.
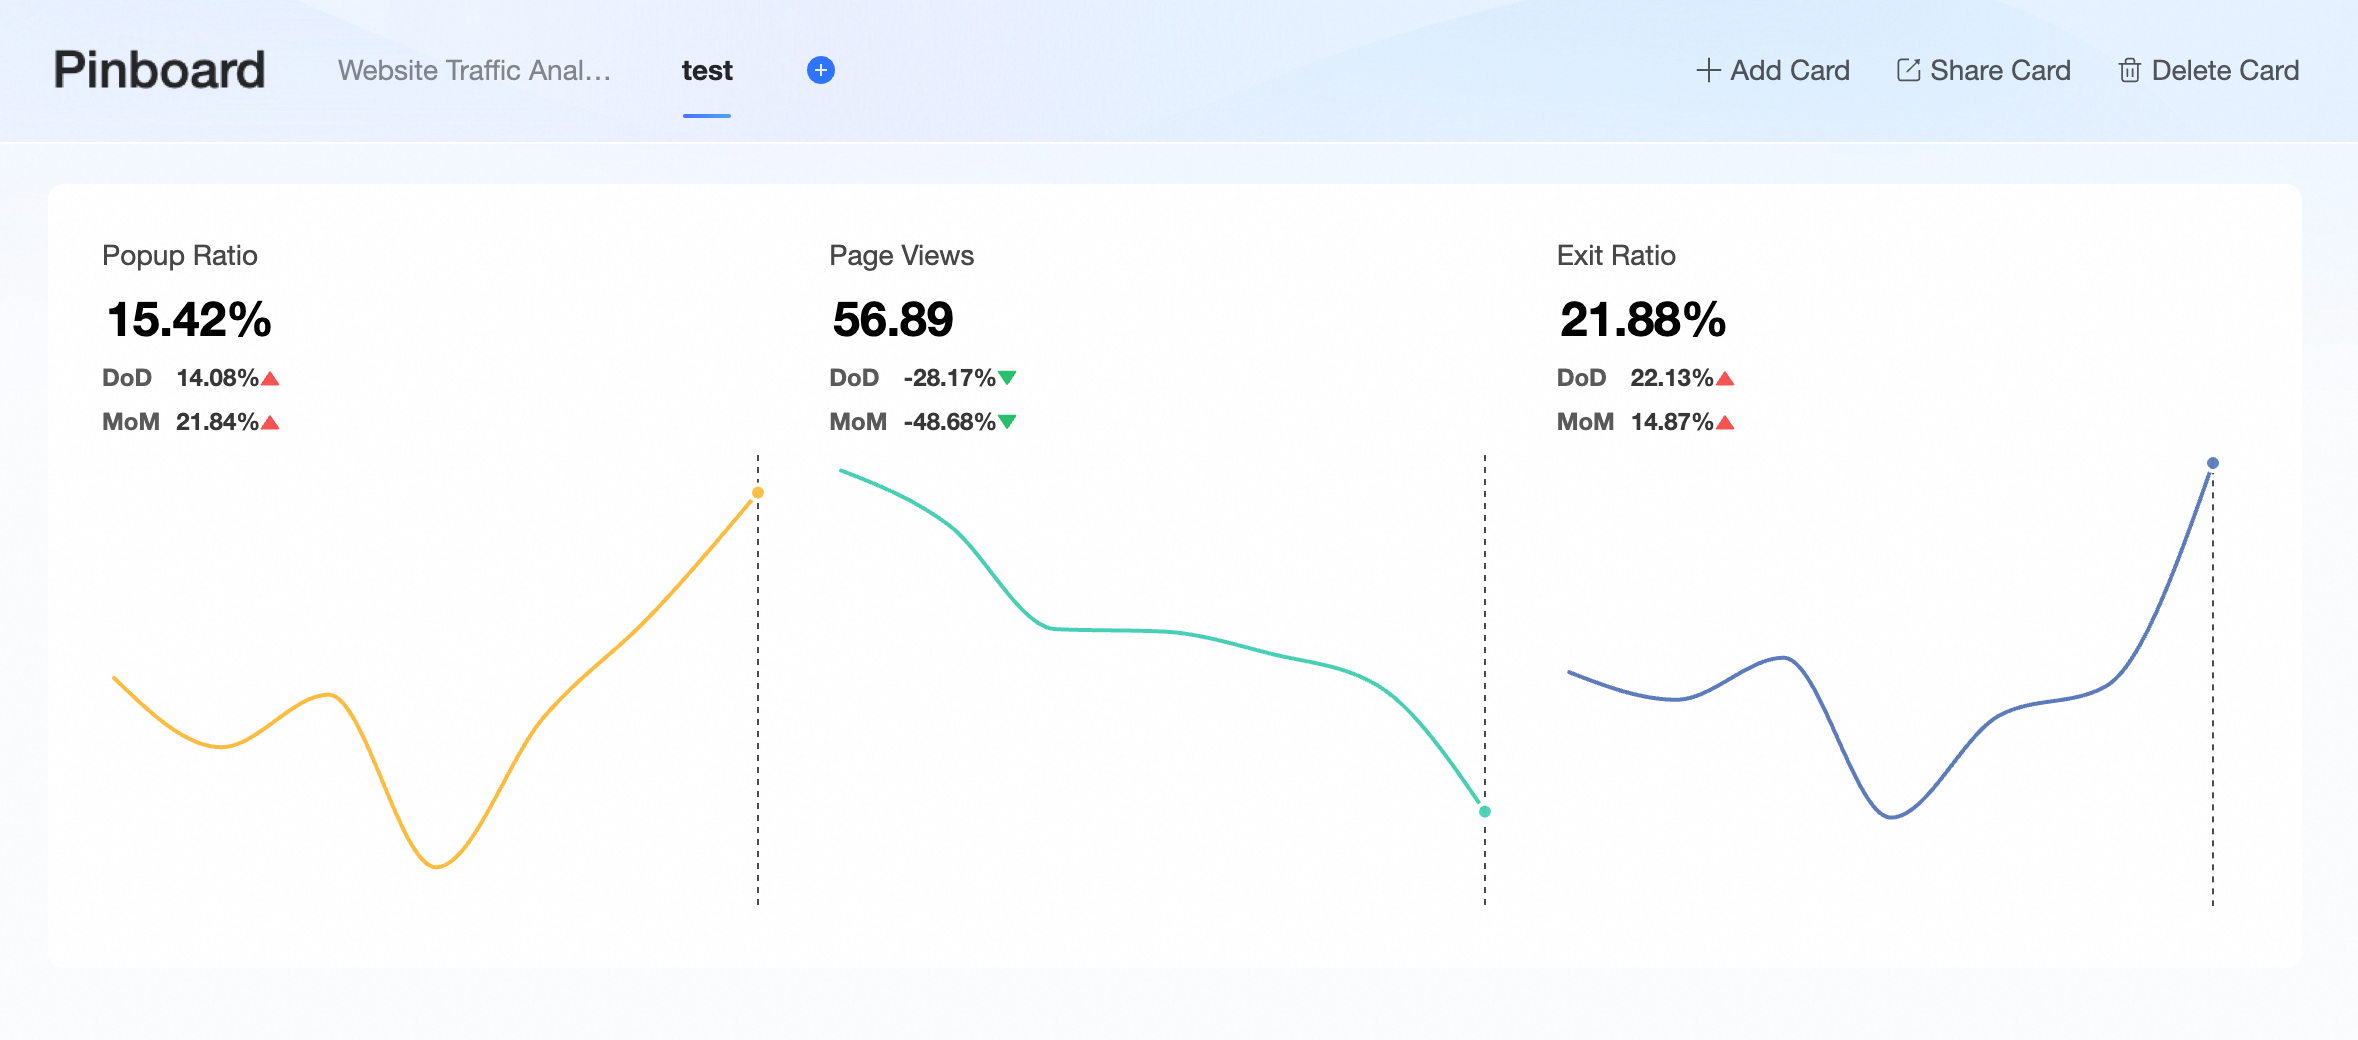
Now, you can view the added cards within the Pinboard interface.
Card operations
Card Layout
You can drag cards to adjust their positions and sizes when managing multiple cards.
Card Renaming
Double-click the card title to rename it.
Additional card operations include the following:
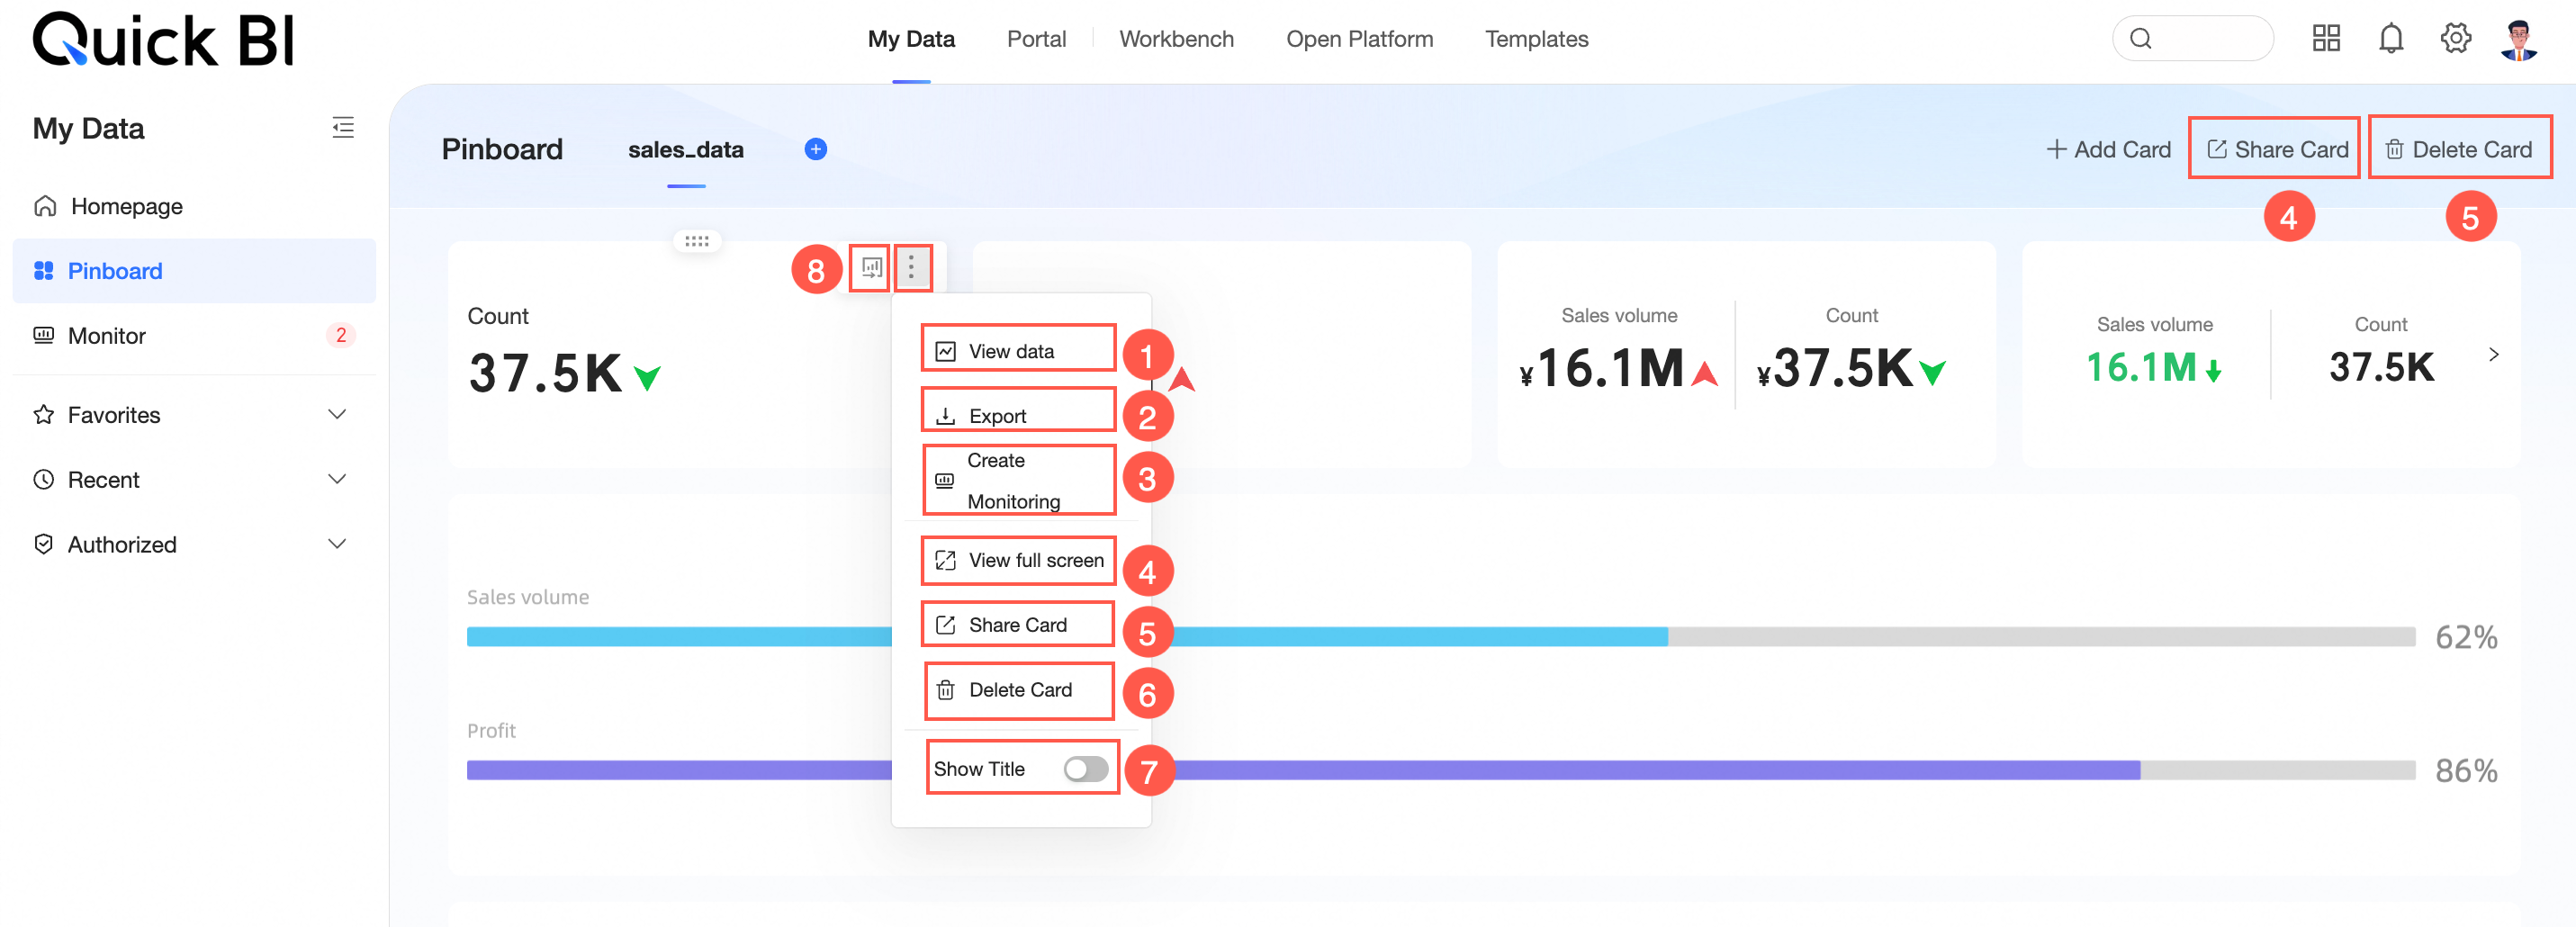
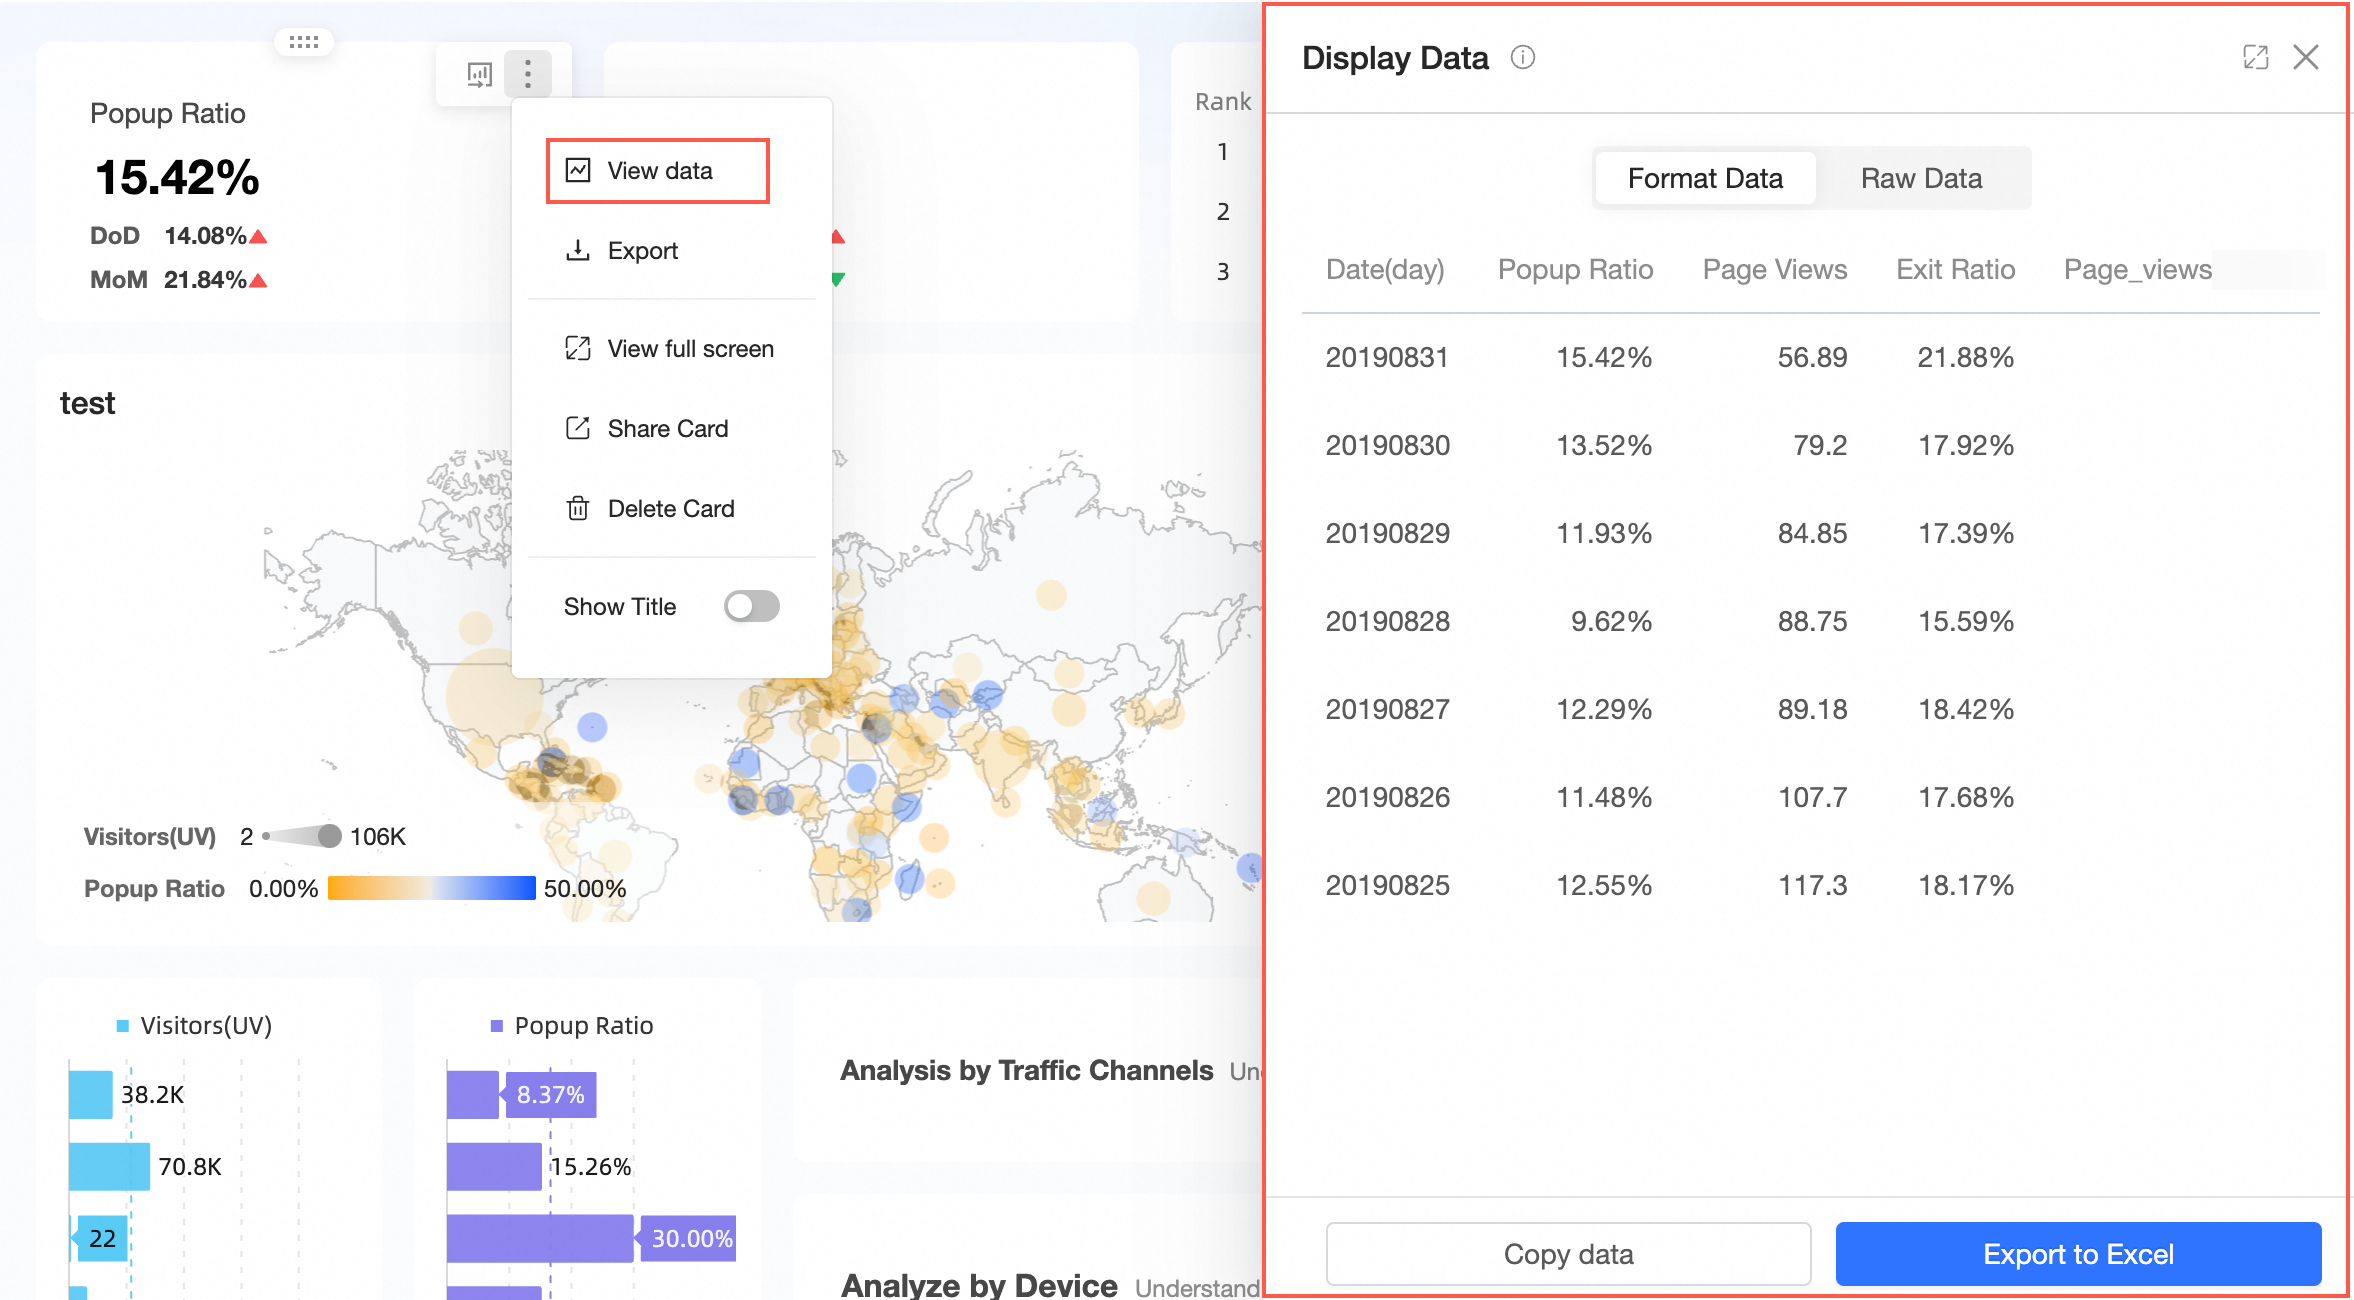
① View Data
Supports viewing both formatted and raw data, with options to copy data and export to Excel.
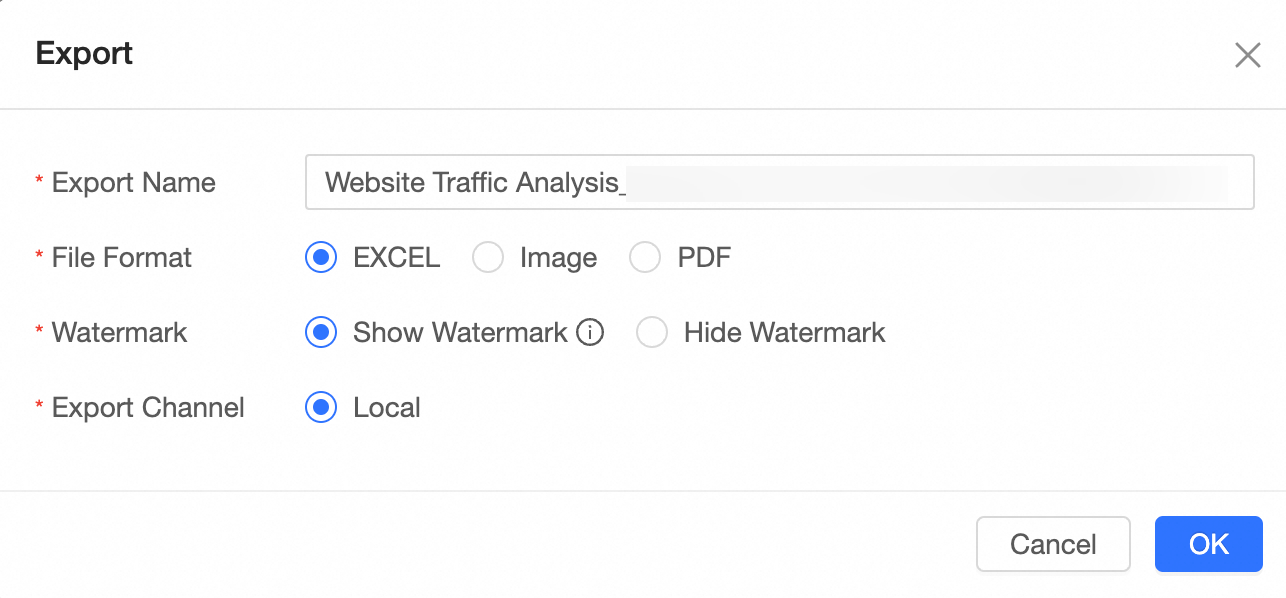
② Export
Allows exporting to Excel, Image, or PDF formats. When exporting to Excel, you can choose to display or hide the watermark.
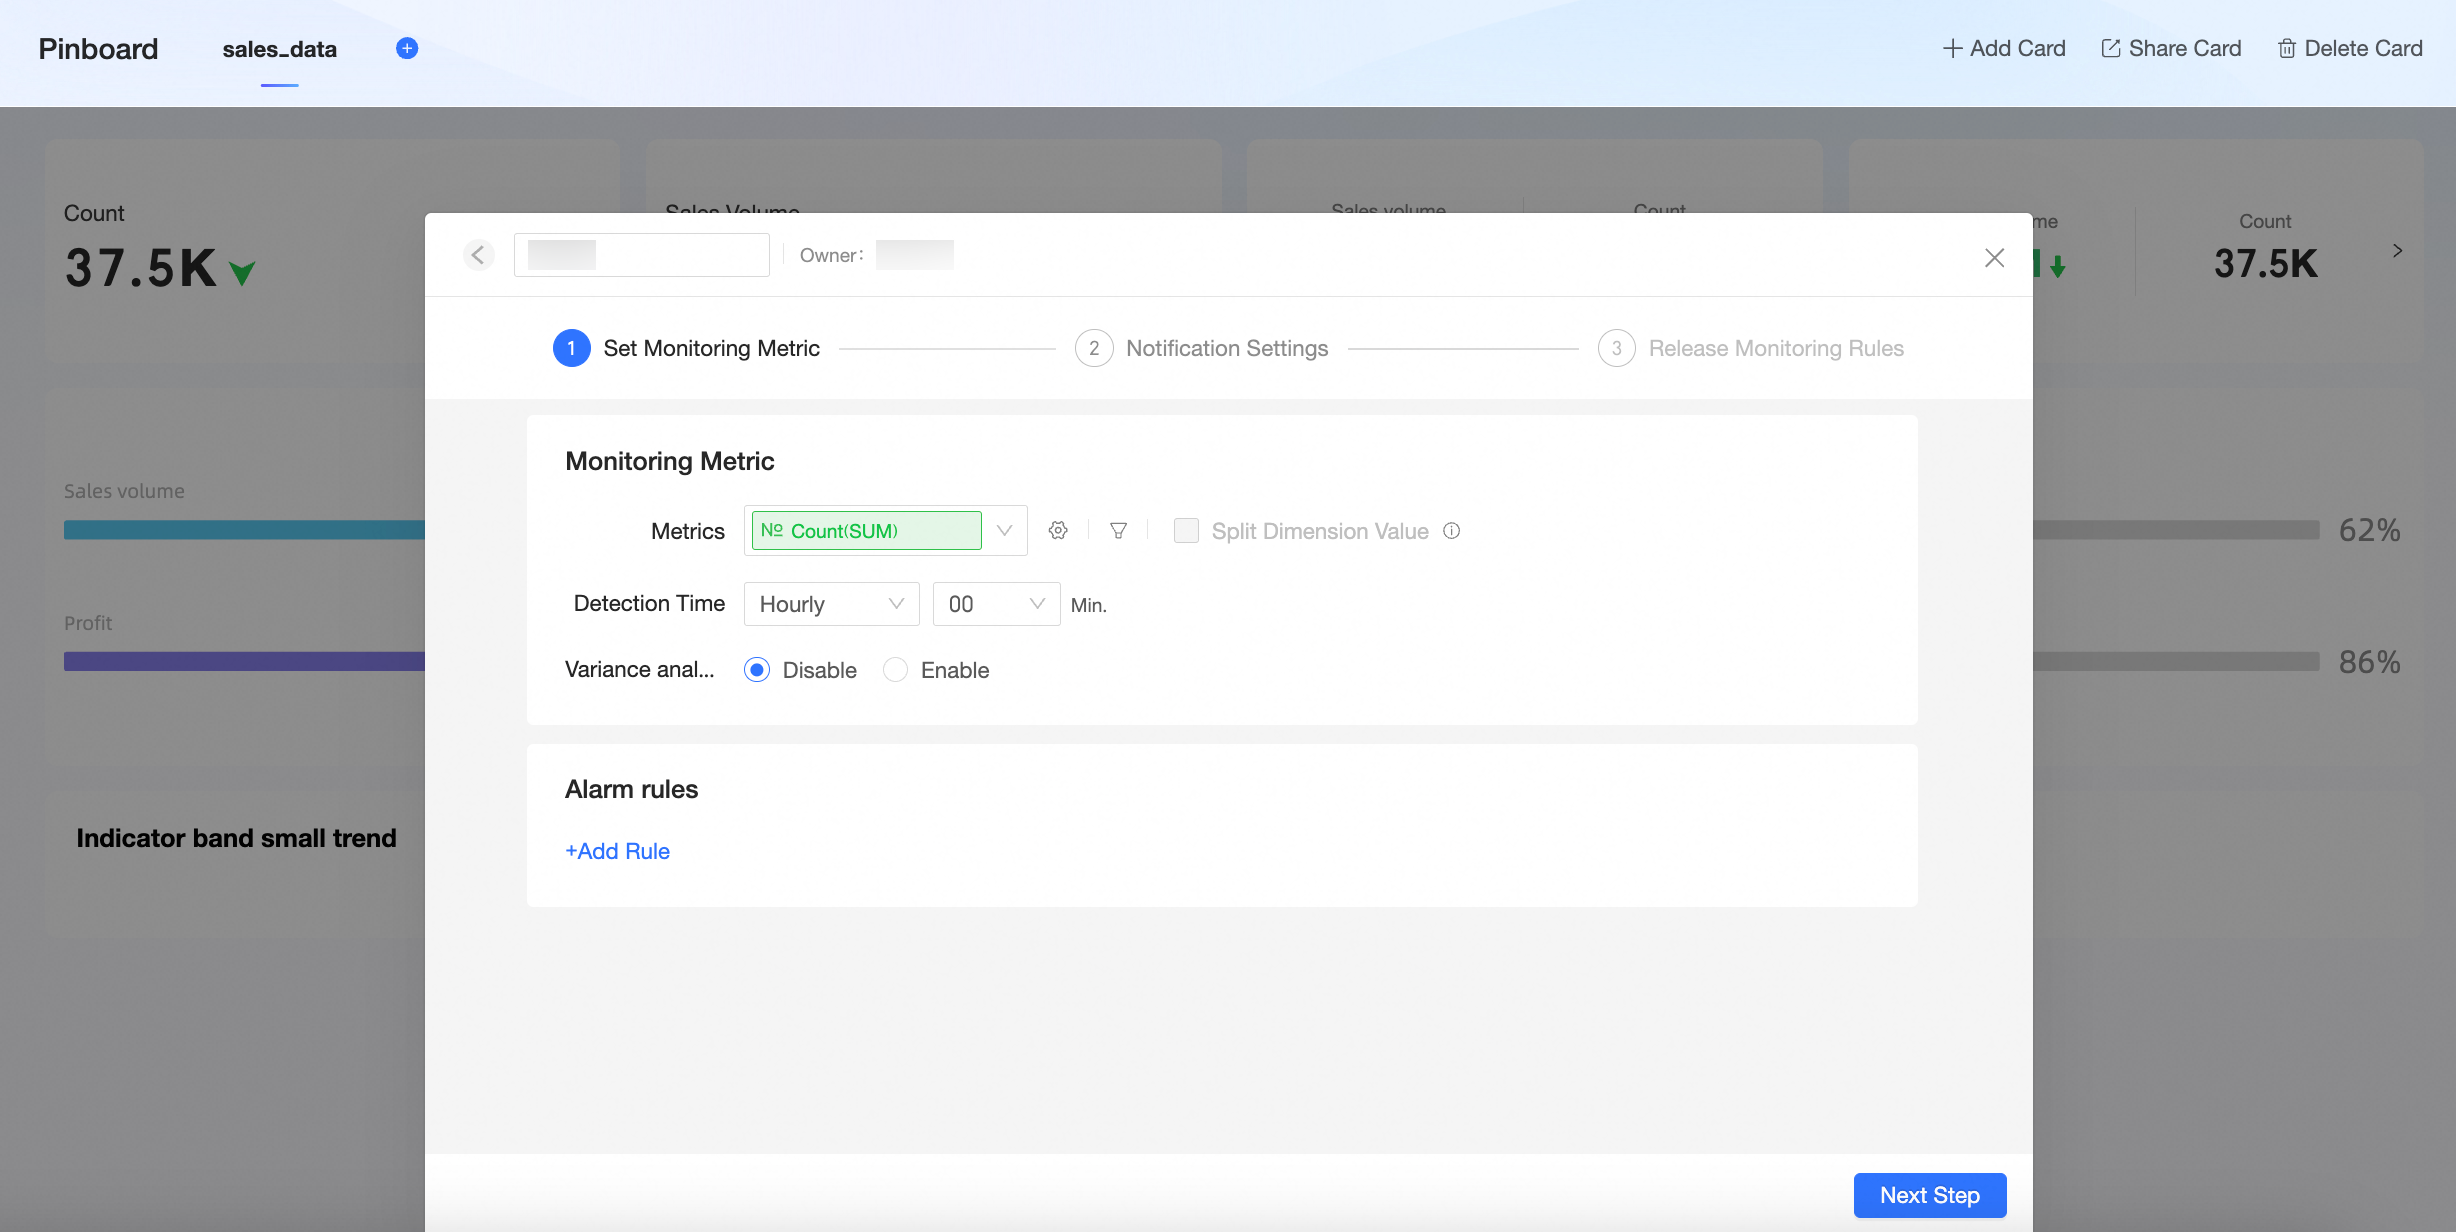
③ Create Monitoring
You can set up monitoring for the card. For detailed instructions, please refer to Monitoring Indicators.
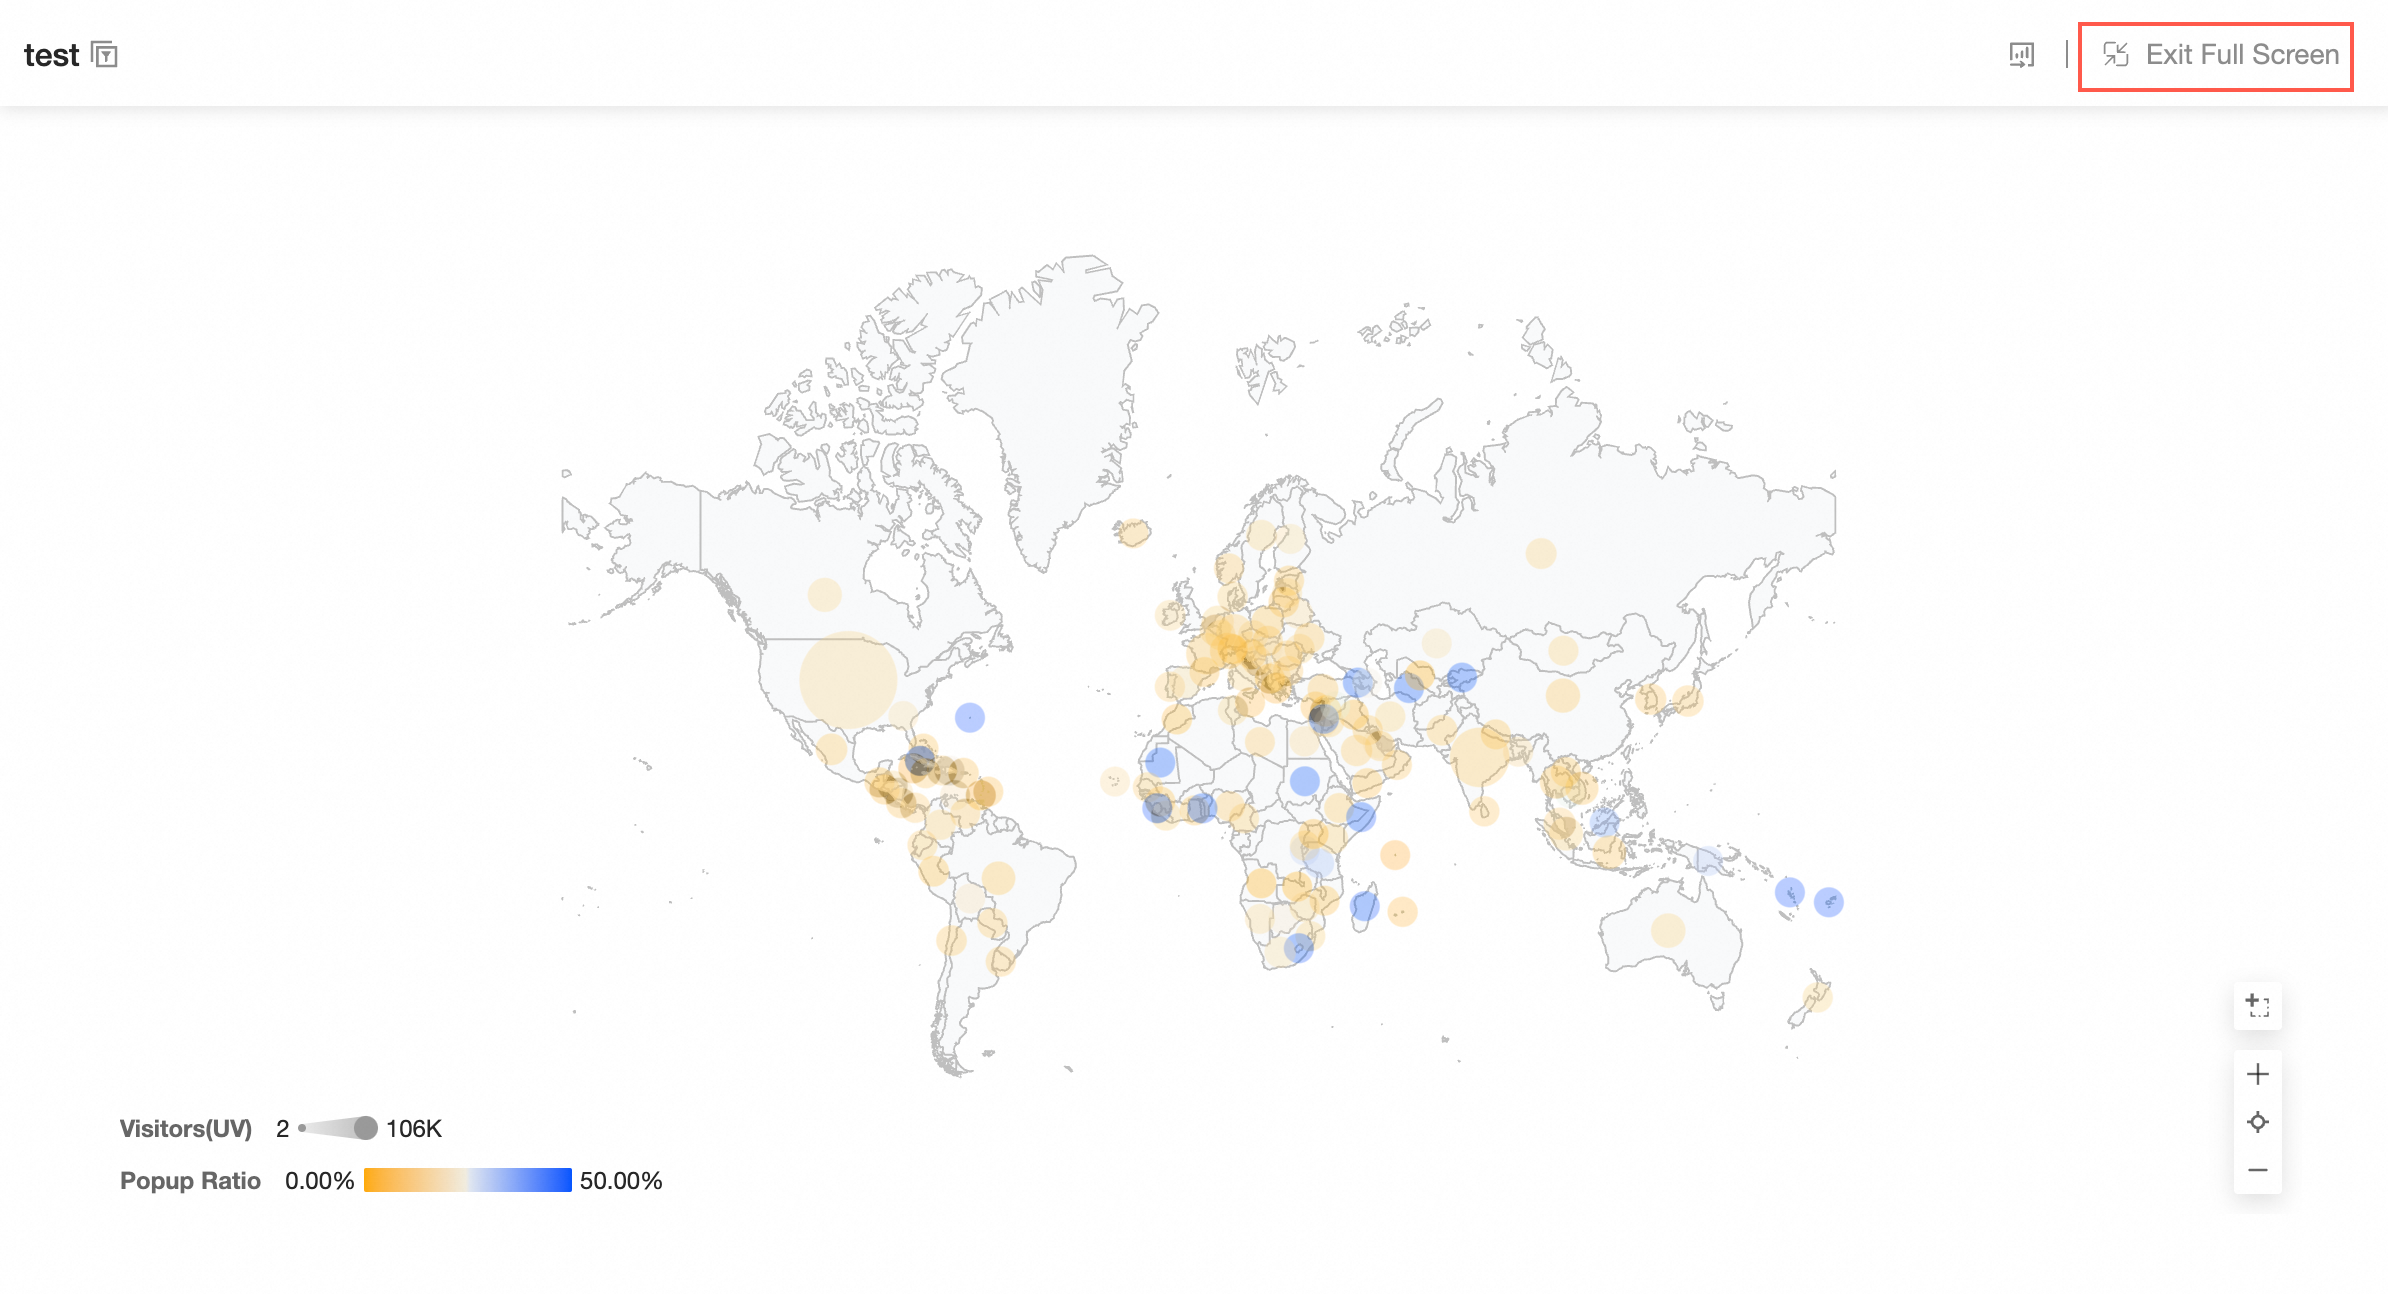
④ Full-Screen View
Enables full-screen viewing of the card. Click Exit Full Screen to return to the Pinboard.
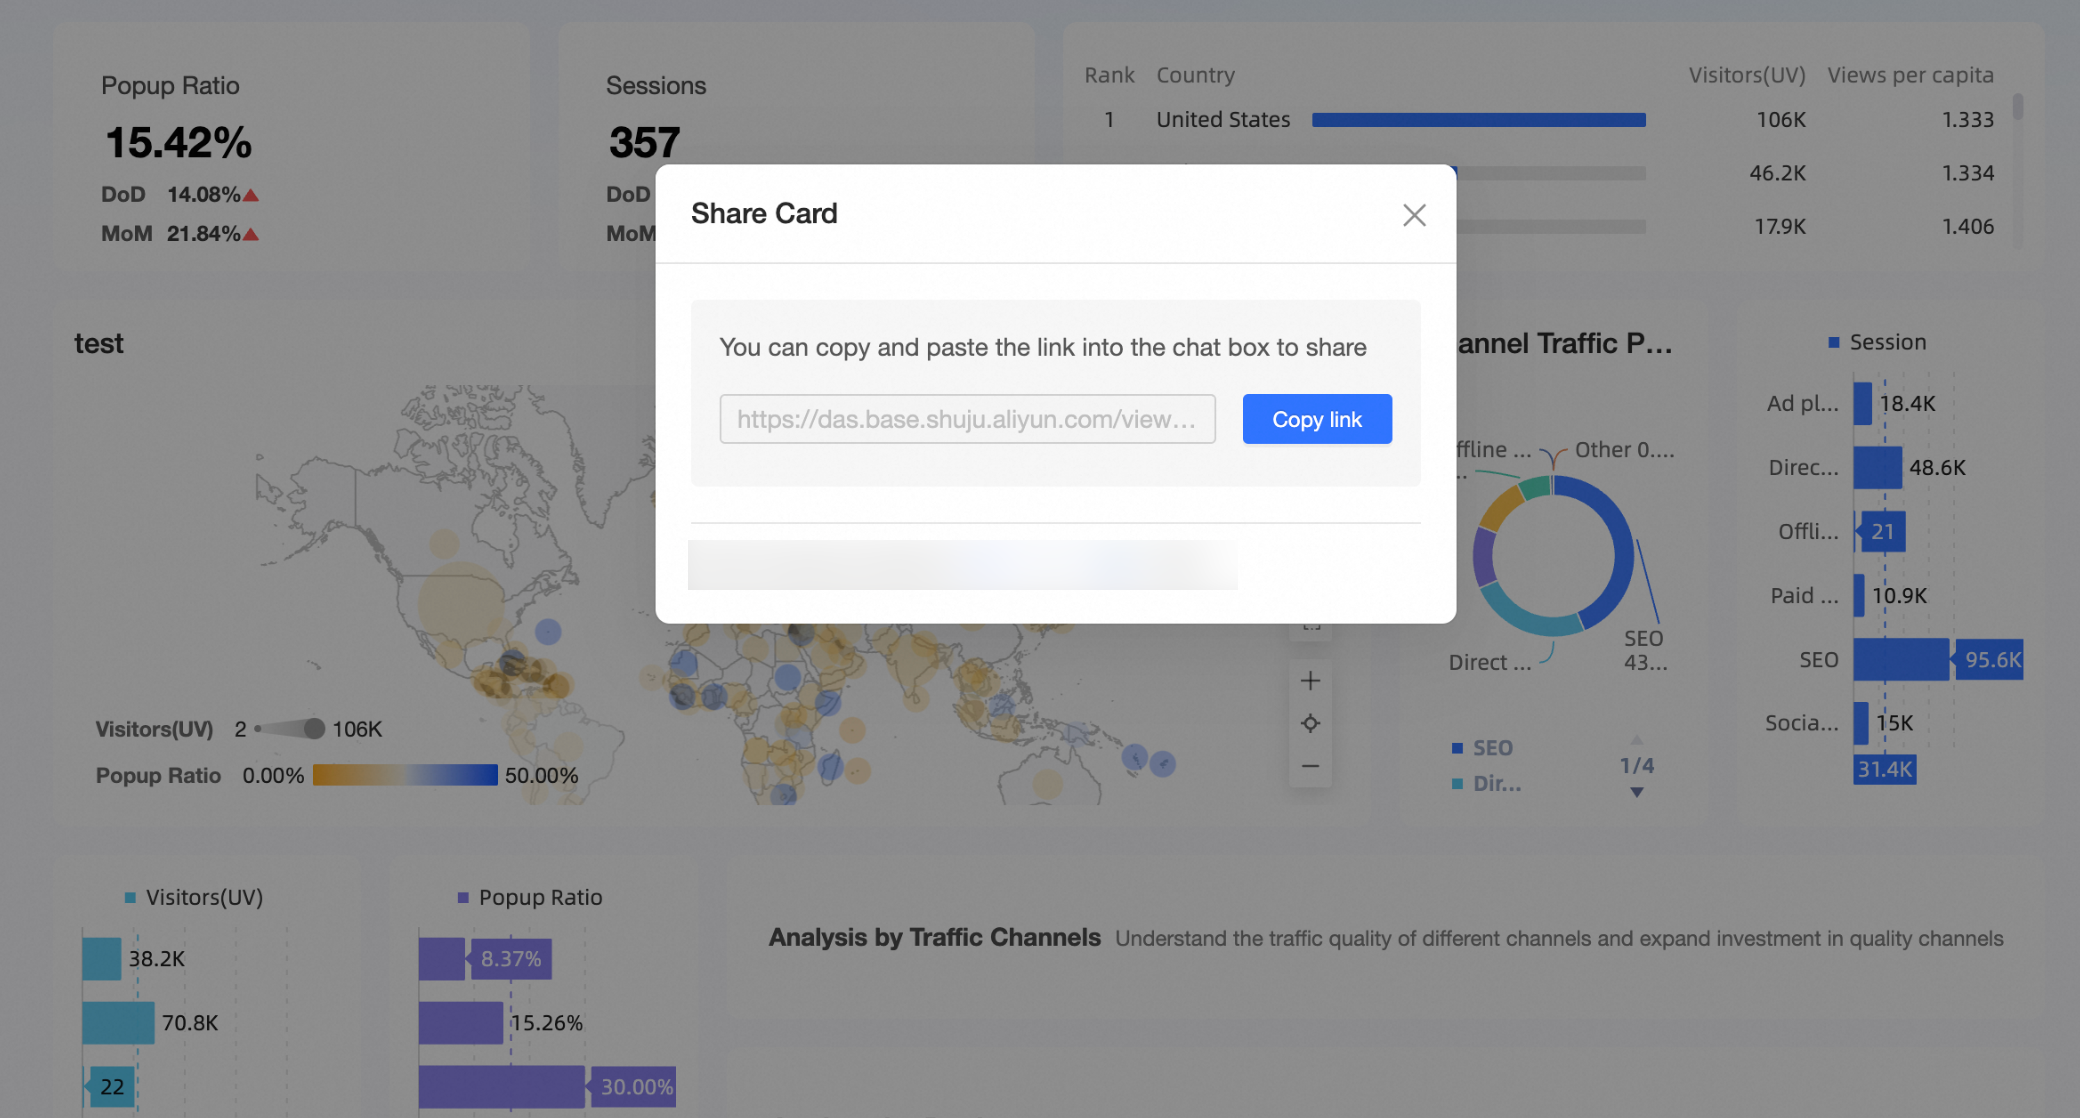
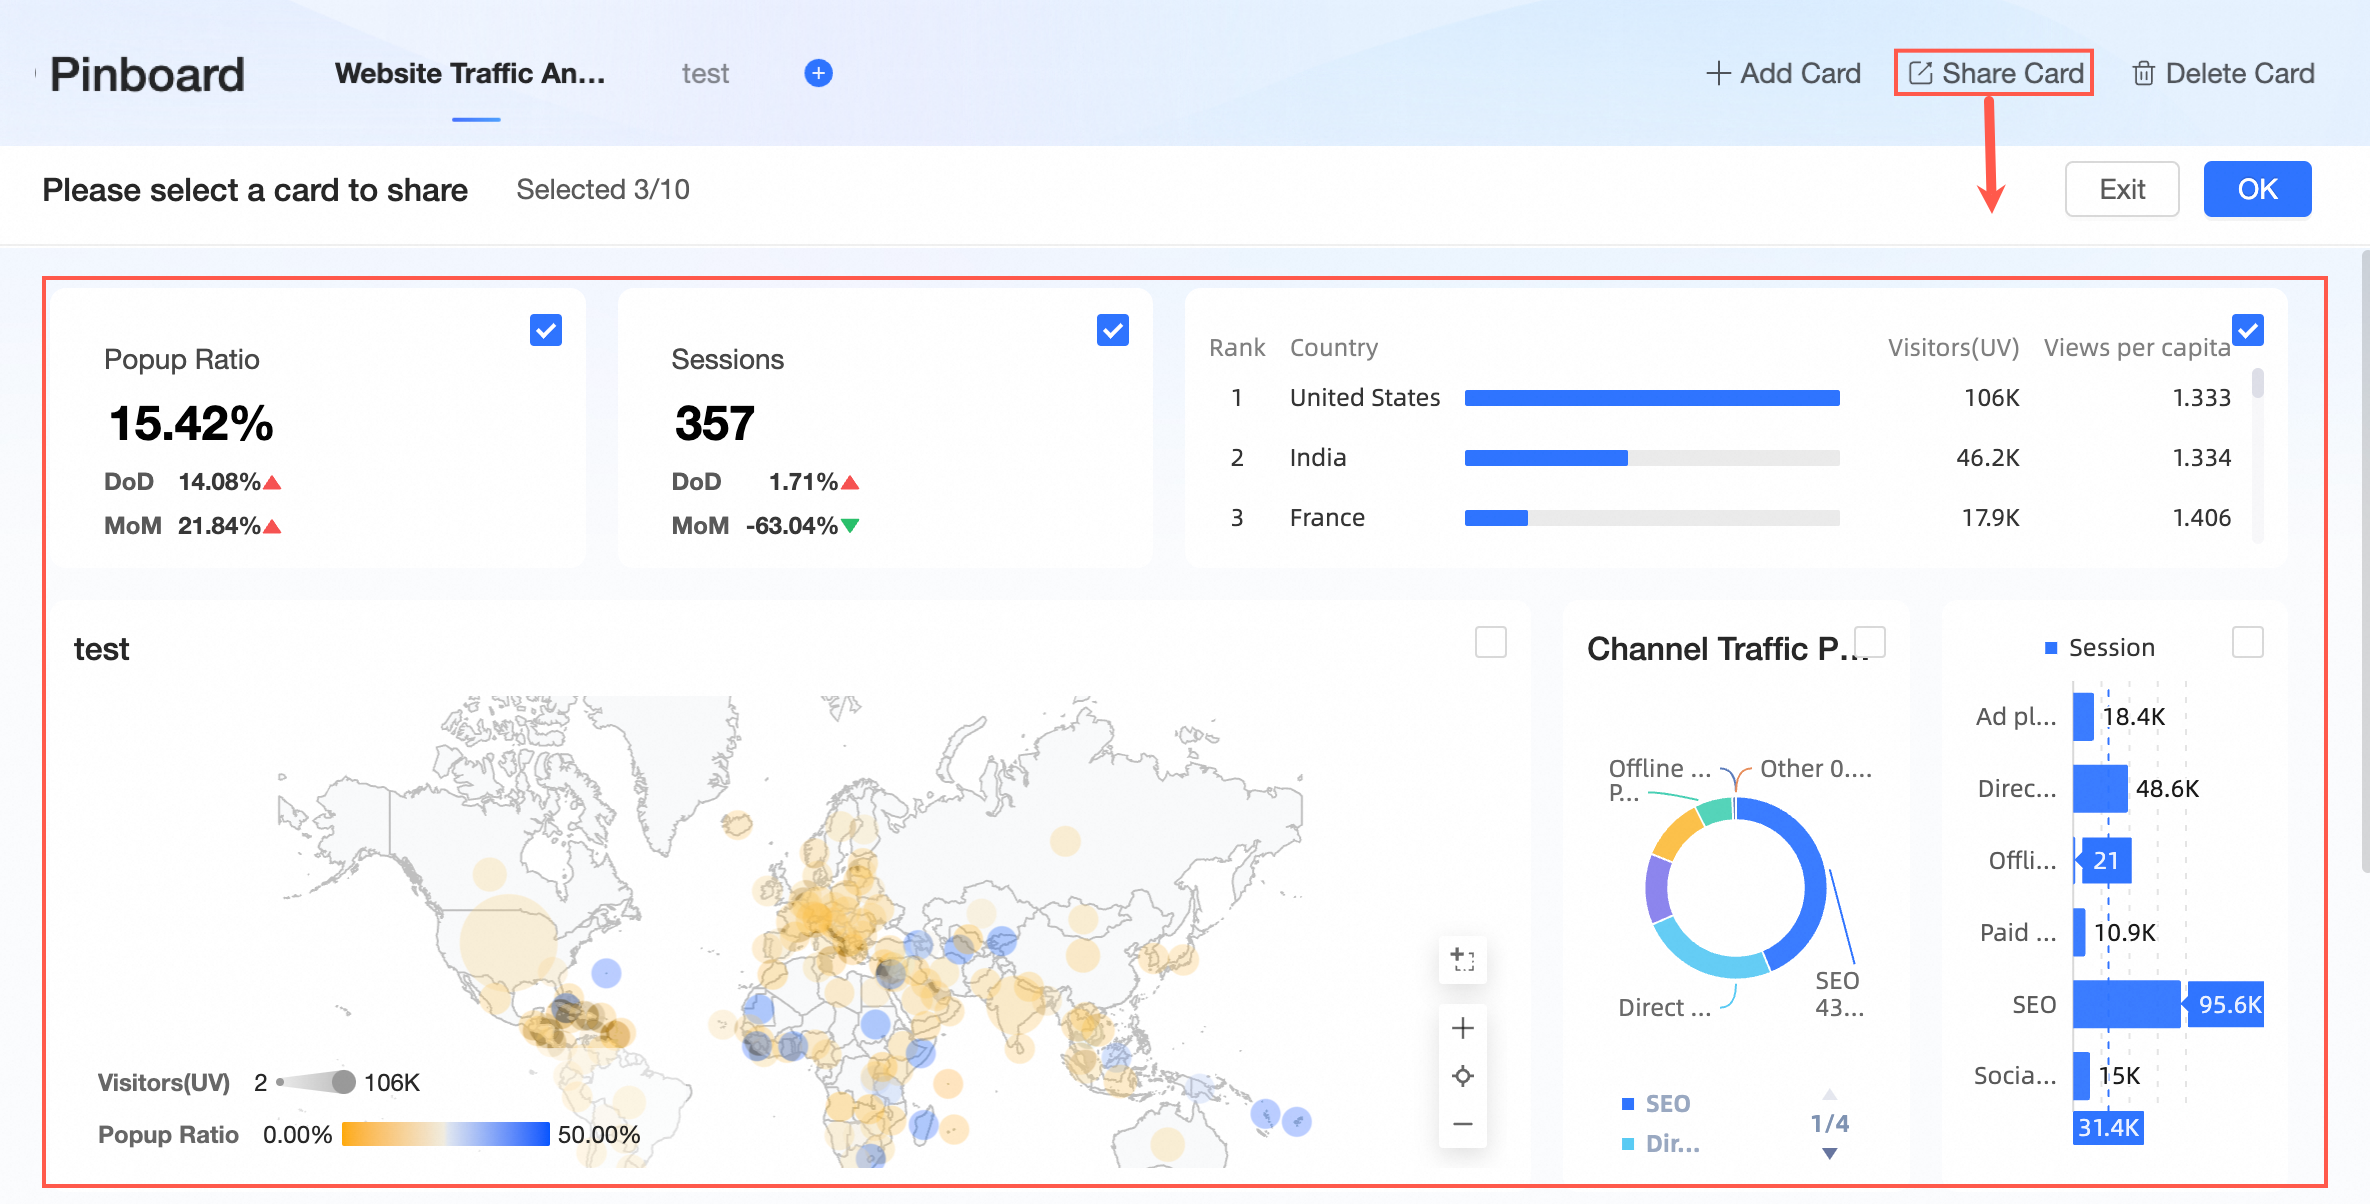
⑤ Share Card
You can share individual cards.
NoteSharing of indicator relationship graphs and indicator decomposition trees is not currently supported.
Multiple cards can also be shared.
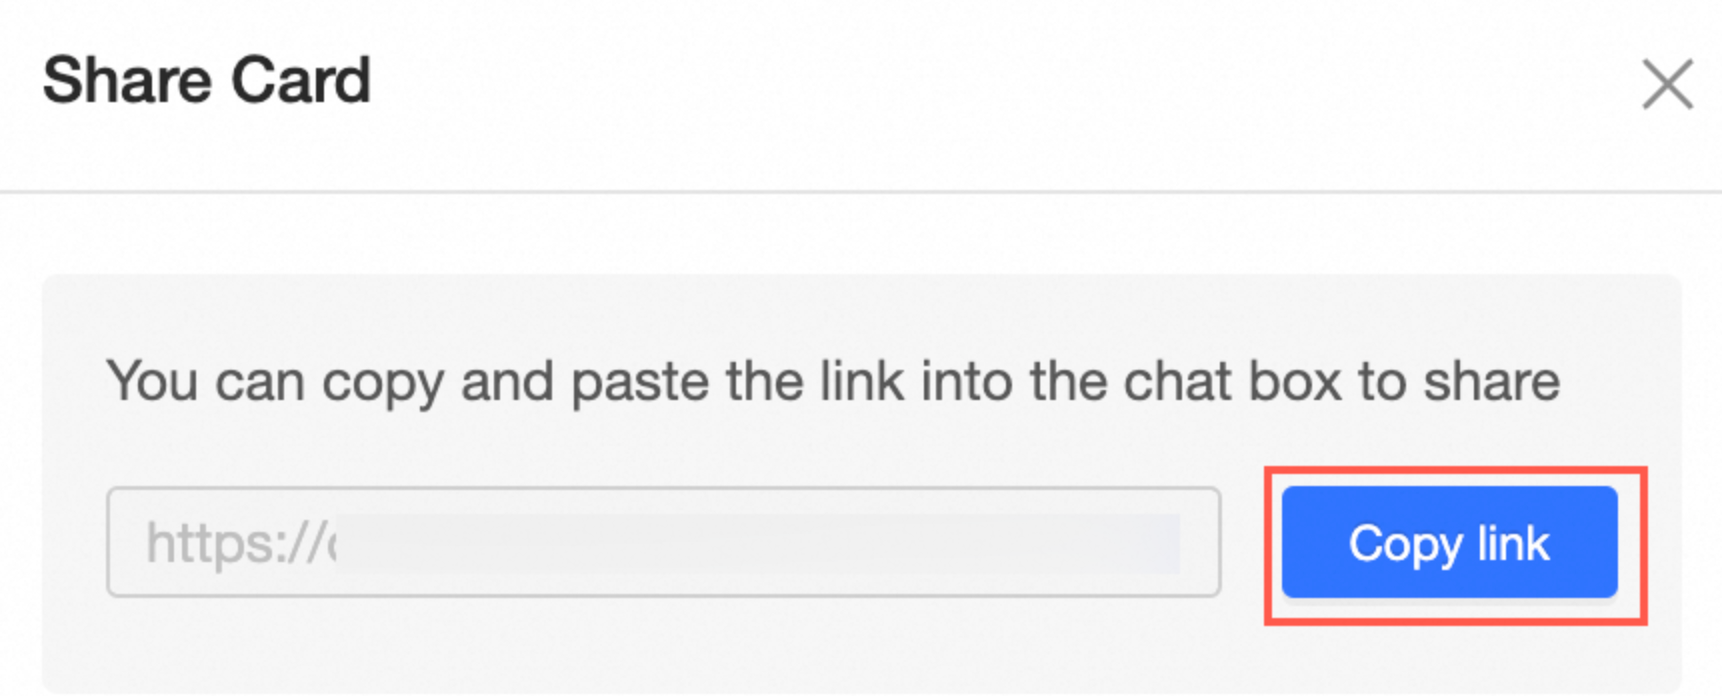
Supports copying and pasting of links for sharing.
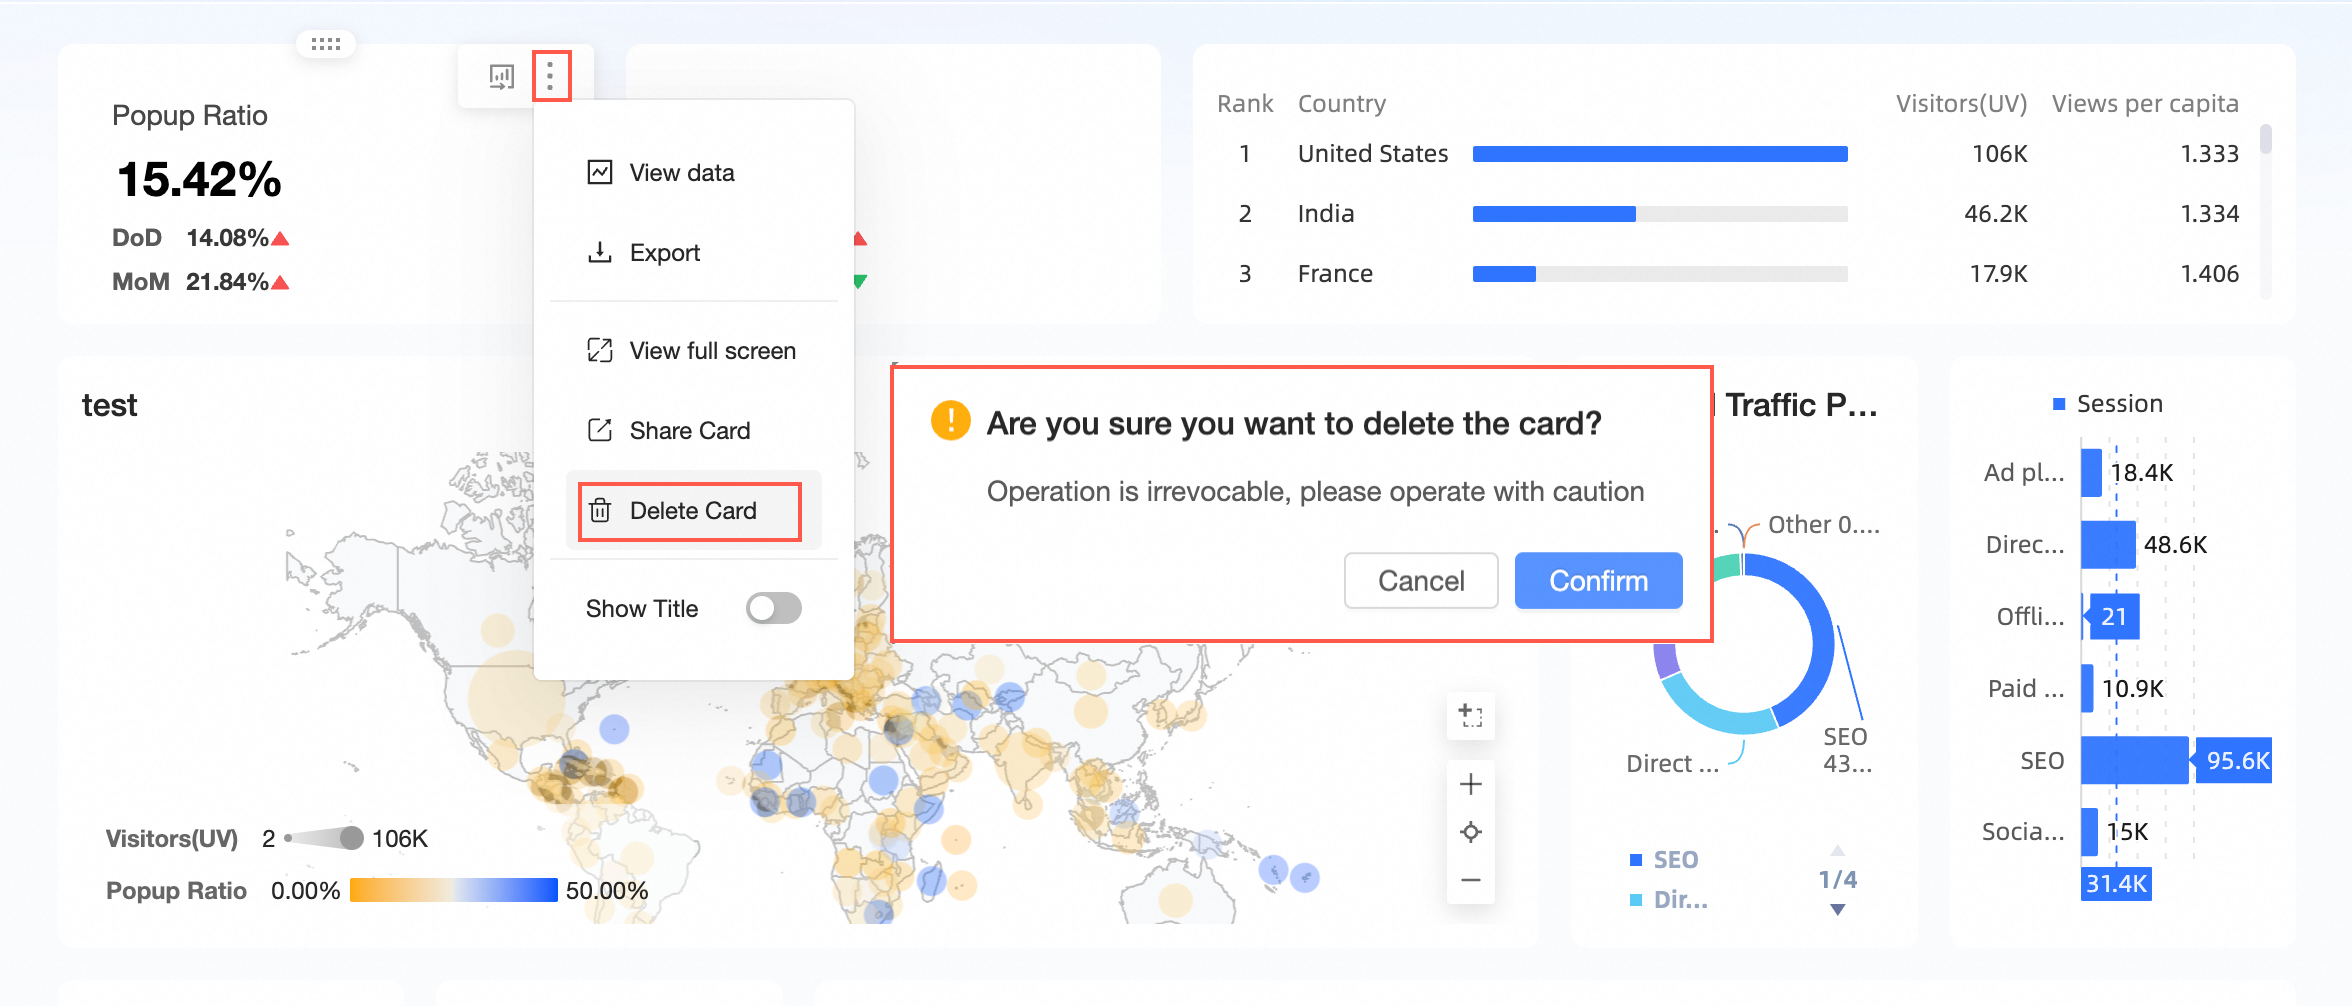
⑥ Delete Card
Allows for the deletion of individual cards.
You can also delete multiple cards at once.
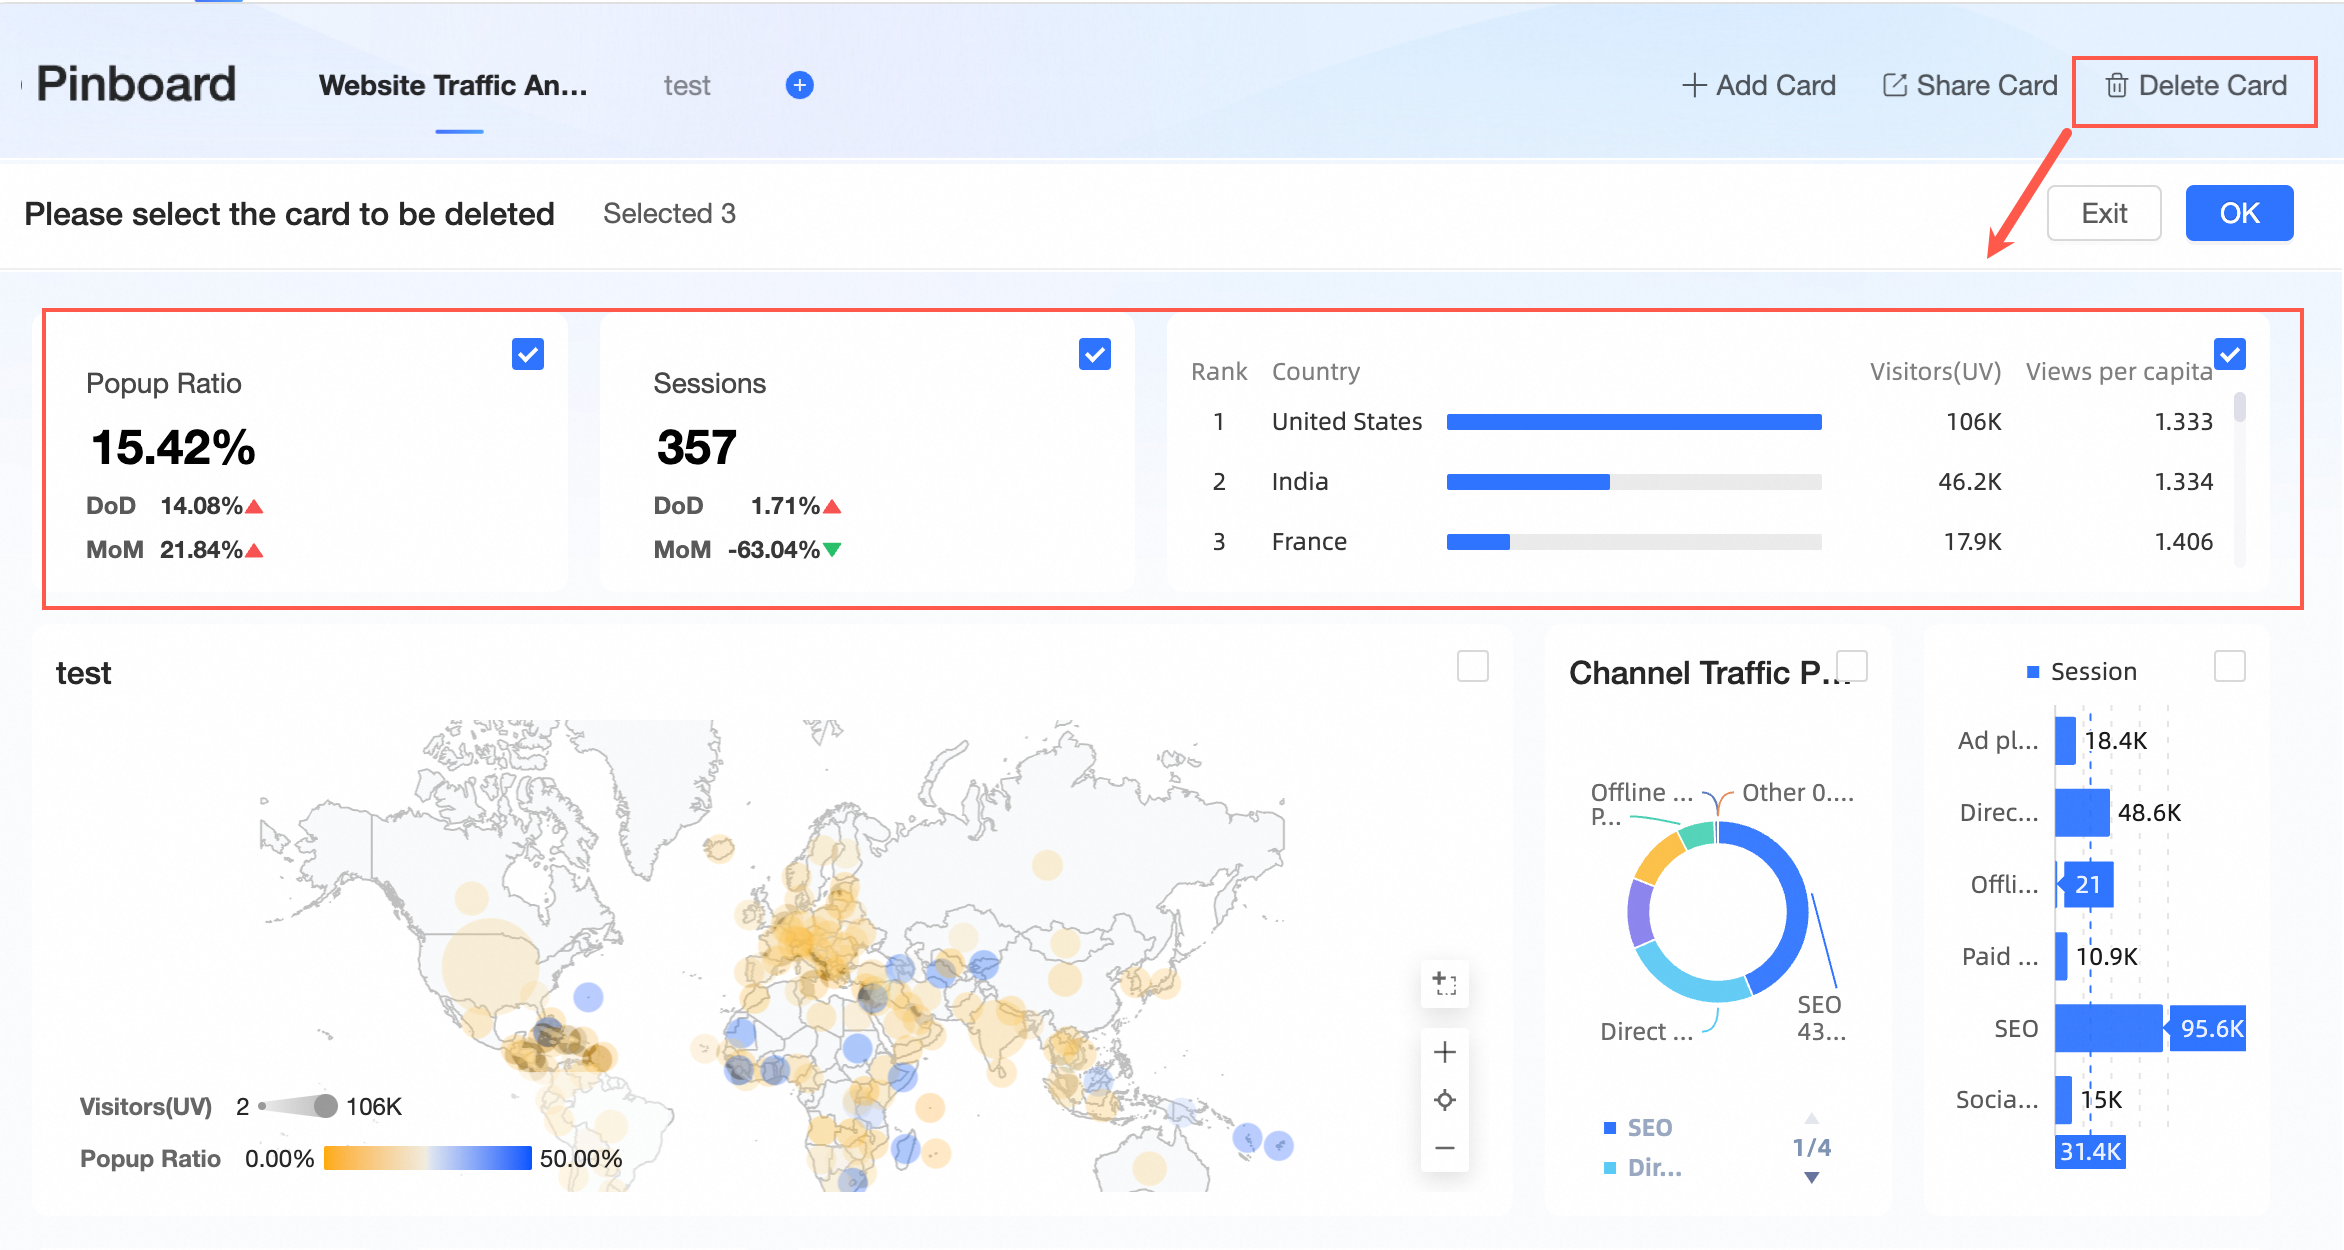
Confirming the deletion will remove the card from the Pinboard without affecting the original card on the dashboard.
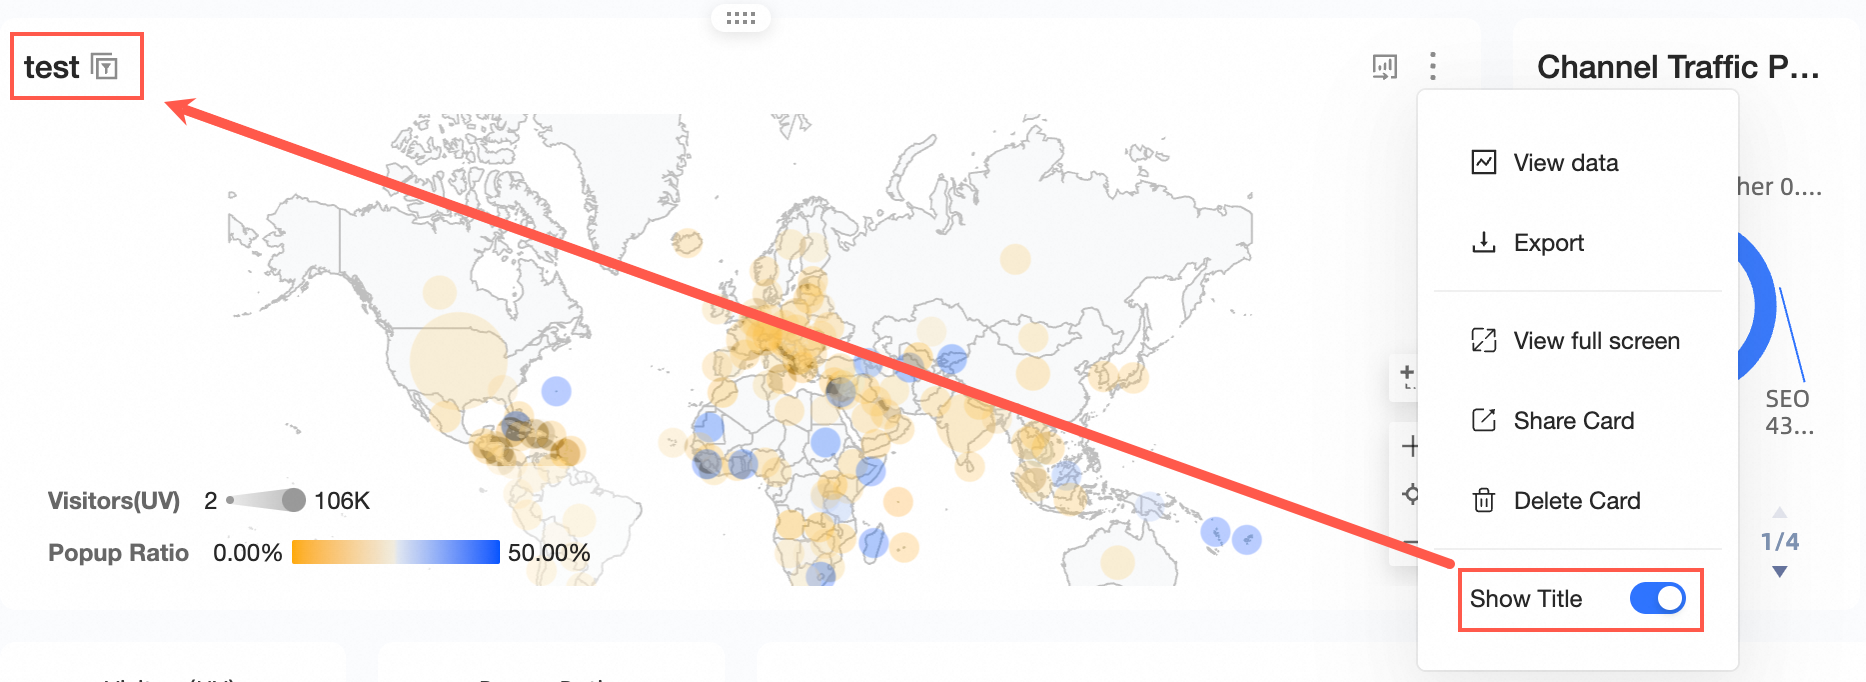
⑦ Display Title
You can choose to display or hide the card title.
⑧ Jump to Source Dashboard
Hover over the card and click the
 icon to navigate to the source dashboard.
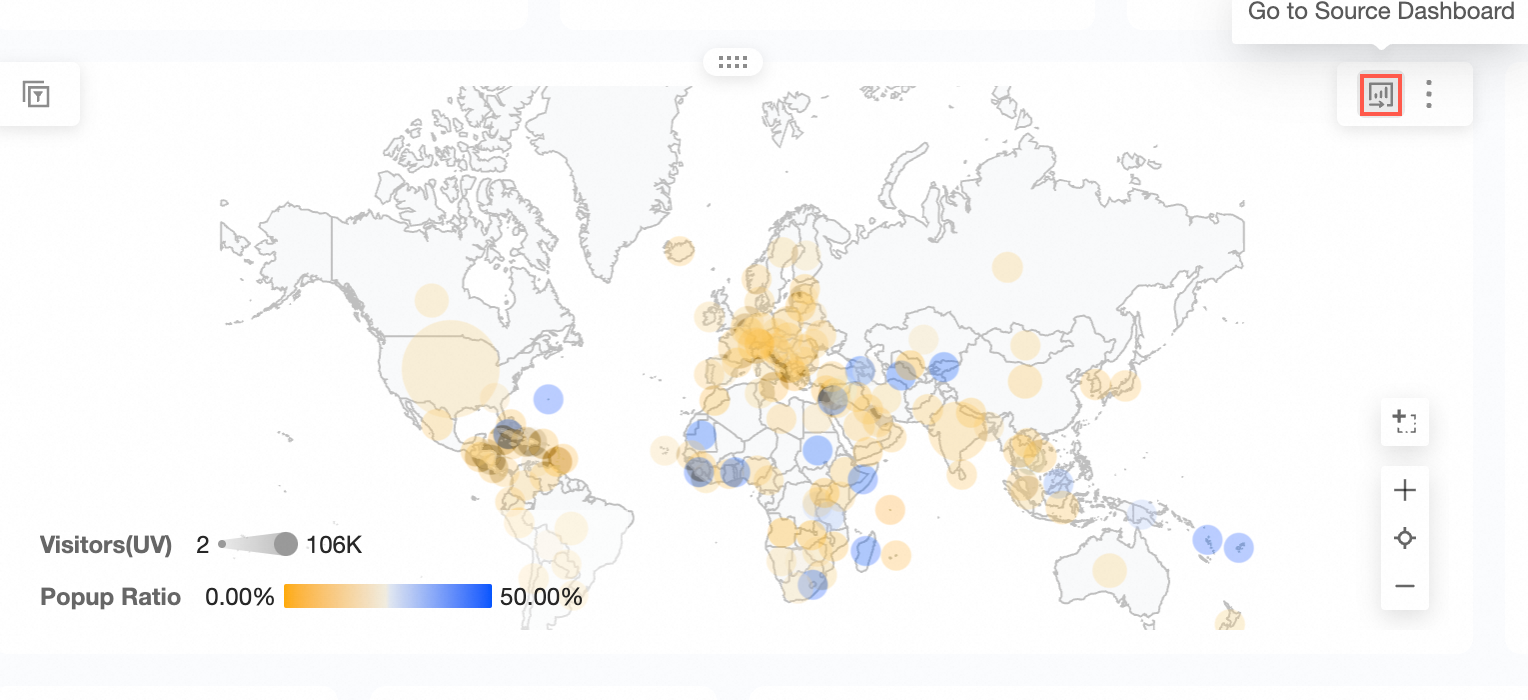
Card data and query condition description
Query condition inclusion
When collecting a card, all effective query conditions for the card are included, such as dashboard-level, tab-level, and widget-level conditions.
For instance, the card "Bar Chart - Annual Sales Data" includes three effective query conditions: region and province at the dashboard level, and year as an internal condition of the card.
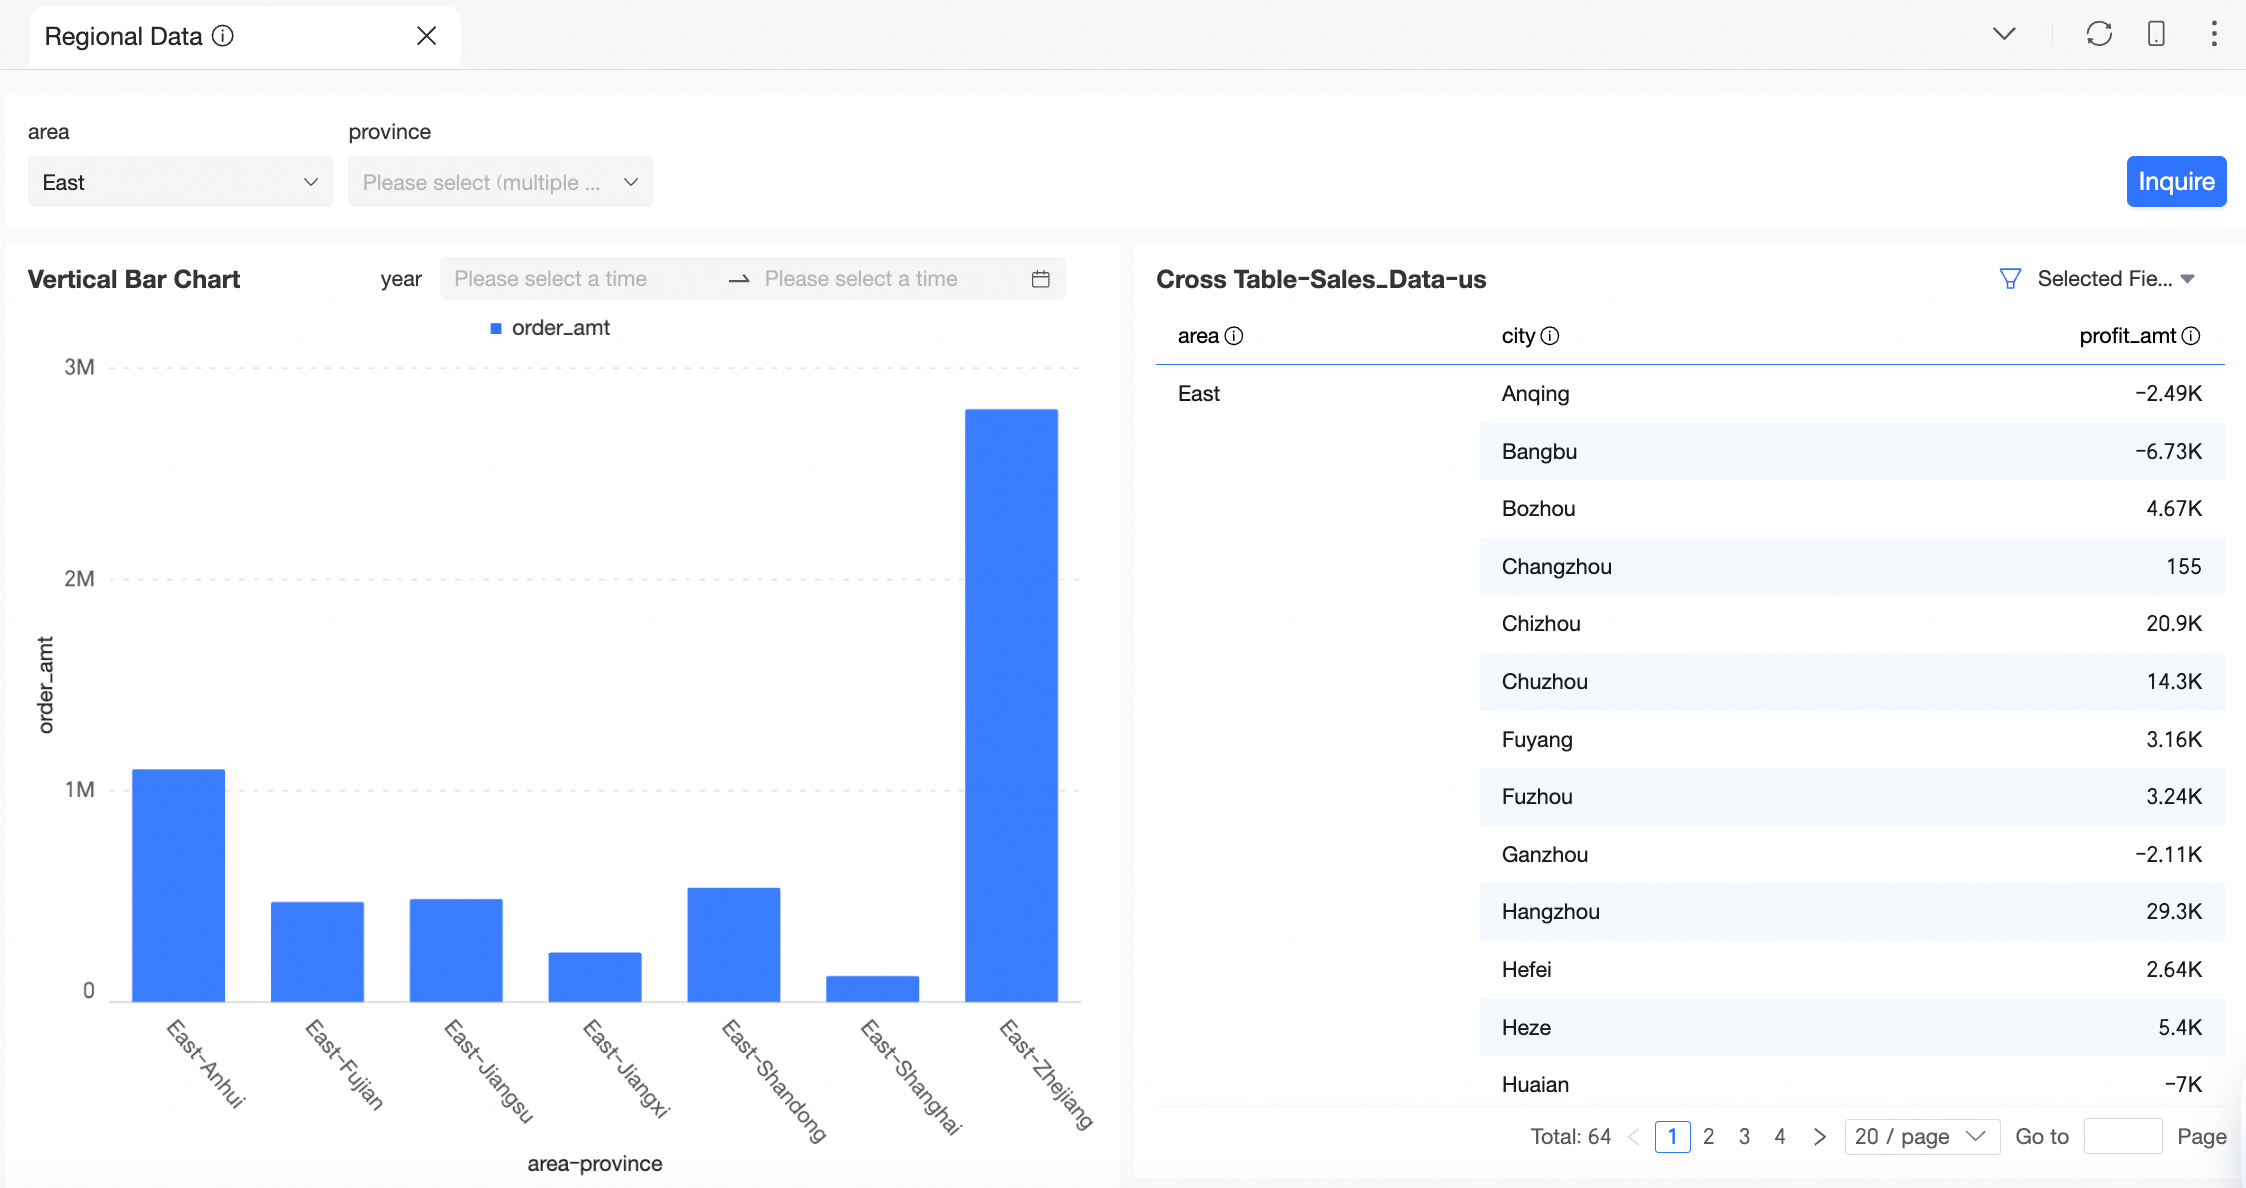
Follow the steps in the diagram to collect the card to the Pinboard.
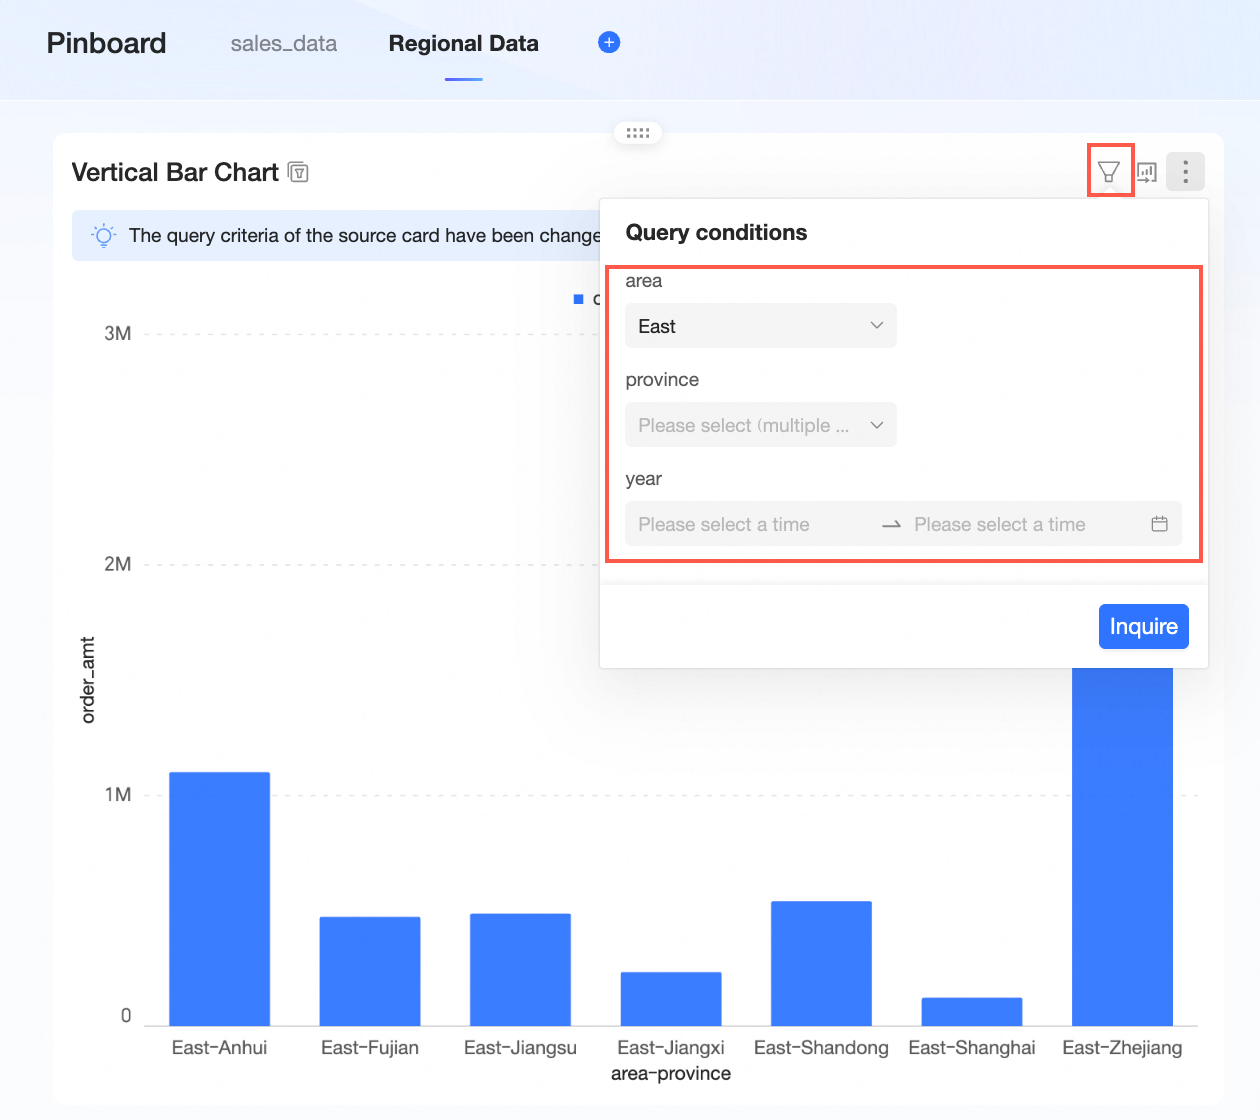
Now, you can see that all three query conditions of the card are included on the Pinboard.
Query condition filter value record
Non-date selection conditions:
Effective rule: The conditions active at the time of collection are included and displayed, and they can be modified. Changes made on the Pinboard are retained even after refreshing.
Application example:
When collecting the card to the Pinboard with the query condition set to the Northeast region, the collected card will display this condition on the Pinboard, which can be altered.
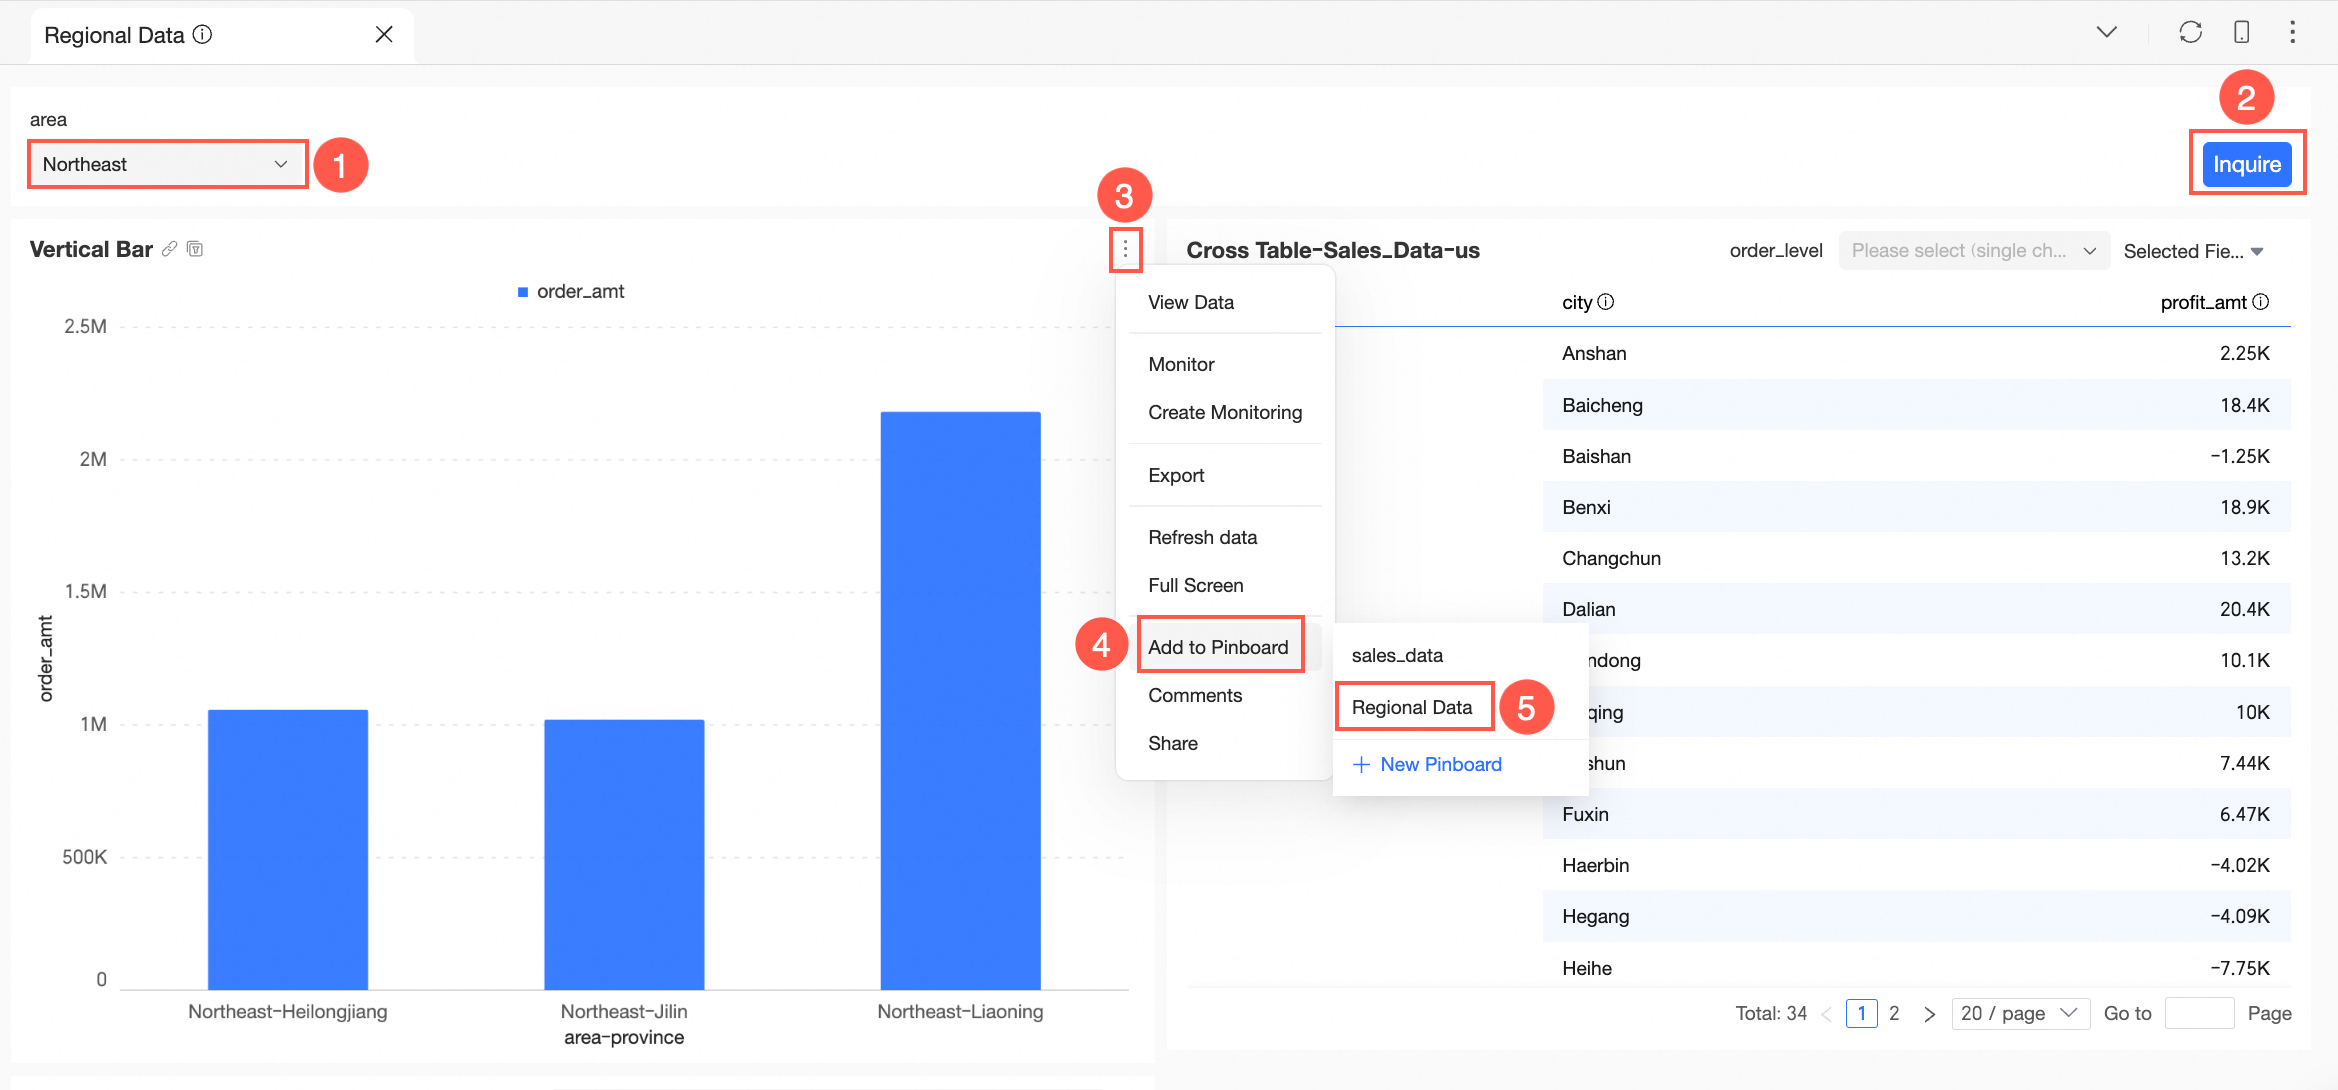 Consequently, the card on the Pinboard will show the Northeast query condition, and it can be changed.
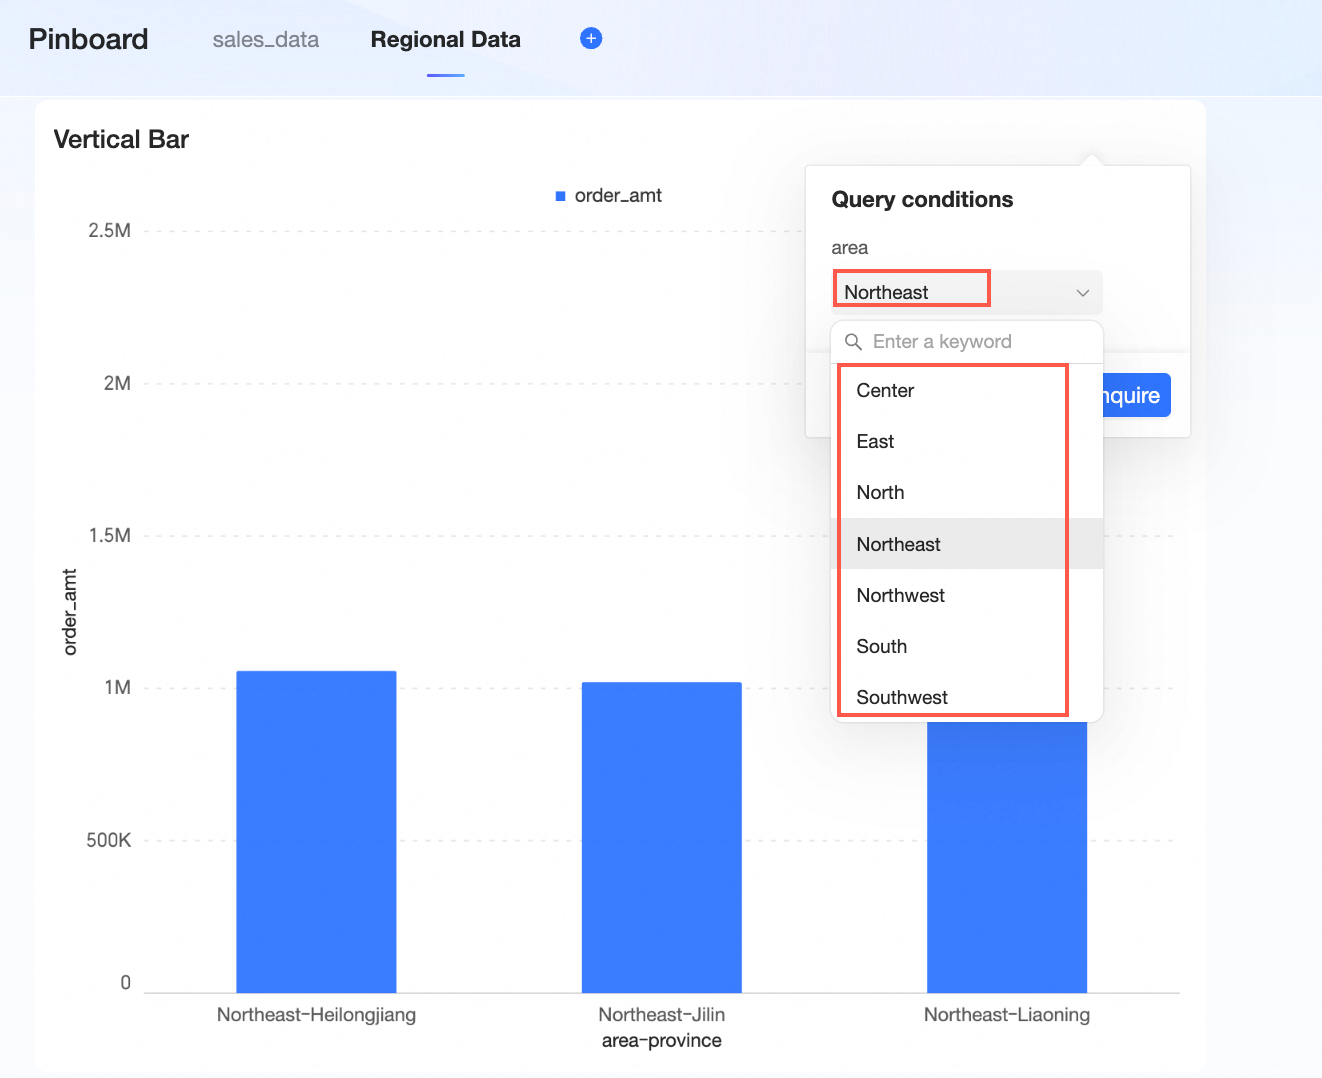
Date selection conditions
Effective rule: The default value is always displayed, updated automatically upon each visit, and can be changed to view other dates. However, the last selected condition is not saved (i.e., each time you access the Pinboard, the default time condition is shown. If set to display T-1, it will always show the latest data).
Application example:
For date selection, the default display is T-1. On 20231122, select 20231119 and collect the card.
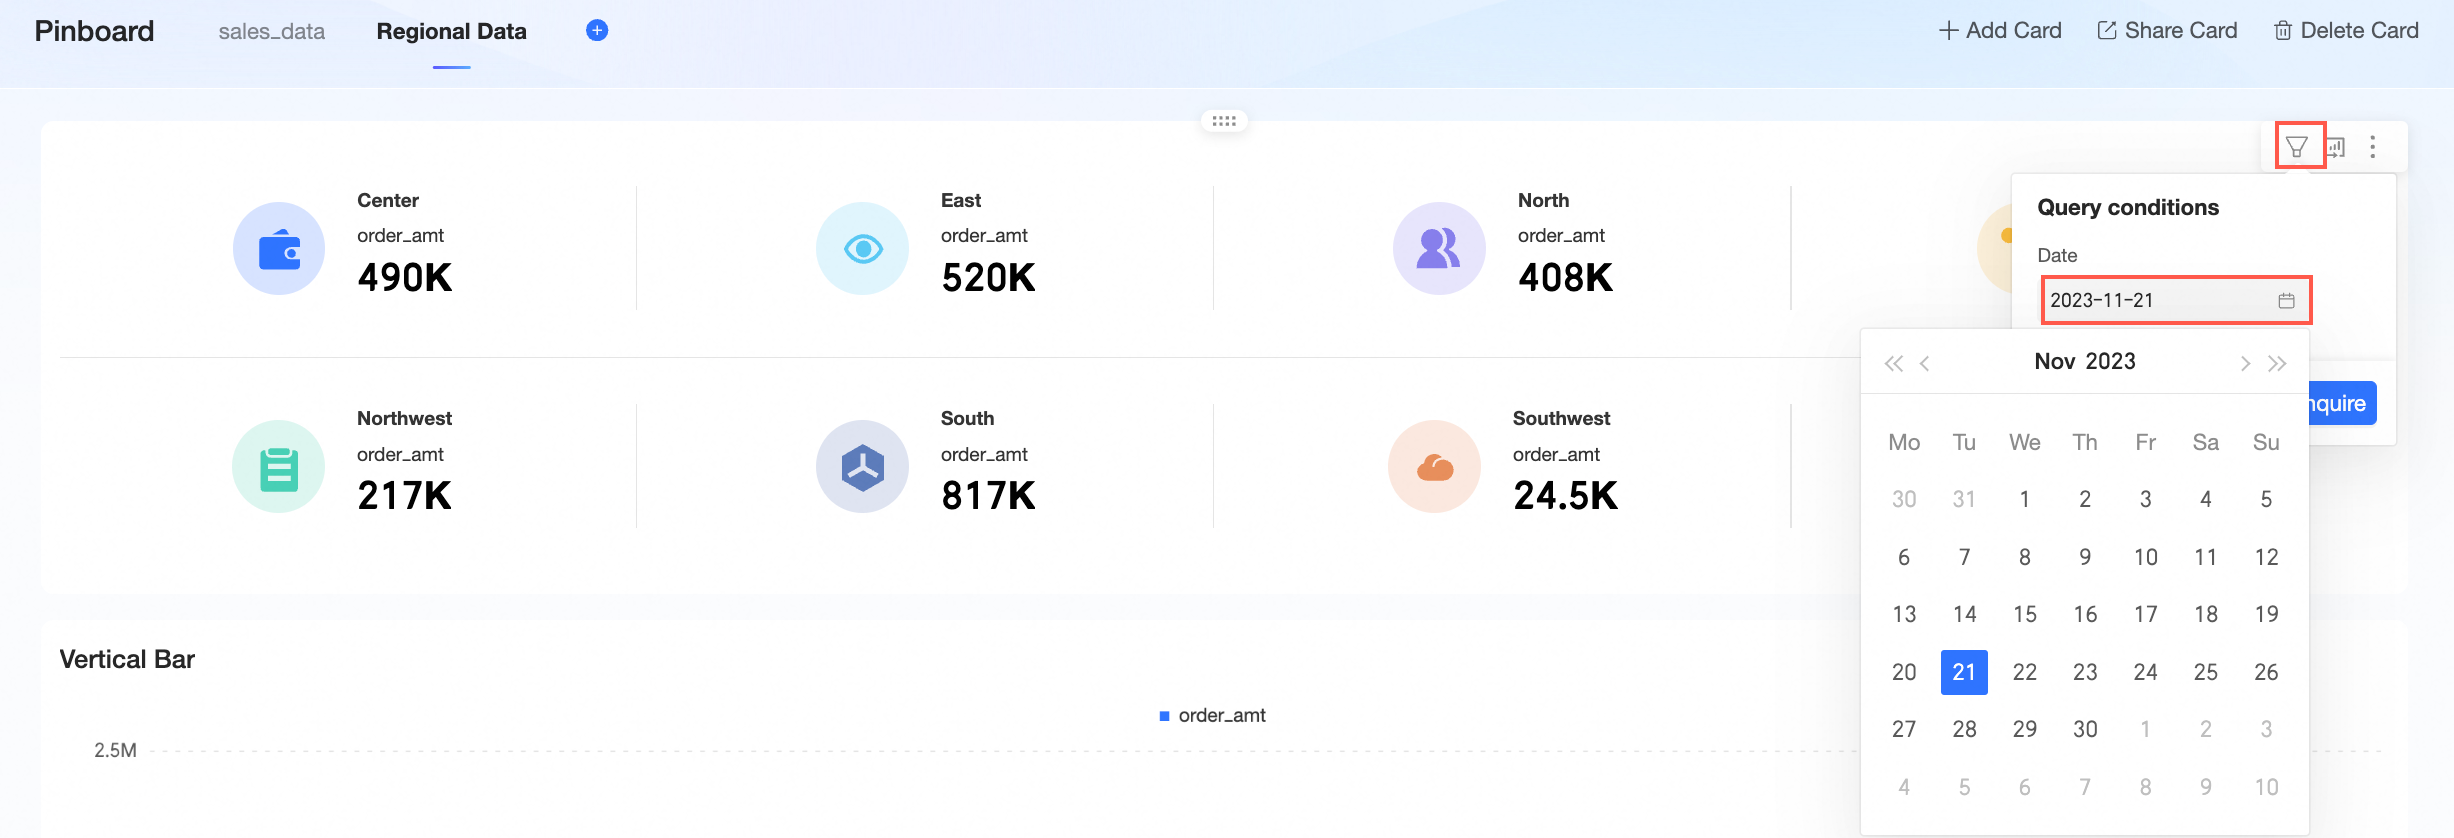
After collection, the date will automatically update to 20231121, and in the future, it will default to T-1 each day, with the option to modify the date.
Query condition update
Update principle: The update principles for dashboard-level, tab-level, and widget-level query conditions are consistent. When query conditions on the source dashboard are added, deleted, or modified, the Pinboard synchronizes these changes, and the card indicates that the conditions have been updated.