To analyze data that requires processing beyond what's available in a data table, you can create a calculated field.
Prerequisites
You have created a dataset. For more information, see Create and Manage Datasets.
Background information
Quick BI offers a variety of calculation methods to enhance data processing efficiency:
Aggregation
For example, to count the number of unique customers by name:
COUNT(DISTINCT [Customer Name])Basic Operations
For example, to calculate the average transaction amount per customer:
[Transaction Amount] / [Customer Count]Character Splitting and Merging
For example, to concatenate province and city:
CONCAT([Province], [City])Complex Grouping
For example, to define VIP customers based on certain criteria:
CASE WHEN [Transaction Amount] > 1000 AND [Transaction Count] > 5 THEN 'VIP' ELSE 'Regular' END
Configuration methods
On the data processing page, click Create Calculated Field.

You can also move your mouse over the target field in the field outline or data preview interface, click the
 icon, and select Create->Create Calculated Field.
On the Create Calculated Field page, configure parameters and then click OK.
Enter a field name.
(Optional) Enter a Field Description.

Click Reference Function and Reference Field to edit the field expression. The referenced functions are categorized into System Built-in Functions and Database Functions.
System Built-in Functions: These are calculation functions built into the BI system that mask differences between underlying databases and are applicable to various database types.
For more information about system built-in functions, see System Built-in Functions.
Database Functions: These are native functions provided by the underlying database. Different databases offer different native functions. For example:
Database functions displayed for MySQL data sources:

Database functions displayed for Exploration Space are Clickhouse functions:

When editing an expression, consider the following:
You can enter
[in the expression editor to display a list and insert the measure field name.Click the quick calculation operators for direct reference.

Click the
 icon to clear the expression.
For common field expression examples, see Example Scenarios.
Click OK.

The newly created calculated field can be directly referenced for further calculations to meet complex calculation scenarios.
For example,
Profit Amount = Order Amount - Cost Amount;Profit Rate = Profit Amount / Order Amount.
Example scenario
Aggregate function
Sum:
SUM([Field])Count:
COUNT([Field])Count Distinct:
COUNT(DISTINCT [Field])Average:
AVG([Field])
Quick BI automatically aggregates dimension data on a dashboard for calculated fields configured for aggregation.
Basic operations
Addition, subtraction, multiplication, and division are supported.
For example, to calculate the average transaction amount per customer from the order details table:
SUM([Transaction Amount]) / COUNT(DISTINCT [Customer Name])
Complex grouping scenarios
For scenarios involving dimension grouping, the Group Dimension feature supports simple single-field grouping. For multiple field combination conditions, use the
CASE WHENfunction. For example:CASE WHEN [order_amt]>5000 AND [order_number]>40 THEN 'VVIP' WHEN [order_amt]>1000 AND [order_number]>5 THEN 'VIP' ELSE 'Ordinary' END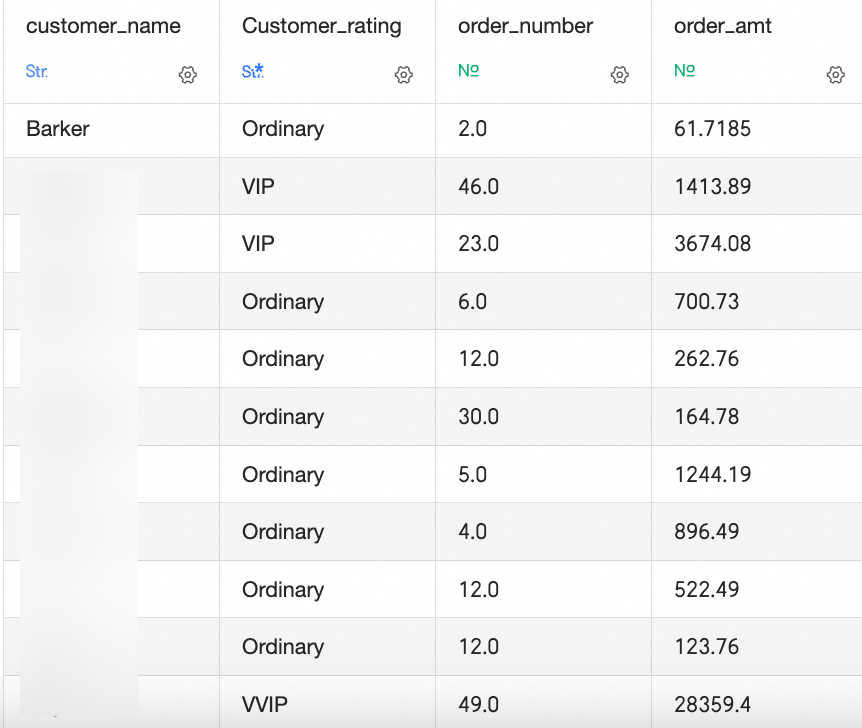
String concatenation
To merge fields like province and city, use the CONCAT function.
CONCAT(a, b, c, d): Include the fields to be merged in parentheses, separated by commas. To add a delimiter between columns when merging strings, enclose the delimiter in single quotation marks.For example,
CONCAT([Province],'-',[City])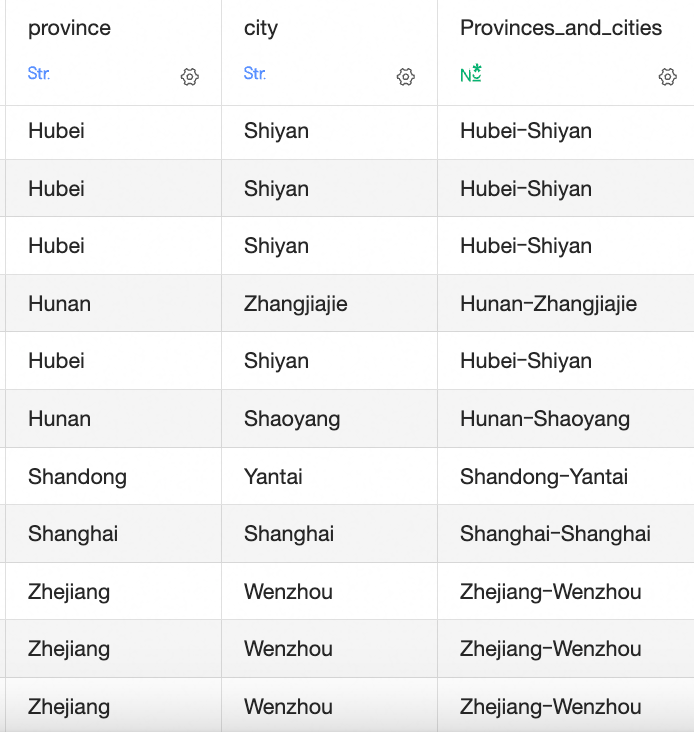
String processing
String functions allow for text data manipulation.
The method varies based on database functions. Here, MySQL functions are used as an example.
To truncate a string:
SUBSTRING([Customer Name],1,1): Retrieves one character starting from the first in the [Customer Name] field.SUBSTRING([Field]): Specify the start position and length of the string to truncate.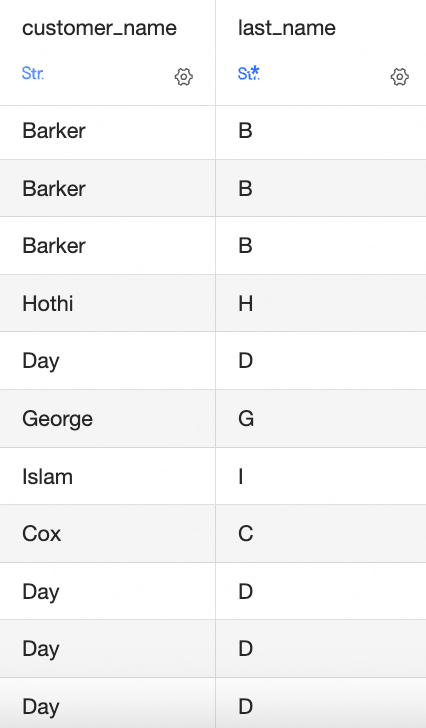
To find the position of a substring within a string:
INSTR([Customer Name],'East'): This function checks if the [Customer Name] field contains the character‘E’. It returns the character's position if found, or 0 otherwise.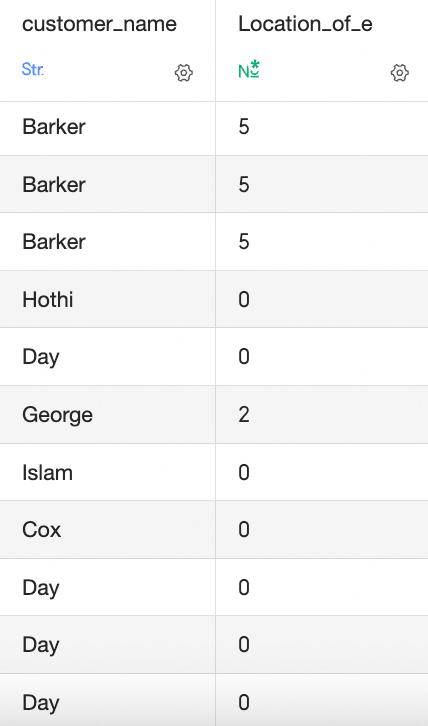
Date and time processing
Quick BI automatically separates date and time fields into various time granularities, allowing you to specify display formats for different granularities to meet diverse business requirements.
Additionally, you can utilize database date-related functions for further processing. For example, search for related functions by entering DATE in the function list search box.
The processing method for date and time varies with the database functions. Here, MySQL functions are used for illustration.
Current date:
CURRENT_DATEDays since joining:
DATEDIFF(CURRENT_DATE, [Start Date]), calculates the number of days from the start date to the current date.Expiration date:
ADDDATE([Payment Date], 365), returns the date 365 days after the payment date.
LOD function detailed level calculation
When you need to include a dimension in the analysis that has a different level of detail than the existing visualization, and you want to maintain the current display, you can use the level of detail expression feature. For instance:
To calculate total sales for each region:
lod_fixed{[Region]:SUM([Order Amount])}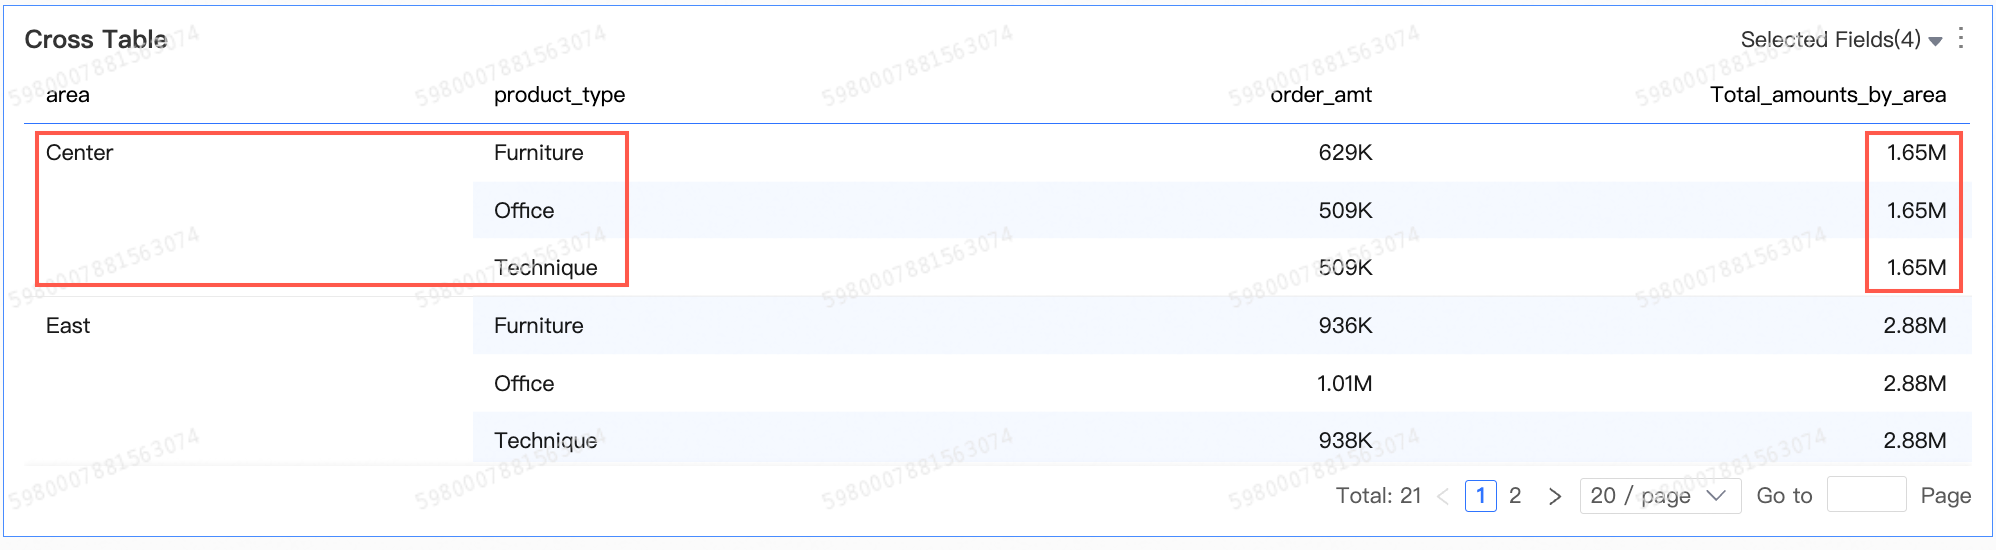
To analyze customer repurchase behavior:
lod_fixed{[User ID]:count(distinct([Order ID]))}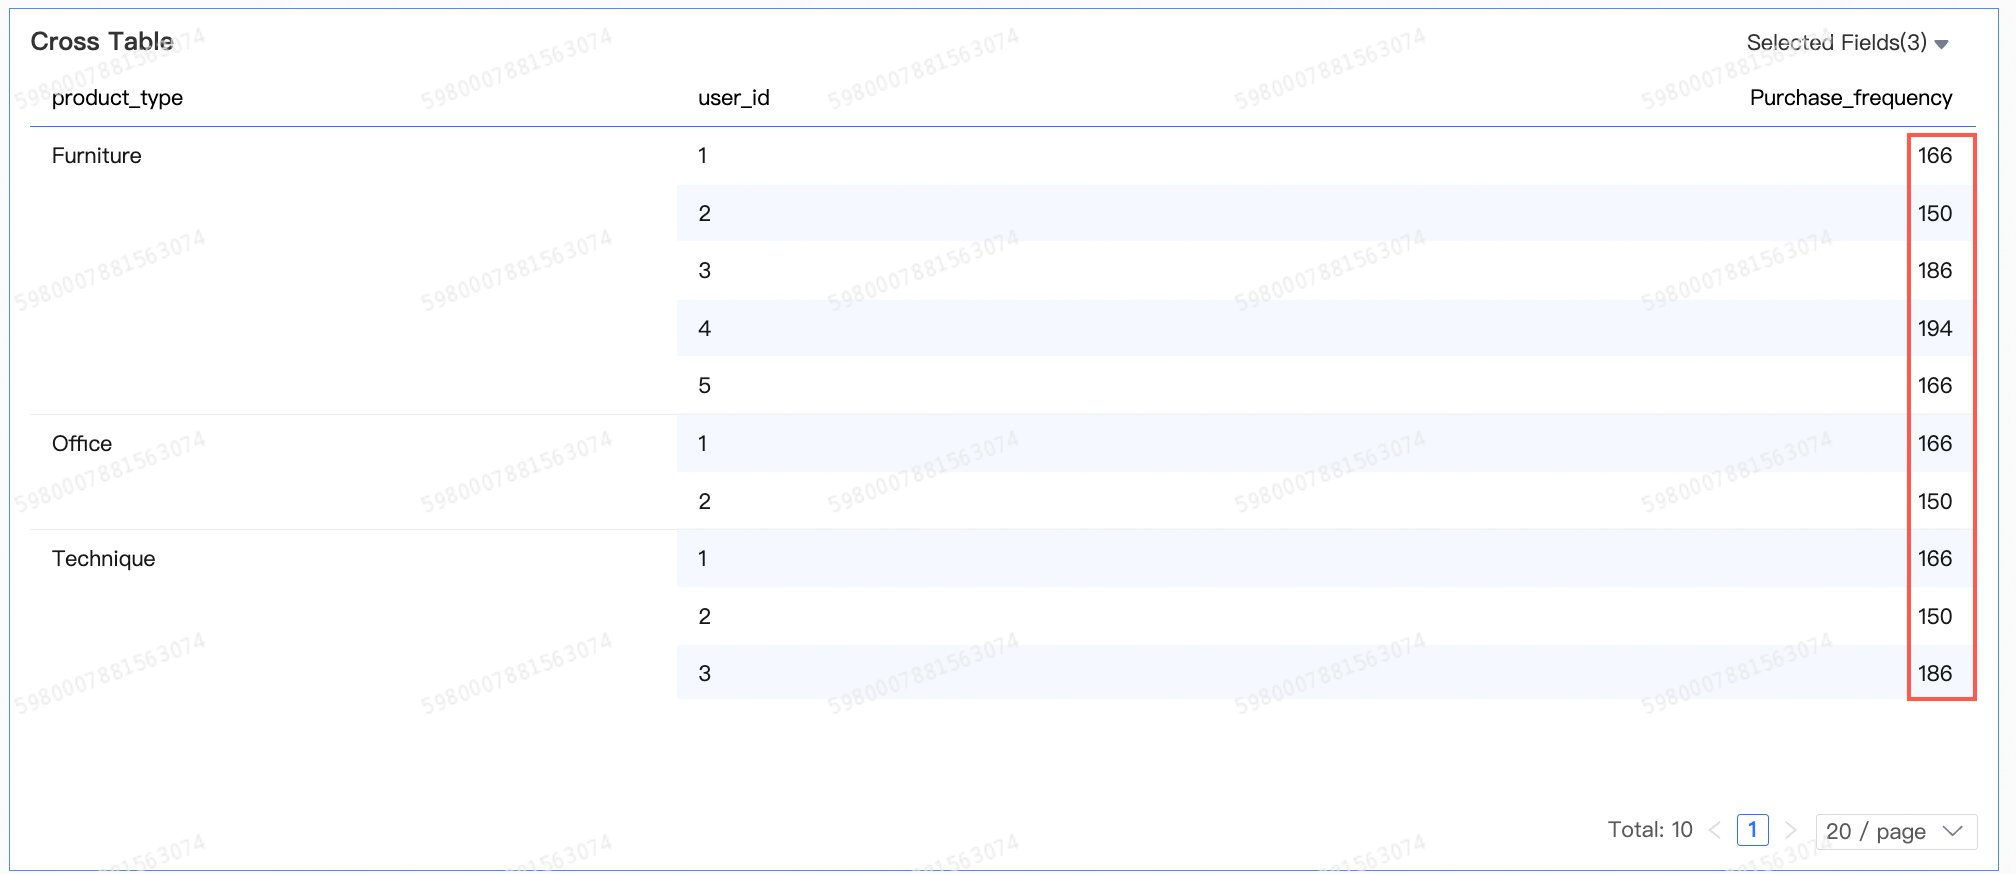
For more information, see Analysis Functions (LOD Functions).