CloudOps Orchestration Service (OOS) allows you to create and configure alerting rules for resource monitoring and monitoring rules for cloud environment. This way, you can monitor key metrics such as CPU utilization, memory usage, and network traffic. If a metric meets the specified conditions, the system triggers a preset response template and performs corresponding O&M operations to enhance resource stability and security.
Prerequisites
A template is created. For more information, see Template overview.
Procedure
Log on to the CloudOps Orchestration Service console. In the left-side navigation pane, choose Automated Task > Alert and Event O&M. On the Alert and Event O&M page, click Create.
On the Create Alert and Event O&M page, select Threshold Alert.
Configure the parameters in the Trigger Rule section.
In this example, a rule is configured to monitor the CPU utilization of Elastic Compute Service (ECS) instances.
Service: Select ECS from the drop-down list.
Rule Description: Select the following values from the drop-down lists: , 1-minute Period, 1 Consecutive Periods, Average Value, >, 70.
Mute Period: Select 5Minutes from the drop-down list.
Resources Alerted: You can manually select instances or specify instance tags.
For more information about how to use tags, see Tag overview.
In the Select Template section, select a template that you want to use to perform predefined O&M operations when the rule is triggered.
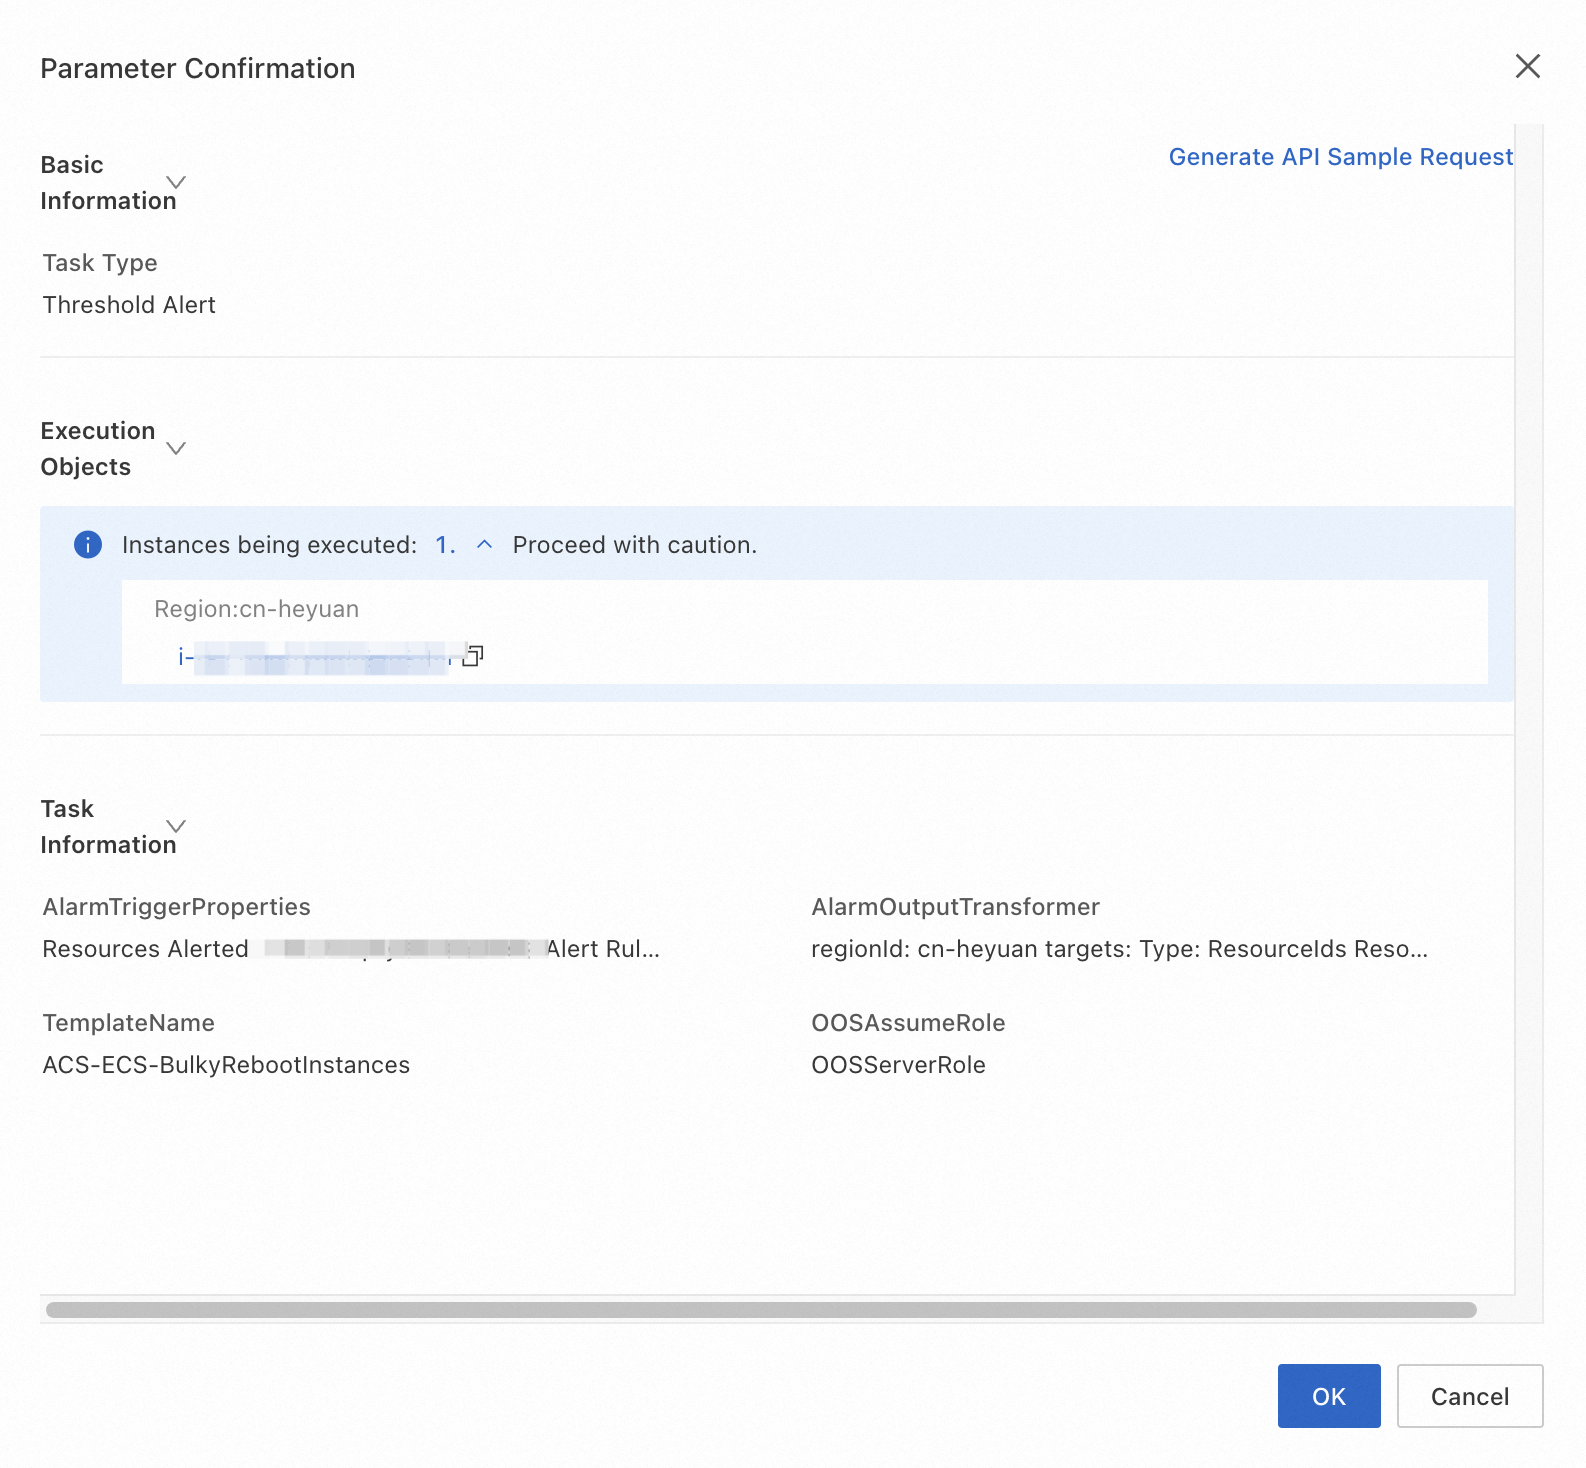
Only triggerless templates are supported. You can select a public or custom template. In this example, the ACS-ECS-BulkyRebootInstances template is selected.
In the Configure Template Parameters section, configure the Permissions parameter to select a Resource Access Management (RAM) role that is granted the permissions to execute the template.
For more information about RAM roles, see RAM role overview.
Click Create. In the Parameter Confirmation message, confirm the parameter configurations and click OK.
The following figure shows an example.

Log on to the CloudOps Orchestration Service console. In the left-side navigation pane, choose > Alert and Event O&M. On the Alert and Event O&M page, find the rule that you created and click Details in the Actions column. On the Historical Executions tab of the rule details page, view the execution history.