When your Nacos engine handles service registration, configuration distribution, and push notifications at scale, you need real-time visibility into performance bottlenecks, capacity limits, and infrastructure health. The Monitoring Center in Microservices Engine (MSE) provides unified dashboards that track these metrics across eight categories, so you can detect anomalies and resolve issues before they affect your services.
Prerequisites
Before you begin, make sure that you have:
A Nacos engine running version 2.0.4 or later
Choose a dashboard
MSE provides two monitoring dashboards. The Grafana dashboard is recommended because it covers significantly more metrics.
| Dashboard | Metrics coverage | Default time range | Recommended for |
|---|---|---|---|
| Grafana dashboard | 8 metric categories across dedicated tabs | Last 15 minutes | All users on Professional Edition |
| Legacy dashboard | 3 basic metrics (service count, provider count, write RT) | Last 30 minutes | Users who have not yet upgraded |
If your engine still uses the legacy dashboard, upgrade to the Grafana dashboard for full observability.
Enable the Grafana dashboard
Basic Edition engines
The Grafana dashboard is automatically enabled after you upgrade your engine to Professional Edition. For more information, see Upgrade a Nacos version.
Professional Edition engines (version 2.0.3 or earlier)
If your engine runs version 2.0.3 or earlier, enable the Grafana dashboard manually:
Log on to the MSE console and select a region in the top navigation bar.
In the left-side navigation pane, choose Microservices Registry > Instances.
Click the name of the target instance.
In the left-side navigation pane, click Observation Analysis.
Click Upgrade Monitoring Dashboard and follow the on-screen instructions.
After the upgrade completes, the Monitoring Center page becomes available.
Use the Grafana dashboard
The Grafana dashboard organizes metrics into purpose-built tabs. Start with the Overview tab to spot anomalies, then drill into specific tabs to investigate root causes.
| Investigation goal | Start here |
|---|---|
| Quick health check | Overview and Top N Monitoring |
| Service registry issues | Registry Monitoring and Push monitoring |
| Configuration issues | Configuration center monitoring |
| Infrastructure problems | JVM Monitoring and Resource Monitoring |
| Connection issues | Number of connections monitoring |
Open the Monitoring Center
Log on to the MSE console and select a region in the top navigation bar.
In the left-side navigation pane, choose Microservices Registry > Instances.
On the Instances page, click the name of the target instance.
In the left-side navigation pane, click Monitoring Center.
Dashboard controls
Time range: The default monitoring window is the last 15 minutes. To change it, click the time range selector in the upper-right corner and choose a preset or custom range.
Data granularity: Hover over any point on a chart to see per-node metric values at that moment, accurate to the minute.
Refresh: Click the
 icon in the upper-right corner to reload the current data.
Overview tab
The Overview tab provides a high-level summary of your engine's health. Use it as your first stop during routine checks and incident triage.
Overview section
| Metric | What it measures | What to look for |
|---|---|---|
| Number of nodes | Total engine nodes in the cluster | A sudden drop indicates a node failure. Verify that the count matches your expected cluster size. |
| Number of configurations | Total configuration entries managed by the engine | Unexpected changes may indicate unauthorized configuration updates. |
| Number of Service Providers | Total registered service provider instances | A sudden drop suggests provider instances are deregistering, which may point to deployment issues or network failures. |
| Queries per second | Read request throughput (QPS) | Spikes beyond your baseline may indicate a traffic surge. A drop to zero may indicate engine unavailability. |
| Operations per second | Write request throughput (TPS) | A sustained spike may indicate a batch update or a runaway client. |
| Number of connections | Active client connections to the engine | Compare against baseline. A sudden drop may indicate network partitioning. |
Usage level section
| Metric | What it measures | What to look for |
|---|---|---|
| Configuration number using water level | Configuration count as a percentage of the engine's capacity | Values approaching 100% mean the engine is nearing its capacity limit. Scale up the engine specification before saturation. |
| Service Provider Water Level | Service provider count as a percentage of the engine's capacity | Same as above. Plan capacity upgrades when usage is consistently high. |
| Connection using water level | Connection count as a percentage of the engine's capacity | Same as above. High connection usage can cause new clients to fail to connect. |
The Eureka client supports only short-lived connections, so connection counts are not reported for Eureka-based applications.
Registry Monitoring tab
The Registry Monitoring tab tracks service registration and discovery performance. Use it to diagnose slow service discovery, registration failures, or capacity issues.
| Metric | What it measures | What to look for |
|---|---|---|
| Number of Services | Total registered services | A sudden drop indicates services are deregistering unexpectedly. |
| Number of Service Providers | Total service provider instances | Compare against your expected deployment size. A mismatch indicates registration failures. |
| Number of service subscribers | Total service subscriber instances | A rapid increase may indicate a subscriber storm from a misconfigured client. |
| Registration Center TPS | Write transactions per second for registration operations | A sustained spike combined with rising write RT signals resource contention. |
| Registration Center QPS | Read queries per second for discovery operations | Spikes here correlate with increased service discovery requests from new deployments or scaling events. |
| Registration Center Write RT | Average response time for write operations | Rising write latency warrants investigation. Check the Resource Monitoring and JVM Monitoring tabs to identify the bottleneck. |
| Registration Center Read RT | Average response time for read operations | Same as write RT. Rising read latency may indicate increased load or garbage collection pressure. |
Nacos 2.0.4 and later include four built-in services for address discovery using the Diamond protocol (Application Configuration Management). The service count and provider count shown here are the actual values plus 4.
The Eureka client does not support service subscription and uses polling queries instead. Service subscriber counts are not reported for Eureka-based applications.
Configuration center monitoring tab
The Configuration center monitoring tab tracks configuration management performance. Use it to investigate slow configuration pushes, listener accumulation, or write bottlenecks.
| Metric | What it measures | What to look for |
|---|---|---|
| Number of configurations | Total configuration entries | A sudden change may indicate a batch import or accidental deletion. |
| Configure the number of listeners | Total configuration listeners across all entries | A spike typically corresponds to a batch deployment rollout. Sustained high listener counts increase push overhead. |
| Configuration Center TPS | Write transactions per second for configuration changes | A spike combined with rising write RT signals the engine is under write pressure. |
| Configuration Center QPS | Read queries per second for configuration lookups | High QPS may indicate clients are polling too aggressively rather than using push-based updates. |
| Configuration Center Write RT | Average response time for configuration writes | Healthy values are in the low millisecond range. Rising values indicate resource contention. |
| Configuration Center Read RT | Average response time for configuration reads | Same as write RT. |
Push monitoring tab
The Push monitoring tab tracks how effectively the engine pushes service change notifications to subscribers. A healthy push pipeline is critical for service discovery responsiveness.
| Metric | What it measures | What to look for |
|---|---|---|
| Service Push Success Rate | Percentage of push notifications delivered successfully | A rate below 100% warrants immediate investigation. Check the Number of connections monitoring tab for connectivity issues and verify that subscribers are reachable. |
| Time-consuming service push | Average latency per push notification | Rising latency may indicate network congestion or overloaded subscriber clients. |
| Service Push TPS | Push notifications sent per second | Correlate with deployment or scaling events. A sustained spike without a corresponding event may indicate a push storm. |
| Service Empty Proportion | Percentage of pushes with empty service lists | A non-zero proportion may indicate services are deregistering unexpectedly. Check the Registry Monitoring tab to confirm provider counts. |
The Eureka client uses polling queries rather than push-based notifications, so push metrics are not available for Eureka-based applications.
Number of connections monitoring tab
The Number of connections monitoring tab tracks client connectivity to the engine. Use it to diagnose connection drops, version inconsistencies, and network issues.
| Metric | What it measures | What to look for |
|---|---|---|
| Number of client versions | Distribution of Nacos client versions connected to the engine | Multiple old versions may indicate inconsistent deployments. Standardize client versions to avoid compatibility issues. |
| Number of Long Links | Active persistent (long) connections between clients and the engine | A drop may indicate network issues or client-side failures. Cross-reference with the Resource Monitoring tab to check for network traffic anomalies. |
The Eureka client supports only short-lived connections, so connection metrics are not reported for Eureka-based applications.
JVM Monitoring tab
The JVM Monitoring tab exposes garbage collection (GC) and memory metrics for the engine's Java Virtual Machine (JVM). Use it to diagnose latency spikes caused by GC pressure or memory exhaustion.
| Metric | What it measures | What to look for |
|---|---|---|
| Young GC Time | Total time spent on young generation garbage collection | A sustained increase correlates with higher object allocation rates. |
| Young GC Times | Number of young generation GC events | Frequent young GC is normal under load, but a sudden increase may indicate a memory leak or traffic spike. |
| Full GC time | Total time spent on full garbage collection | Any full GC causes a stop-the-world pause. Frequent full GC events directly increase response times. |
| Full GC Times | Number of full GC events | Any full GC causes a stop-the-world pause. Frequent full GC events directly increase response times. If this metric is consistently elevated, consider upgrading the engine specification. |
| Heap Memory Usage | Percentage of heap memory in use | High heap memory usage increases GC frequency and response times. Consider upgrading the engine specification if usage remains high. |
Resource Monitoring tab
The Resource Monitoring tab provides infrastructure-level metrics for the engine nodes. Use it to determine whether performance issues are caused by resource constraints.
| Metric | What it measures | What to look for |
|---|---|---|
| Inlet flow | Inbound network traffic | A sudden spike may point to a traffic surge. |
| Outlet flow | Outbound network traffic | Correlate with push TPS. High outbound traffic with low push success rate may indicate network saturation. |
| Memory Usage | System memory utilization | Sustained high usage indicates the engine may need a specification upgrade. |
| CPU Usage | CPU utilization | Sustained high usage indicates the engine may need a specification upgrade. |
| Number of nodes | Current node count in the cluster | A drop indicates a node failure. |
| Load Indicator | System load average | A high load average relative to the number of CPU cores indicates the engine may be overloaded. |
Top N Monitoring tab
The Top N Monitoring tab highlights the most active services and configurations. Use it to identify hotspots that consume disproportionate resources.
Service Top N Dashboard
| Metric | What it measures | What to look for |
|---|---|---|
| Number of service providers TopN | Services with the most provider instances | If a single service dominates, evaluate whether it should be split into smaller services. |
| Number of service subscribers TopN | Services with the most subscriber instances | Excessive subscribers on one service increase push overhead. |
| IP Push Failure Times TopN | Client IPs with the most push notification failures | Recurring IPs may indicate specific clients with network or configuration problems. |
Configure TopN Dashboard
| Metric | What it measures | What to look for |
|---|---|---|
| Number of Configuration Changes TopN | Configurations with the most frequent changes | Frequent changes to a single configuration may indicate a misconfigured automation pipeline. |
| Configure the number of listeners TopN | Configurations with the most listeners | Configurations with excessive listeners increase push overhead. Consider splitting the configuration if possible. |
Advanced features
Managed Service for Grafana integration
For advanced observability, click Using Grafana Expert Edition in the upper-right corner to open the Managed Service for Grafana console. This provides multi-tenant Grafana dashboards with additional visualization and alerting options.
Embed monitoring pages
To embed a specific monitoring tab in an external dashboard or portal, click Open in New Window XX (where XX is the tab name) in the upper-right corner. This opens the tab in a standalone page with a shareable URL.
For example, on the Registry Monitoring tab, click Open in New Window Registry Monitoring to open the registry monitoring view in a separate browser tab.
Use the legacy dashboard
If the Grafana dashboard is not enabled, the legacy dashboard provides a limited set of metrics. To access the full set of monitoring capabilities, upgrade to the Grafana dashboard.
Log on to the MSE console and select a region in the top navigation bar.
In the left-side navigation pane, choose Microservices Registry > Instances.
On the Instances page, click the name of the target instance.
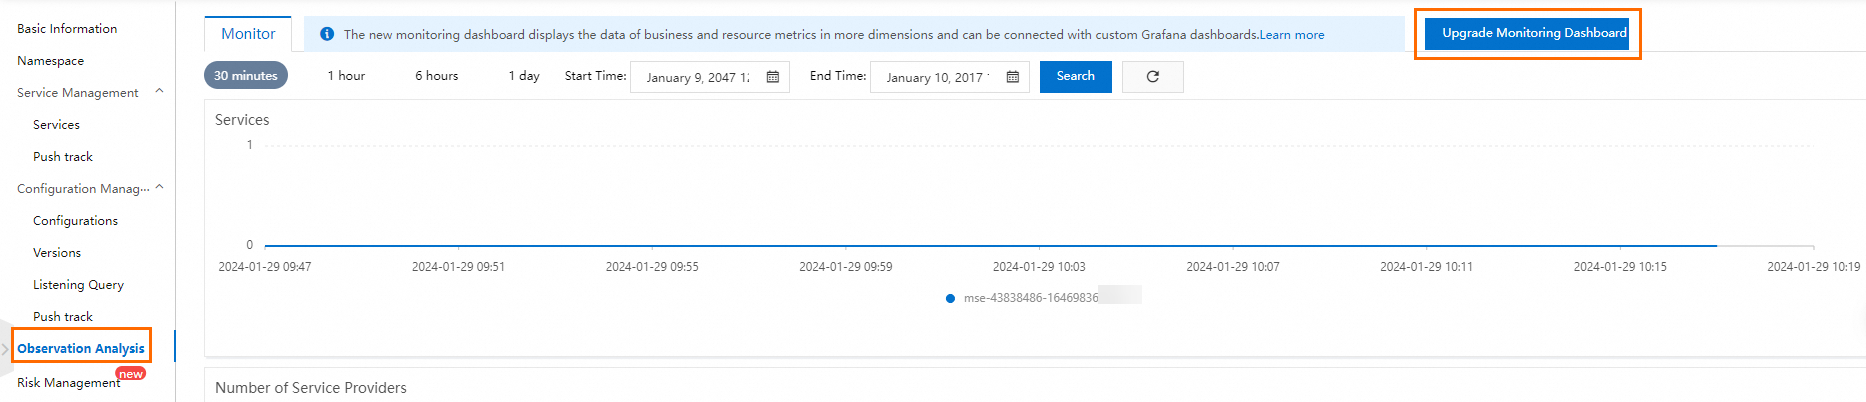
In the left-side navigation pane, click Observation Analysis.
Click the Monitoring tab. The following metrics are displayed:
Metric What it measures Number of services Total registered services Number of service providers Total service provider instances Average response time (RT) of the service write interface (ms) Average write latency in milliseconds
Legacy dashboard controls:
Time range: The default monitoring window is the last 30 minutes. Preset options include Last 30 minutes, Last 1 hour, Last 6 hours, and Last 24 hours. Custom time ranges are also supported.
Node filtering: Monitoring data of three nodes in the engine is displayed in different colors. Click a node name in the chart legend to show or hide that node's data. At least one node must remain visible.
Data granularity: Hover over any point on a chart to see metric values of the three nodes at that moment, accurate to the minute.
Refresh: Click the
icon in the upper-right corner to reload the current data.