After Layer 7 access logs of Server Load Balancer (SLB) are collected, you can query and analyze the logs in the Simple Log Service console and view the following information on dashboards: global distribution of client page view (PV), PV trend of request methods, PV trend of status codes, PV heat map of clients, and distribution of status codes.
Background information
SLB is a basic component for most cloud services. In most cases, you need to continuously monitor, detect, diagnose, and configure alerts for SLB. Alibaba Cloud SLB distributes traffic to multiple Elastic Compute Service (ECS) instances to improve the service capabilities of applications. You can use SLB to prevent single point of failures (SPOFs) and support a large number of concurrent web access requests.
The access log management feature of SLB can be applied to HTTP- and HTTPS-based Layer 7 load balancing. For more information, see Log fields. SLB has the following metrics:
Page Views (PVs): the total number of HTTP or HTTPS requests sent by the clients.
Unique Visitors (UVs): the total number of unique requests. Requests initiated by unique visitors from the same client are counted only once.
Request success rate: the percentage of the requests whose status code is 2XX to the total PVs.
Request traffic: the total number of bytes of the request messages that are sent by the clients.
Response traffic: the total number of bytes of the HTTP message bodies that are sent to the clients.
PV heat map: indicates the density of PVs in the regions where the IP addresses of the clients reside.
Prerequisites
Layer 7 access logs of SLB are collected. For more information, see Enable the access log management feature.
View a dashboard
Log on to the Simple Log Service console.
In the Projects section, click the project that you want to manage.

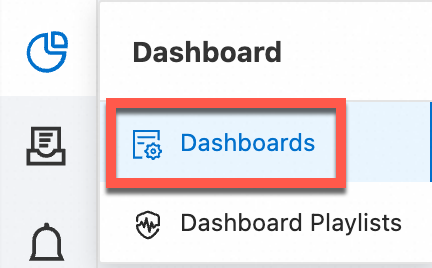
In the left-side navigation pane, move the pointer over the Dashboard icon and click Dashboards.
In the Dashboard list, click the dashboard that you want to manage. The slb-user-log-slb_layer7_operation_center_en and slb-user-log-slb_layer7_access_center_en dashboards are provided for Layer 7 access logs of SLB.
NoteTo view the query statement of a chart, you can find the chart on the corresponding dashboard and choose in the upper-right corner of the chart.
Basic analysis
Use the filter to specify an SLB instance and view the PV and UV trends of the SLB instance. For more information, see Add a filter.

Traffic and latency analysis on the
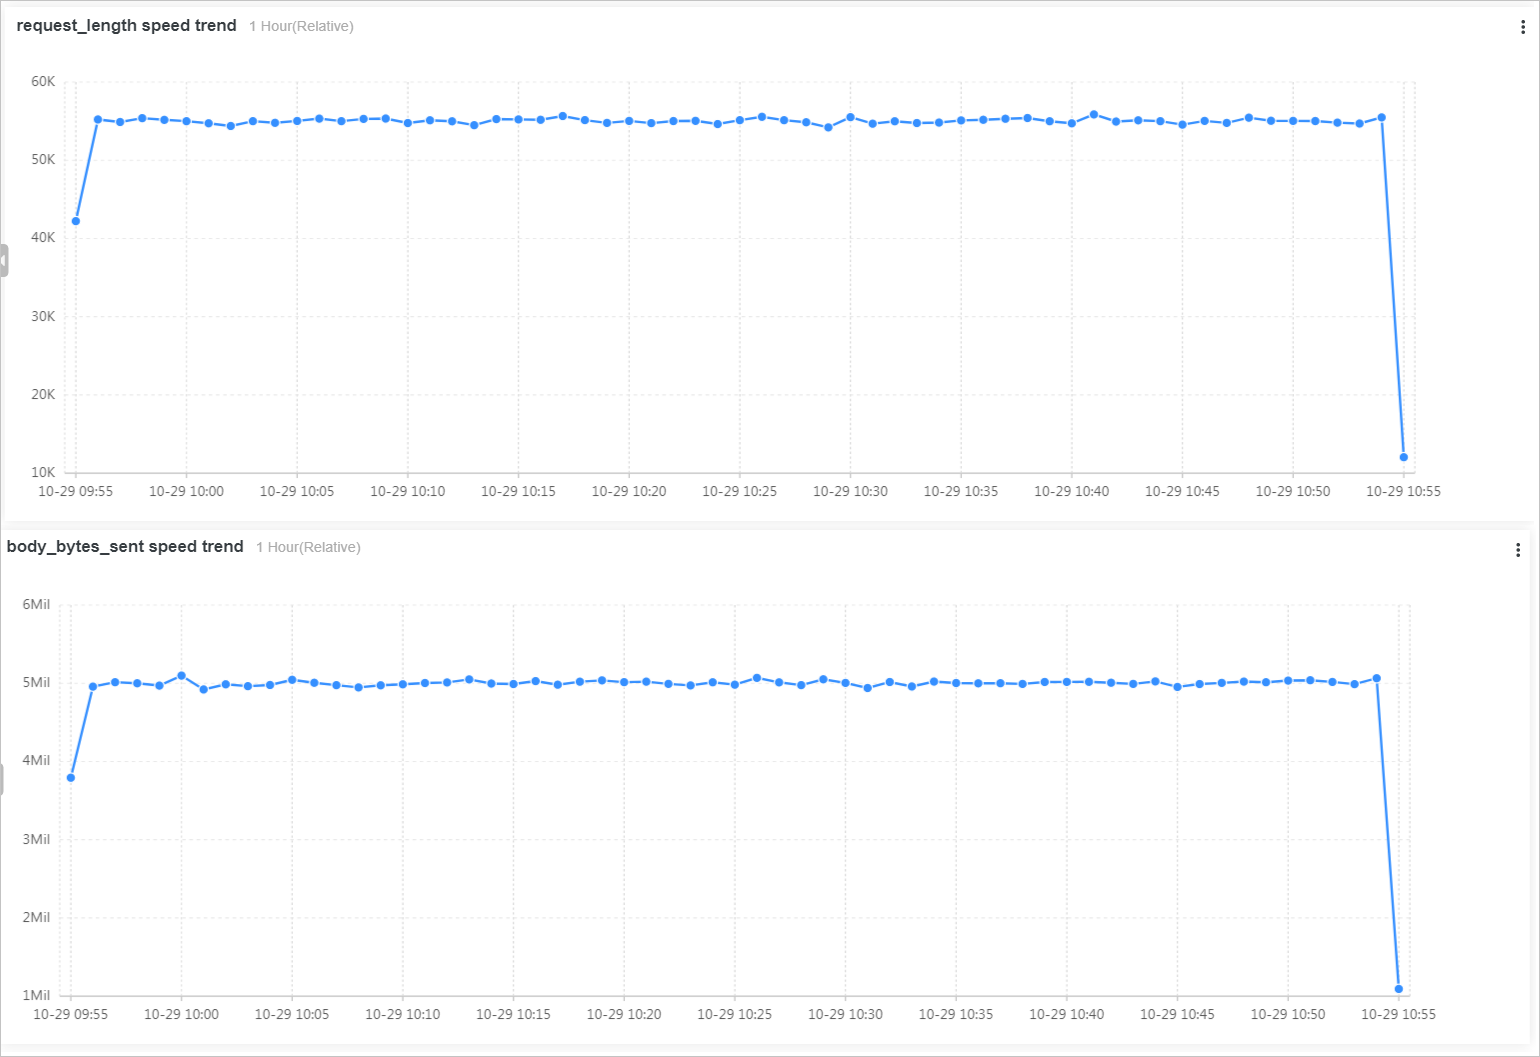
slb_layer7_access_center_cndashboardView the trends of the request traffic and response traffic within a specific period of time.
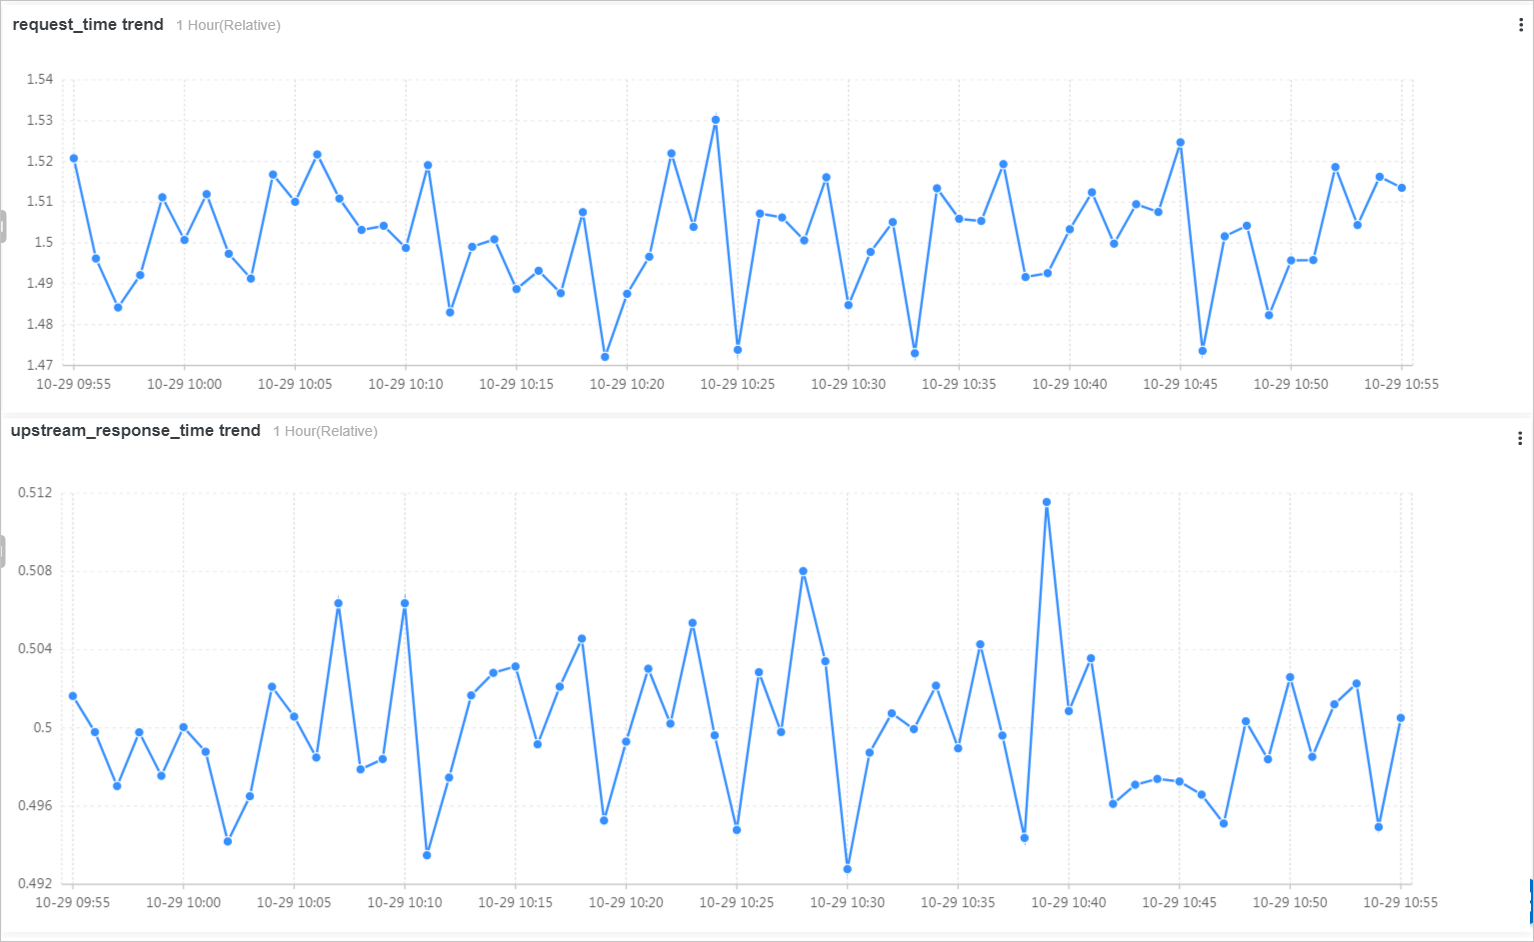
View the trends of the response time and upstream response time within a specific period of time.
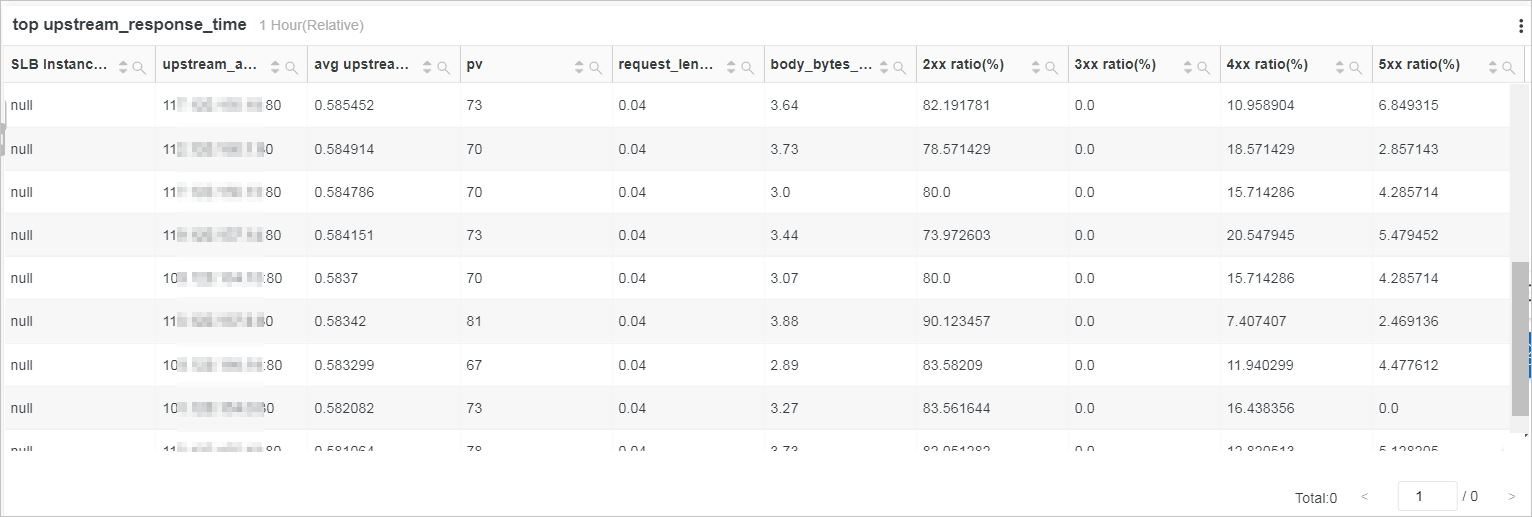
View the trend of high-latency requests within a specific period of time.
User request analysis on the
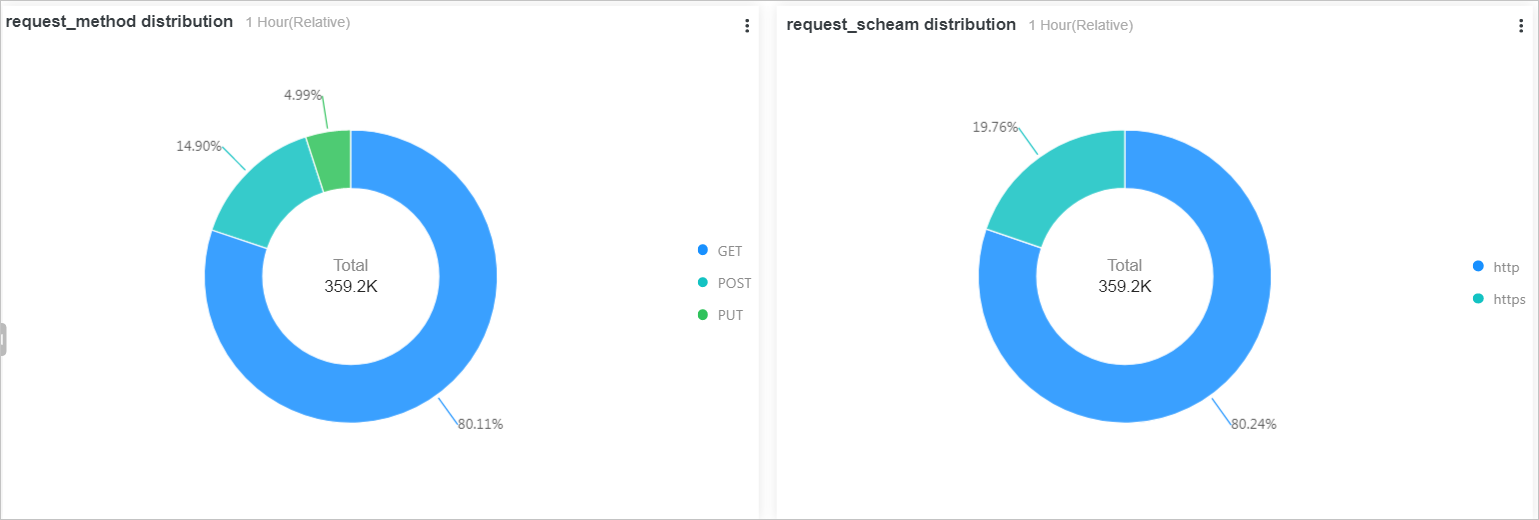
slb_layer7_operation_center_cndashboardView the distribution of the request methods and request protocols within a specific period of time.
View the PV trends of different request methods within a specific period of time.

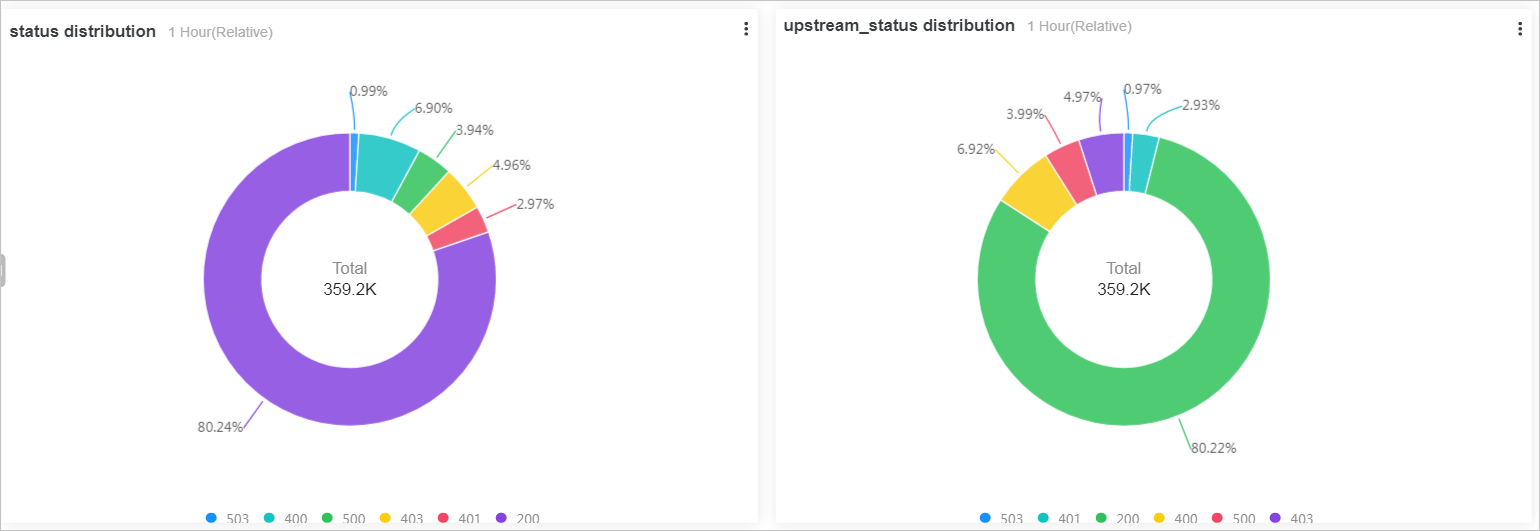
View the distribution of different status codes within a specific period of time.
If a large number of status code 500 are generated, internal errors occur on the backend RealServer.
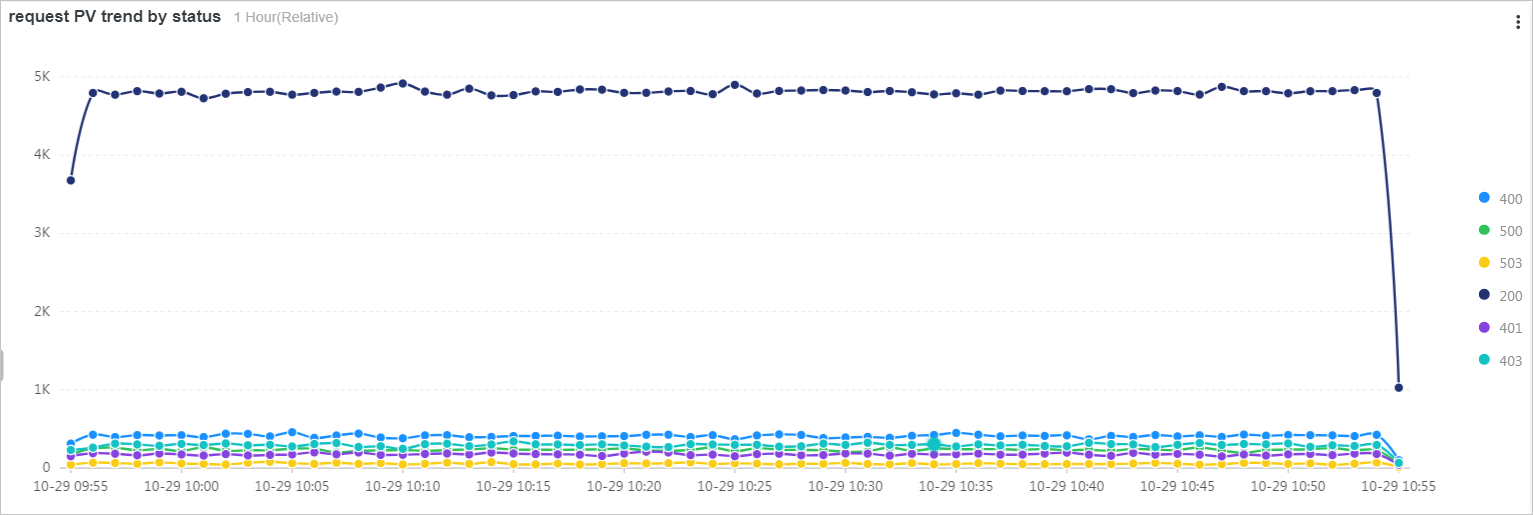
View the PV trends of different status codes in a specific period of time.
Request source analysis
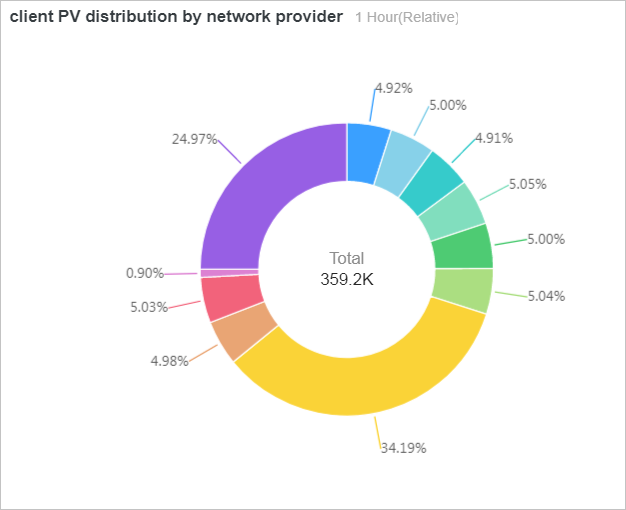
View the distribution of Internet service providers (ISPs).
View the geographic location of clients, such as country, province, and city, by analyzing the IP addresses of the clients.

View the information about a user agent.
The user agent (http_user_agent) can be used to identify who is visiting the website or accessing the service. For example, a search engine uses web crawlers to scan or download website resources. In most cases, web crawlers allow the search engine to update website content in a timely manner and facilitate website promotion and search engine optimization (SEO). If all of the high PV requests are sent from the web crawlers, the service performance may be affected and ECS instance resources may be wasted.

Business analysis
You can use access logs of SLB to analyze service traffic and make business decisions. For example, you can analyze visitor behavior based on the host and URI information to optimize website content.

Analyze request scheduling by using a Sankey diagram
Client traffic is first processed by SLB and then distributed to a RealServer for business logic processing. SLB can detect unhealthy servers and distribute traffic to healthy RealServers. After the unhealthy servers recover, traffic is distributed to them.
Add a listener to the SLB instance to listen to four ECS instances. If an ECS instance whose IP address is 192.168.0.0 acts as a jump server, its performance is four times higher than that of the other three ECS instances. Set the weight of the jumper server (ECS instance) to 100 and set the weight of the other three ECS instances to 20. Run the following query statement to analyze the distribution of request traffic:
* | select COALESCE(client_ip, vip_addr, upstream_addr) as source, COALESCE(upstream_addr, vip_addr, client_ip) as dest, sum(request_length) as inflow group by grouping sets( (client_ip, vip_addr), (vip_addr, upstream_addr))The Sankey diagram shows the load of the four ECS instances. After SLB receives traffic, the traffic is distributed to the four ECS instances based on their respective weights (20, 20, 20, and 100).
 > Preview Query Statement