Telegraf is an open source data collection and monitoring agent that uses plug-ins to build services and collect metrics from third-party components. You can connect Telegraf to LindormTSDB and use the InfluxDB plug-in to report data. This topic describes how to use Telegraf to report data to LindormTSDB.
Prerequisites
The IP address of your client is added to the Lindorm whitelist. For more information, see Configure a whitelist.
An Internet endpoint is enabled for LindormTSDB. For more information, see View the endpoints of LindormTSDB.
Install Telegraf
Choose an installation method that is suitable for your operating system. For more information, see the Telegraf documentation.
Connect to LindormTSDB
Modify the OUTPUT PLUGINS section of the telegraf.conf configuration file.
Enable the outputs.influxdb plug-in by removing the comment symbol (#), and then configure the plug-in for LindormTSDB. For example:
[[outputs.influxdb]]
......
#   ## Multiple URLs can be specified for a single cluster, only ONE of the
#   ## urls will be written to each interval.
urls = ["http://ld-bp1jyu376daqi****-proxy-tsdb-pub.lindorm.aliyuncs.com:8242"]
......
database = "default"
......
## HTTP Basic Auth
username = "test"
password = "test"
Parameter description
Parameter | Description |
urls | The public HTTP Endpoint for LindormTSDB. For more information about how to obtain the endpoint, see View endpoints. |
database | The database to connect to. |
username | The username and password to connect to LindormTSDB. Note If authentication is not enabled for the Lindorm instance, you do not need to specify the username and password parameters. For more information about how to enable authentication, see Enable user authentication and permission verification. |
password |
For more information about other configuration items, see the Telegraf online documentation.
Data Reporting
Start the Telegraf service. The following command is an example for the Linux operating system:
sudo systemctl start telegrafAfter Telegraf starts, it automatically reports data using the InfluxDB line protocol. For more information about how to write data using the line protocol, see Write data using the line protocol.
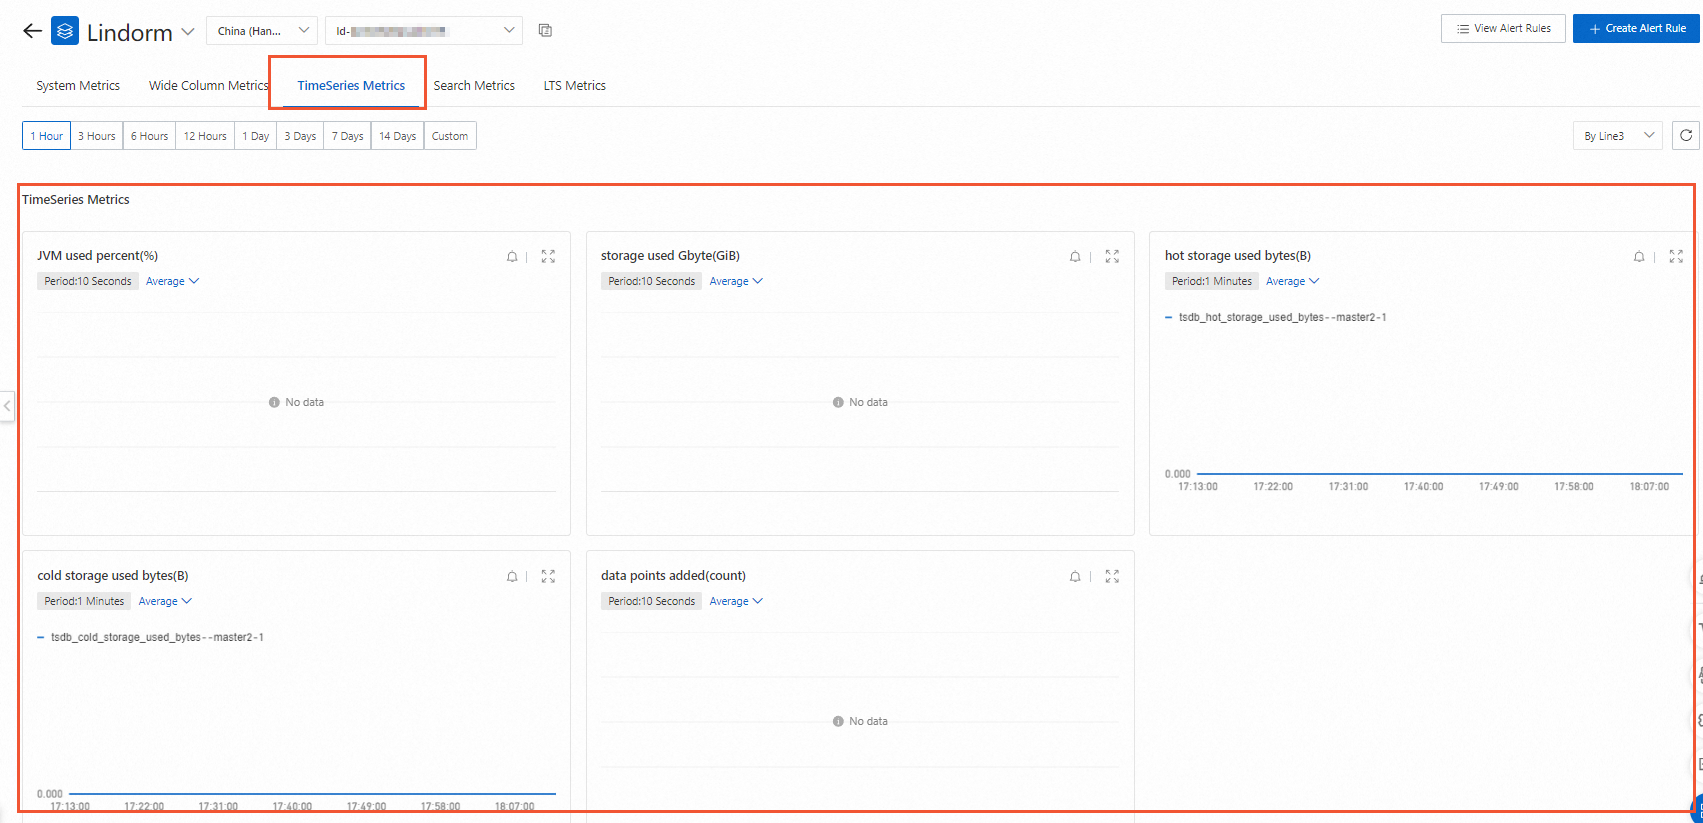
Monitor data
View the data write metrics in the Cloud Monitor console.
Log on to the Lindorm console. In the upper-left corner of the page, select the region of the instance. On the Instances page, click the ID of the target instance or click View Instance Details in the Actions column for the instance.
In the navigation pane on the left, click Instance Monitoring.
At the top of the Instance Monitoring page, click CloudMonitor.
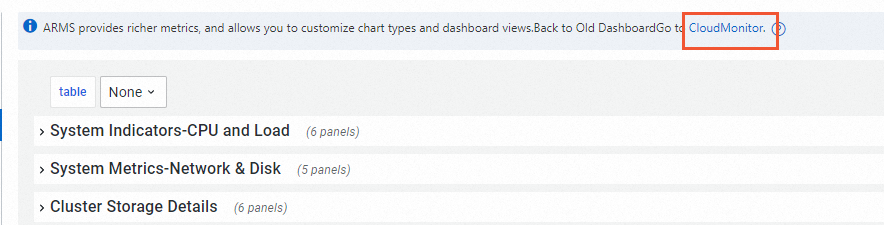
On the Cloud Monitor page, view the metrics related to LindormTSDB.