This guide describes how to centralize MySQL error and slow query logs in Alibaba Cloud Elasticsearch using Filebeat. By the end of this tutorial, you will be able to visualize database performance and errors through pre-built Kibana dashboards.
Workflow overview
Prepare environment: Set up Elasticsearch and ECS.
Configure MySQL: Enable logging on the source database.
Deploy Filebeat: Install and configure the MySQL module to ship logs.
Visualize: Use Kibana to analyze the data.
Prerequisites
Alibaba Cloud Elasticsearch Cluster: V6.7.0 (Standard Edition) is used in this example. Create an Alibaba Cloud Elasticsearch cluster.
Alibaba Cloud ECS Instance: Running CentOS. Custom launch.
Network: Ensure the ECS instance and Elasticsearch cluster can communicate (ideally within the same VPC).
Step 1: Install and configure MySQL
Connect to your ECS instance and follow these steps to ensure MySQL is generating logs that Filebeat can read.
This guide uses a common user as an example.
Connect to the ECS instance.
Install MySQL.
wget http://repo.mysql.com/mysql-community-release-el7-5.noarch.rpm
sudo rpm -ivh mysql-community-release-el7-5.noarch.rpm
sudo yum install mysql-server
Enable logging.
NoteBy default, the configuration of log files in MySQL is disabled. You must manually enable the log file configuration. You can also enable temporary slow logs by running a MySQL command.
Edit
/etc/my.cnfto enable slow query and error logs.sudo vim /etc/my.cnfAdd the following under the respective sections:
[mysqld]
log_queries_not_using_indexes = 1
slow_query_log=on
slow_query_log_file=/var/log/mysql/slow-mysql-query.log
long_query_time=0

[mysqld_safe]
log-error=/var/log/mysql/mysqld.log
Parameter
Description
log_queries_not_using_indexesSpecifies whether to record a query for which no indexes are specified as a slow query log. The value 1 indicates that the system records a query for which no indexes are specified as a slow query log. The value 0 indicates that the system does not record a query for which no indexes are specified as a slow query log.
slow_query_logSpecifies whether to enable slow query logs. The value on indicates that slow query logs are enabled. The value off indicates that slow query logs are disabled.
slow_query_log_fileSpecifies the storage path of slow query logs.
long_query_timeSpecifies the time threshold used to define a slow query log. Unit: seconds. When the query time exceeds the threshold, the MySQL database writes the query into the file that is specified by
slow_query_log_file.ImportantFor the convenience of the test, the value of this parameter is set to 0. You can specify this parameter as needed.
Initialize log files.
MySQL 5.6+ may not create these files automatically. Create them and set read permissions:
sudo mkdir /var/log/mysql
sudo touch /var/log/mysql/mysqld.log
sudo touch /var/log/mysql/slow-mysql-query.log
sudo chmod 644 /var/log/mysql/*.log
Start MySQL.
sudo systemctl start mysqld
sudo systemctl status mysqld
Step 2: Install and configure Filebeat
Filebeat uses a dedicated MySQL module to parse logs into structured JSON before sending them to Elasticsearch.
Log on to the Kibana console of the Elasticsearch cluster.
In the left navigation menu, click Logs.
Click View setup instructions.
On the Add Data to Kibana page, click MySQL logs.
On the Self Managed page, click RPM.
NoteThe Linux operating system is used in this topic. Therefore, RPM is selected. You can select an appropriate installation method based on your operating system.
Install Filebeat on the ECS instance as prompted.
Configure the MySQL module.
Enable the MySQL module and specify the log paths.
sudo filebeat modules enable mysql
sudo vim /etc/filebeat/modules.d/mysql.yml
Update the configuration.
- module: mysql
  # Error logs
  error:
    enabled: true
    var.paths: ["/var/log/mysql/mysqld.log"]
    # Set custom paths for the log files. If left empty,
    # Filebeat will choose the paths depending on your OS.
    #var.paths:

  # Slow logs
  slowlog:
    enabled: true
    var.paths: ["/var/log/mysql/slow-mysql-query.log"]
    # Set custom paths for the log files. If left empty,
    # Filebeat will choose the paths depending on your OS.
    #var.paths:
Parameter
Description
enabledSet this parameter to
true.var.pathsSet this parameter to the path of the log file. The path must be the same as the path that is specified in the MySQL configuration file. For more information, see Step 1: Install and configure MySQL.
Configure global settings (filebeat.yml).
Open the filebeat.yml file.
sudo vim /etc/filebeat/filebeat.ymlUpdate the configuration of Filebeat modules.
filebeat.config.modules:
  # Glob pattern for configuration loading
  path: /etc/filebeat/modules.d/mysql.yml

  # Set to true to enable config reloading
  reload.enabled: true

  # Period on which files under path should be checked for changes
  reload.period: 1s
Update the configuration of Kibana.
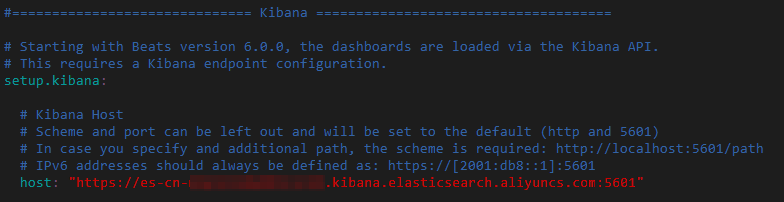
setup.kibana: host: "https://es-cn-0pp1jxvcl000*****.kibana.elasticsearch.aliyuncs.com:5601"host: the URL used to access the Kibana console. You can obtain the URL on the Kibana configuration page. For more information, see View the public endpoint of the Kibana console. Specify the URL in the format of<Public endpoint of the Kibana console>:5601.Modify the Elasticsearch output configuration.
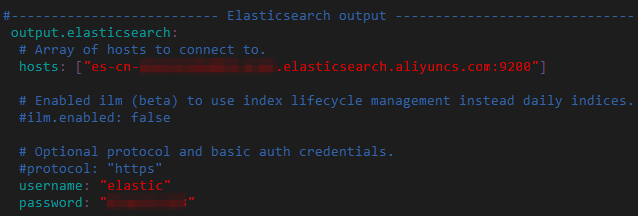
output.elasticsearch:
  # Array of hosts to connect to.
  hosts: ["es-cn-0pp1jxvcl000*****.elasticsearch.aliyuncs.com:9200"]
  # Optional protocol and basic auth credentials.
  #protocol: "https"
  username: "elastic"
  password: "<your_password>"
Parameter
Description
hostsThe endpoint of the Alibaba Cloud Elasticsearch cluster. The format is
<Instance private or public endpoint>:9200. You can obtain the private or public endpoint of the Elasticsearch cluster from the Basic Information page of the instance. For more information, see View the basic information of an instance.NoteIf using the public endpoint, ensure your ECS IP is added to the Elasticsearch IP whitelist. For more information, see Configure a public or private IP address whitelist for an instance.
usernameThe username that is used to access the Elasticsearch cluster. Default value: elastic.
passwordThe password for an instance is typically set when you create it. If you forget the password, you can reset it. For instructions on how to reset the password, see Reset instance access password.
Initialize and start.
Run the setup command to load pre-built dashboards and ingest pipelines into Elasticsearch, then start the service:
sudo filebeat setup
sudo service filebeat start
Step 3: Visualize logs in Kibana
Once Filebeat is running, it automatically ships logs to Elasticsearch.
Restart MySQL to generate error logs or run a few SQL queries.
sudo systemctl restart mysqldLog on to the Kibana console of the Elasticsearch cluster.
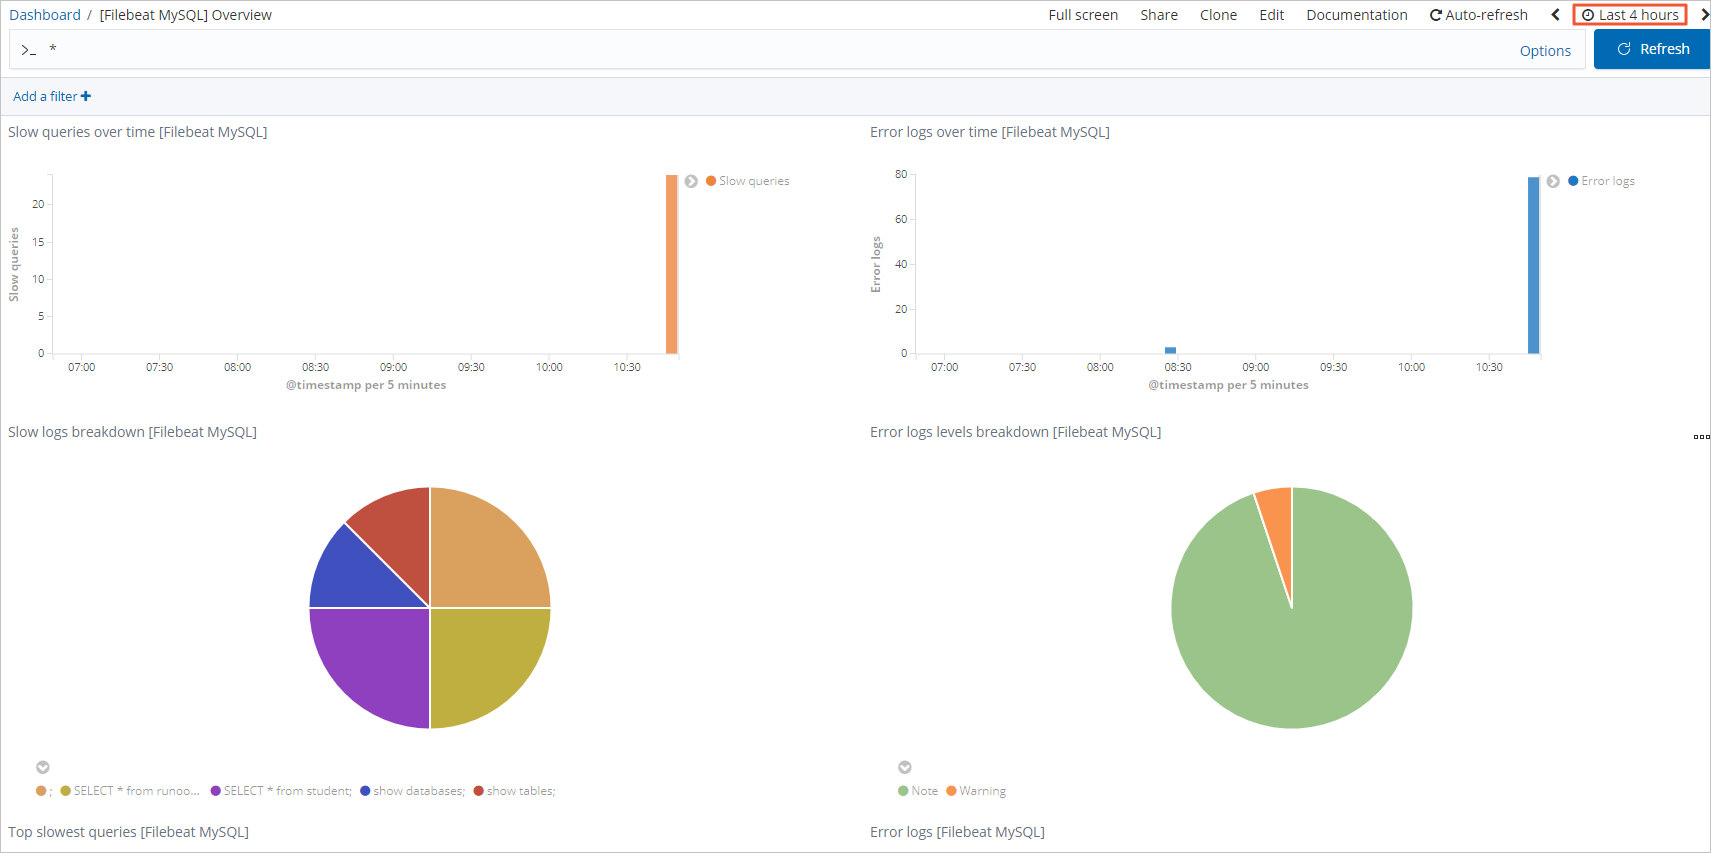
In the left sidebar, click Dashboard.
Search for and select [Filebeat MySQL] Overview.
Select a time range in the upper-right corner and view the logs in the time range.