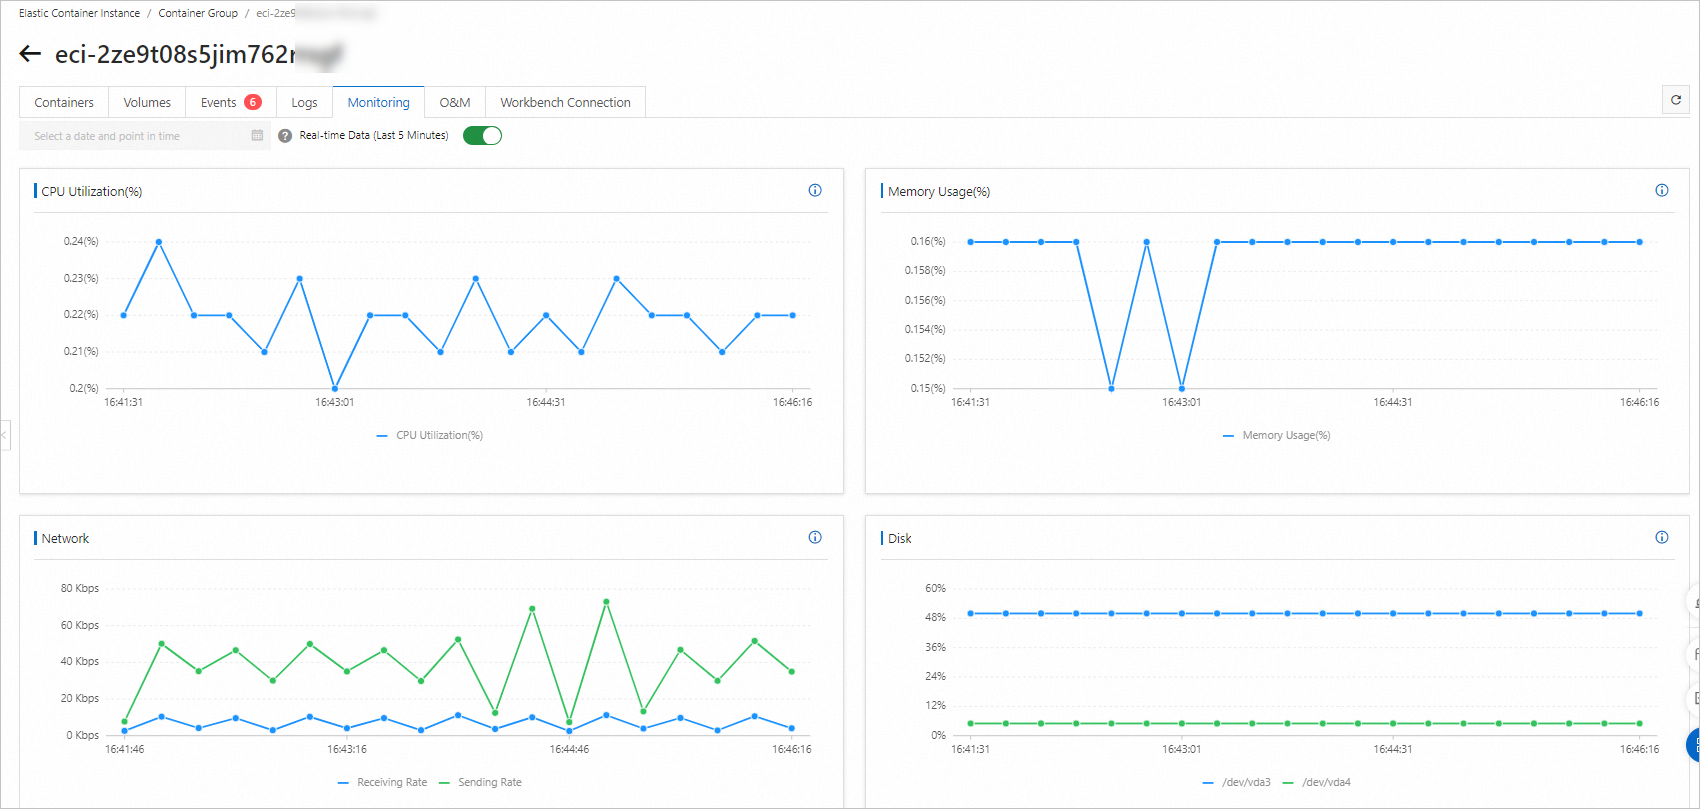
The monitoring data of elastic container instances is displayed in the Elastic Container Instance console. You can view monitoring data such as the metrics related to vCPUs, memory, and network resources. This topic describes the definitions of the monitoring metrics and how each metric is calculated.
Metrics overview
Elastic Container Instance provides real-time monitoring data and historical data. The real-time data shows the metrics of the instance in the last 5 minutes, and the historical data shows the metrics of the instance in the past hour. You can configure monitoring on the following metrics:
CPU utilization
The CPU utilization of the instance. The maximum value is 100%.
Memory usage
The memory utilization of the instance. The maximum value is 100%.
Network
The receipt rate and transmission rate of the instance. The rates are the average values within the time window.
Disk
The partitions and space of the disk:
Disk partitions: includes system partitions and data partitions. Data partitions are partitions of disks that are mounted as data disks.
Disk space: includes the total size of disk space, the size of the used space, the size of the remaining free space, and the disk space utilization.

You can call the DescribeContainerGroupMetric or DescribeMultiContainerGroupMetric API operation to query the monitoring data of one or more elastic container instances, respectively, and then use the monitoring data for secondary development and computing. When you query the monitoring data, the system returns the monitoring data of both the elastic container instance and the containers in the instance.
The Records root node of the returned structure contains the monitoring data of the entire instance, including the data of the vCPUs, disks, memory, and network.
The Containers child node of the returned structure contains the monitoring data of each container, including the data of the vCPUs and memory.
For more information, see DescribeContainerGroupMetric and DescribeMultiContainerGroupMetric.
Calculation methods for vCPUs metrics
When you call the DescribeContainerGroupMetric or DescribeMultiContainerGroupMetric API operation, you can obtain the following raw data of vCPUs.
Parameter | Type | Example | Description |
UsageNanoCores | Long | 0 | The vCPU usage in the sampling window. Unit for the sampling window: nanoseconds. |
UsageCoreNanoSeconds | Long | 70769883 | The cumulative usage of vCPUs. |
Load | Long | 0 | The average load in the last 10 seconds. |
Limit | Long | 2000 | The upper limit of vCPU usage. The calculation formula for this parameter: The number of vCPUs × 1000. |
The vCPU-related metrics are calculated by using the following formulas:
vCPU usage = UsageNanoCores/109
vCPU utilization = UsageNanoCores/Limit/106
Calculation methods for memory metrics
When you call DescribeContainerGroupMetric or DescribeMultiContainerGroupMetric, you can obtain the following raw data of the memory.
Parameter | Type | Example | Description |
AvailableBytes | Long | 4289445888 | The size of the available memory. Unit: bytes. |
UsageBytes | Long | 11153408 | The size of the used memory. Unit: bytes. |
Cache | Long | 7028736 | The size of the cache. Unit: bytes. |
WorkingSet | Long | 5521408 | The usage of the working set. Unit: bytes. |
Rss | Long | 1593344 | The size of the resident memory set, which indicates the size of the physical memory that is actually used. Unit: bytes. |
The memory-related metrics are calculated by using the following formula:
Memory utilization = WorkingSet/(WorkingSet + AvailableBytes)
Calculation methods for network metrics
When you call DescribeContainerGroupMetric or DescribeMultiContainerGroupMetric, you can obtain the following raw data of the network.
Parameter | Type | Example | Description |
TxBytes | Long | 1381805699 | The number of bytes transmitted by the network interface controller (NIC). |
RxBytes | Long | 505001954 | The number of bytes received by the NIC. |
TxErrors | Long | 0 | The number of transmitted packet errors on the NIC. |
RxErrors | Long | 0 | The number of received packet errors on the NIC. |
TxPackets | Long | 5158427 | The number of packets transmitted by the NIC. |
RxPackets | Long | 4800583 | The number of packets received by the NIC. |
TxDrops | Long | 0 | The number of transmitted packets dropped on the NIC. |
RxDrops | Long | 0 | The number of packets that fail to be received. |
Name | String | eth0 | The name of the NIC. |
The network-related metrics are calculated by using the following formulas:
Bandwidth rate: number of bits sent per second. Unit: bit/s.
Bandwidth rate = (The total number of bytes sent at time B - The total number of bytes sent at time A)/Number of seconds between time A and time B × 8
Throughput rate: number of packets sent per second. Unit: pps.
Throughput rate = (The total number of packets sent at time B - The total number of packets sent at time A)/Number of seconds between time A and time B