This topic describes the syntax of color functions. This topic also provides examples on how to use the functions.
The following table describes the color functions that are supported by Simple Log Service.
If you want to use strings in analytic statements, you must enclose the strings in single quotation marks (''). Strings that are not enclosed or strings that are enclosed in double quotation marks ("") indicate field names or column names. For example, 'status' indicates the status string, and status or "status" indicates the status log field.
When you use color functions in the Simple Log Service console, the display of query and analysis results is compromised. To avoid this issue, we recommend that you view the query and analysis results on your server.
Display of query and analysis results in the console

Display of query and analysis results on a server

Function | Syntax | Description | Supported in SQL | Supported in SPL |
bar(x, width) | Returns a part of an ANSI bar chart. You can configure the width parameter to specify the width of the ANSI bar chart. However, you cannot configure the high_color or low_color parameter to specify the colors for the chart. The default values of the high_color and low_color parameters are used. The default value of the low_color parameter is red, and the default value of the high_color parameter is green. In addition, you can configure x to specify the length of the part that is returned by the function. | √ | × | |
bar(x, width, low_color, high_color) | Returns a part of an ANSI bar chart. You can configure the width parameter to specify the width of the ANSI bar chart. You can also configure the high_color and low_color parameters to specify custom colors for the chart. In addition, you can configure x to specify the length of the part that is returned by the function. | √ | × | |
color(string) | Converts a color string to a color type. | √ | × | |
color(x, low, high, low_color, high_color) | Returns a color between high_color and low_color based on the portions of high_color and low_color. The portions are determined by the proportion of x between high and low. | √ | × | |
color(y, low_color, high_color) | Returns a color between high_color and low_color based on the portions of high_color and low_color. The portions are determined by y. | √ | × | |
render(boolean expression) | Returns results by using color rendering. If the Boolean expression evaluates to true, the function returns a green tick. If the Boolean expression evaluates to false, the function returns a red cross. | √ | × | |
render(x, color) | Returns results by using custom color rendering. | √ | × | |
rgb(red, green, blue) | Returns a color value based on an RGB value. | √ | × |
bar function
The bar function returns an ANSI bar chart.
Syntax
If you use the following syntax, the function returns a part of an ANSI bar chart. You can configure the width parameter to specify the width of the ANSI bar chart. However, you cannot configure the high_color or low_color parameter to specify the colors for the chart. The default values of the high_color and low_color parameters are used. The default value of the low_color parameter is red, and the default value of the high_color parameter is green. In addition, you can configure x to specify the length of the part that is returned by the function.
bar(x, width)If you use the following syntax, the function returns a part of an ANSI bar chart. You can configure the width parameter to specify the width of the ANSI bar chart. You can also configure the high_color and low_color parameters to specify custom colors for the chart. In addition, you can configure x to specify the length of the part that is returned by the function.
bar(x, width, low_color, high_color)
Parameters
Parameter | Description |
x | The proportion of the part that is returned by the function to the ANSI bar chart. The value of this parameter is of the double type. Valid values: [0,1]. |
width | The width of the ANSI bar chart. |
low_color | The RGB value of the start color. |
high_color | The RGB value of the end color. |
Return value type
The varchar type.
Examples
Example 1: Obtain a part of an ANSI bar chart based on the proportion of page views (PVs) within a specified hour to the total PVs.
Query statement
* |
SELECT
  Method,
  bar(pv/m,100)
FROM(
    SELECT
      *,
      max(pv) over() AS m
    FROM(
        SELECT
          Method,
          count(1) AS pv
        FROM         internal-operation_log
        WHERE
          __date__ > '2021-09-10 00:00:00'
          AND __date__ < '2021-09-10 01:00:00'
        GROUP BY
          Method
      )
  )
Query and analysis results (console)

Query and analysis results (server)

Example 2: Obtain an ANSI bar chart that is displayed in red and white and has a width of 50.
Query statement
* | SELECT bar(1,50,rgb(255,255,255),rgb(255,0,0))Query and analysis results (console)

Query and analysis results (server)

color function
The color function returns the color that corresponds to a value.
Syntax
If you use the following syntax, the function converts a color string to a color type.
color(string)If you use the following syntax, the function returns a color between high_color and low_color based on the portions of high_color and low_color. The portions are determined by the proportion of x between high and low.
color(x, low, high, low_color, high_color)If you use the following syntax, the function returns a color between high_color and low_color based on the portions of high_color and low_color. The portions are determined by y.
color(y, low_color, high_color)
Parameters
Parameter | Description |
x | The value of this parameter is of the double type. |
y | The value of this parameter is of the double type. Valid values: [0,1]. |
low | The minimum value. The value of this parameter is of the double type. |
high | The maximum value. The value of this parameter is of the double type. |
low_color | The RGB value of the start color. |
high_color | The RGB value of the end color. |
string | The string. Valid values: black, red, green, yellow, blue, magenta, cyan, and white. The value can also be an RGB value in the Cascading Style Sheet (CSS) format. Example: #000. |
Return value type
The color type.
Examples
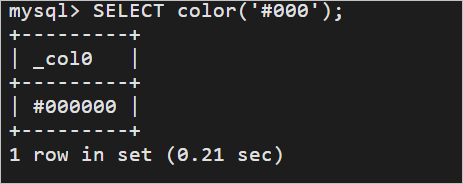
Example 1: Convert a color string to a color type.
Query statement
* | SELECT color('#000')Query and analysis results (console)

Query and analysis results (server)

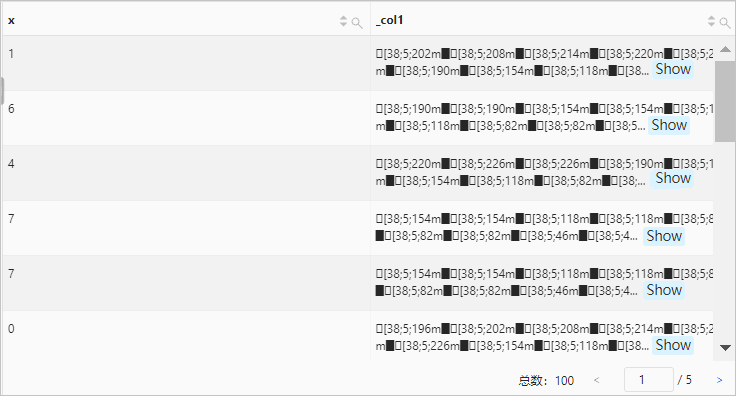
Example 2: Obtain a part of an ANSI bar chart. The remainder of the request_length field value is calculated. Then, the color function returns a color that corresponds to the remainder, and the bar function returns a part of an ANSI bar chart based on the color.
Query statement
*|SELECT x,bar(10,10, color(x, 0,10, rgb(255,0,0), rgb(0,255,0)), rgb(0,255,0)) FROM(SELECT *FROM (SELECT request_length%10 x FROM log))Query and analysis results (console)

Query and analysis results (server)

Example 3: Obtain a part of an ANSI bar chart. The color function returns a color, and the bar function returns a part of an ANSI bar chart based on the color.
Query statement
*|SELECT bar(10,10, color(0.3, rgb(255,255,255), rgb(255,0,0)), rgb(0,255,0))Query and analysis results (console)

Query and analysis results (server)

render function
The render function returns results by using color rendering.
Syntax
If you use the following syntax, the function returns results by using color rendering. If the Boolean expression evaluates to true, the function returns a green tick. If the Boolean expression evaluates to false, the function returns a red cross.
render(boolean expression)If you use the following syntax, the function returns results by using custom color rendering.
render(x, color)
Parameters
Parameter | Description |
boolean expression | The Boolean expression. |
x | The X coordinate. The value of this parameter is of the integer type. |
color | The color. The value of this parameter is of the color type. |
Return value type
The varchar type.
Examples
Example 1: Check whether the number of PVs is less than 1,000. The count function returns the number of PVs, and the render function determines whether the number of PVs is less than 1,000 and returns results by using color rendering. If the number of PVs is less than 1,000, the render function returns a green tick.
Query statement
* | SELECT render(count(*)<1000)Query and analysis results (console)

Query and analysis results (server)

Example 2: Obtain the total number of logs by using green rendering. The count function returns the total number of logs, and the render function returns results by using green rendering.
Query statement
* | SELECT render(count(*),rgb(48,169,16))Query and analysis results (console)

Query and analysis results (server)

rgb function
The rgb function returns a color value based on an RGB value.
Syntax
rgb(red, green, blue)Parameters
Parameter | Description |
red | The portion of red. Valid values: [0,255]. The value of this parameter is of the integer type. |
green | The portion of green. Valid values: [0,255]. The value of this parameter is of the integer type. |
blue | The portion of blue. Valid values: [0,255]. The value of this parameter is of the integer type. |
Return value type
The color type.
Examples
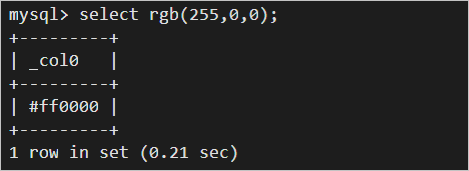
Obtain a color value based on an RGB value.
Query statement
*|SELECT rgb(255,0,0)Query and analysis results (console)

Query and analysis results (server)
