This topic describes the overall layout of the DataStudio page and the features that are related to workflows and nodes for data development. This helps you understand and get started with DataStudio with ease.
Go to the DataStudio page
Log on to the DataWorks console. In the top navigation bar, select the desired region. In the left-side navigation pane, choose . On the page that appears, select the desired workspace from the drop-down list and click Go to Data Development.
On the DataStudio page, you can create workflows and different types of nodes for data development based on your business requirements. For more information, see Create a workflow and DataWorks nodes.
The features for different data development operations vary. The following sections in this topic describe these features:
Overall layout of the DataStudio page: describes the overall layout of the DataStudio page.
Features related to workflows: describes the features related to workflows on the DataStudio page.
Shortcut menu related to workflows: describes the shortcut menu related to workflows on the DataStudio page.
Features related to nodes: describes the features related to nodes on the DataStudio page.
Shortcut menu related to nodes: describes the shortcut menu related to nodes on the DataStudio page.
Overall layout of the DataStudio page
The following figure shows the overall layout of the DataStudio page.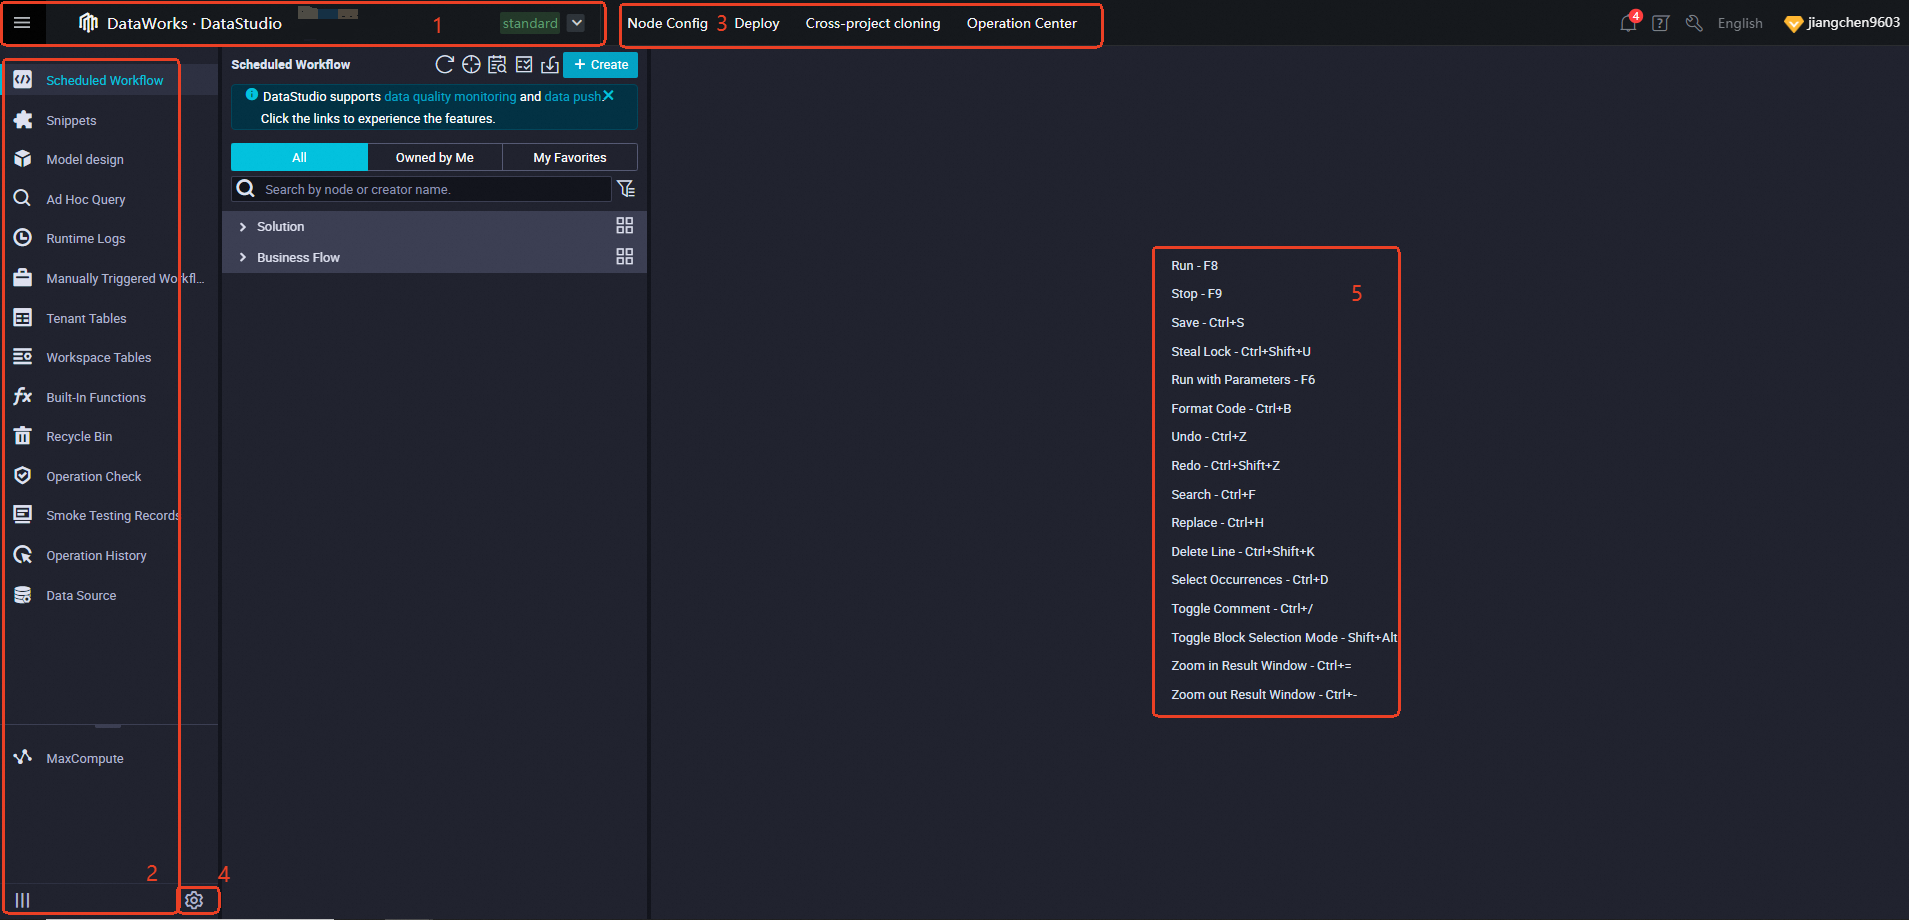
Area | Description |
1 |
|
2 | In this area, you can click the
Note If a specific functional icon is not displayed in the left-side navigation pane, you can click the |
3 | Shortcuts to other services:
Common features of DataWorks services: Note DataWorks services share common features. The following descriptions introduce the common features that are provided by DataWorks on the DataStudio page.
|
4 | After you click the Settings icon in Area 4, you can perform system configurations on the following tabs of the Settings page:
|
5 | This area displays the shortcut keys that are commonly used in the DataStudio editor. For more information, see Editor shortcuts. |
Features related to workflows
By default, the Scheduled Workflow pane appears after you go to the DataStudio page. On the Scheduled Workflow pane, you must create a workflow before you can organize your data development operations. For more information about how to create a workflow, see Create a workflow. The following figure shows the features related to workflows.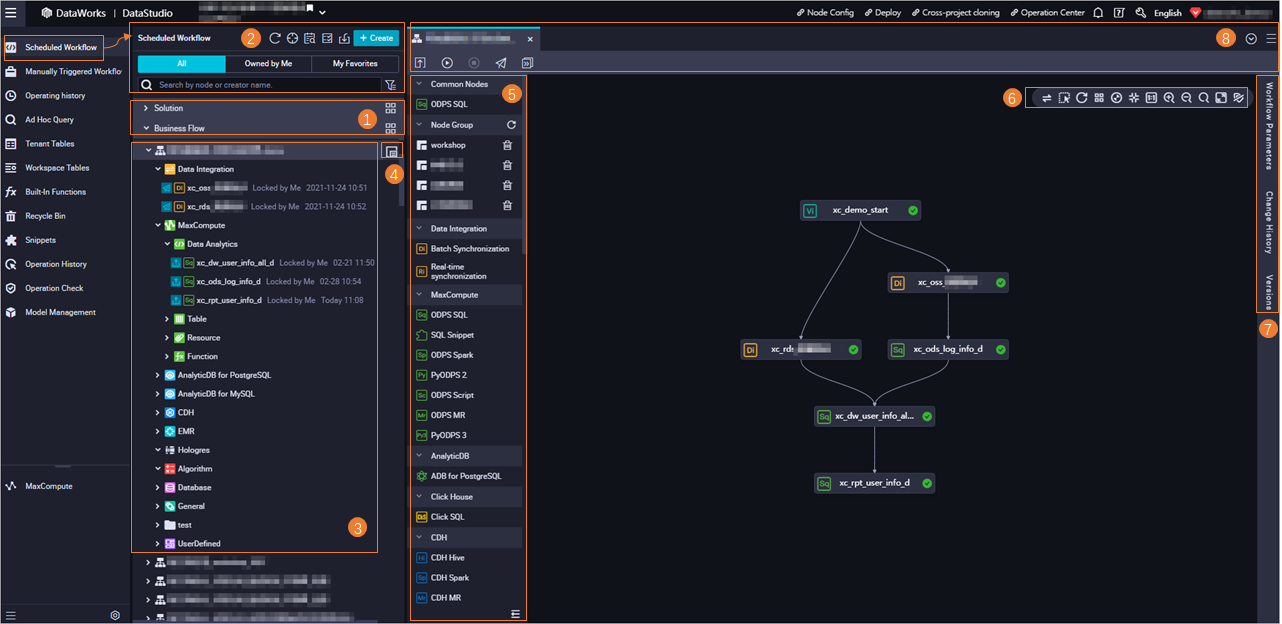
Area | Description |
1 |
Click the |
2 |
Note Before you perform data development operations in a new workspace, you must create a workflow and a node in the workflow. For more information about how to create a workflow, see Create a workflow. |
3 | In this area, you can use a directory tree to manage nodes, tables, resources, and functions in each workflow.
The icon before the name of a node indicates the status of the node:
The last time when the node is edited is displayed after the node name. You can double-click the name of a workflow to go to the configuration tab of the workflow, as shown in Area 5 to Area 8. On this tab, you can perform data development operations. |
4 | Resource Group Orchestration ( |
5 |
|
6 | Tools on the canvas:
|
7 | Tabs in the right-side navigation pane:
|
8 | Tools in the toolbar and tools above the configuration tab:
|
Shortcut menu related to workflows
You can move the pointer over a workflow and right-click the name of the workflow. The following figure shows the shortcut menu that appears, and the following table describes the features supported by the shortcut menu.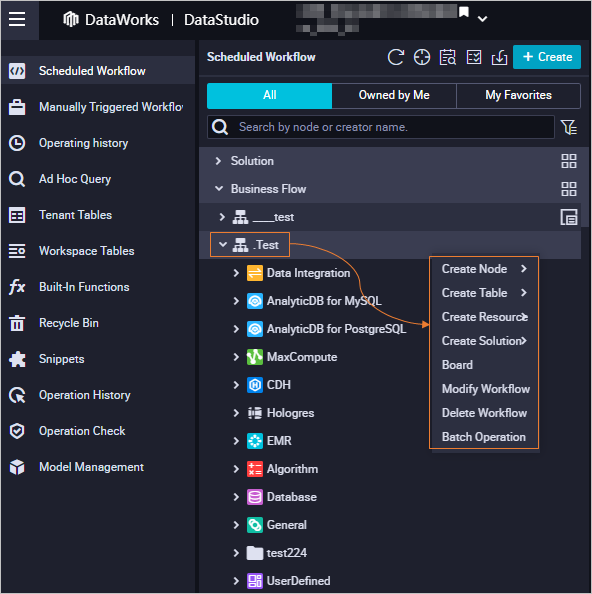
Feature | Description |
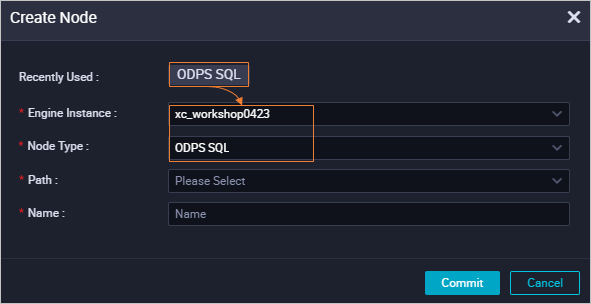
Create Node | This feature allows you to quickly create nodes of different types. When you create a node, the system displays the node types that are recently used. If you click one of the node types, the system configures the Engine Instance and Node Type parameters based on the information about the node that was last used of this type. You can create a node of a type that was recently used by using this method. |
Create Table | This feature allows you to quickly create tables of different types. |
Create Resource | This feature allows you to quickly create resources of different compute engines. Note You can use this feature to create resources of only the MaxCompute, CDH, and EMR compute engines. |
Create Function | This feature allows you to quickly create functions of different compute engines. Note You can use this feature to create functions of only the MaxCompute, CDH, and EMR compute engines. |
Board | This feature navigates you to the canvas of a workflow. |
Change | This feature allows you to modify the name, owner, and description of a workflow. |
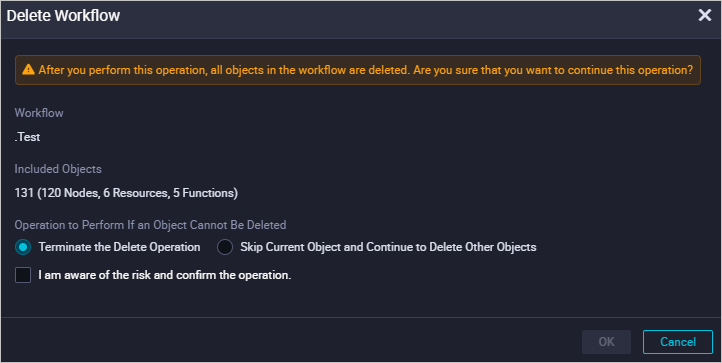
Delete | This feature allows you to delete the current workflow. Note If you perform this operation, all objects in the workflow are deleted. Proceed with caution. The following options are available to cope with situations where an object cannot be deleted:
|
This feature allows you to modify the configurations of multiple nodes, resources, or functions at a time. For example, you can modify the owners, compute engine instances, and scheduling properties of multiple objects at a time. This feature also allows you to commit and deploy multiple modified objects to the production environment at a time. |
Features related to nodes
After you create a workflow, you can create different types of nodes for data development based on your requirements. For more information, see DataStudio. Different types of nodes provide similar features. This section describes the features that are provided by DataWorks on the configuration tab of an ODPS SQL node.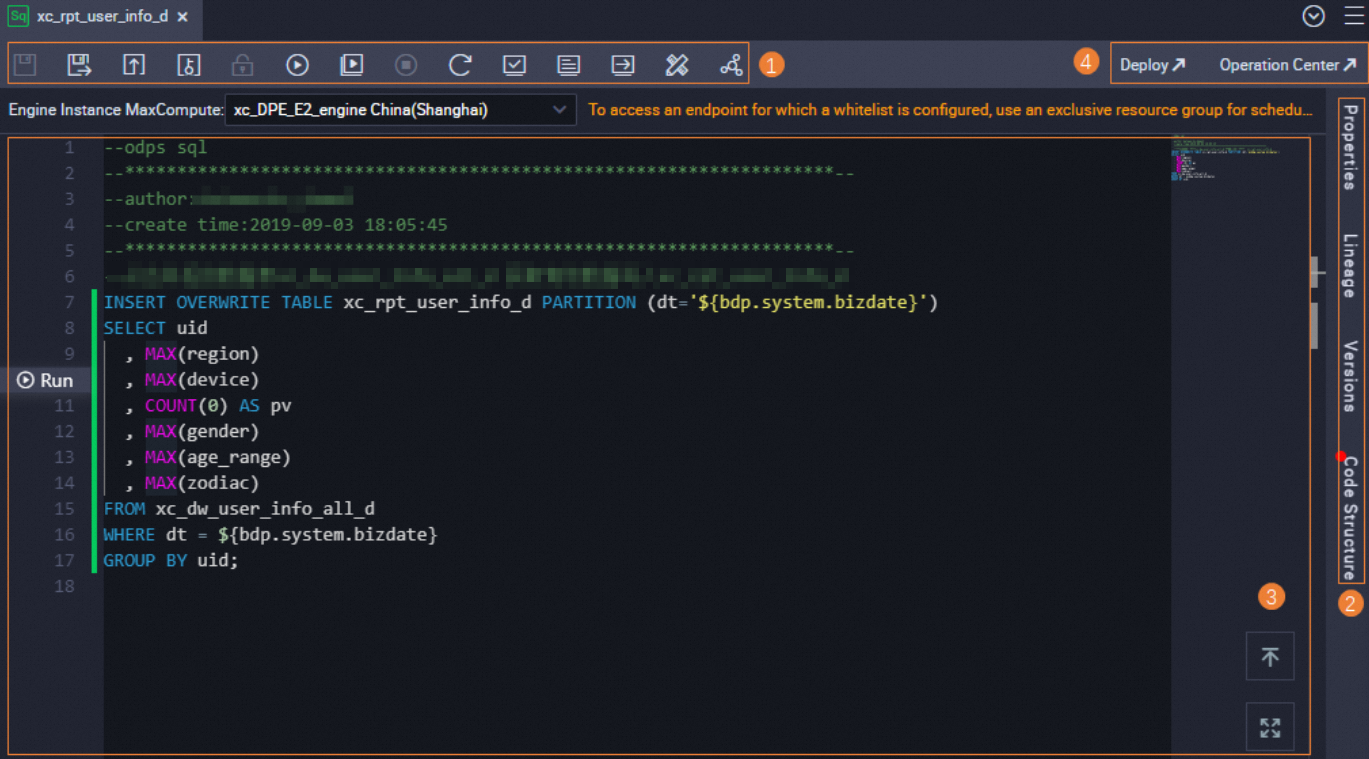
Area | Description |
1 | Node development-related features in the top toolbar:
|
2 | Properties tab:
Lineage tab: This tab displays the dependencies and auto-captured lineage between the current node and other nodes. Versions tab: A version is generated each time a node is committed and deployed. On this tab, you can view the historical versions and information about each version of the node. The information includes the user that committed the node, the time when the node was committed, change type, status, and remarks. The following descriptions provide the different states of a node version:
Code Structure tab: This tab uses SQL operators to display the code structure of the node. |
3 | SQL editor: You can write SQL statements in the editor based on your business requirements.
|
4 | Features in the upper-right corner:
|
Shortcut menu related to nodes
You can move the pointer over a node and right-click the name of the node. The following figure shows the shortcut menu that appears, and the following table describes the features supported by the shortcut menu.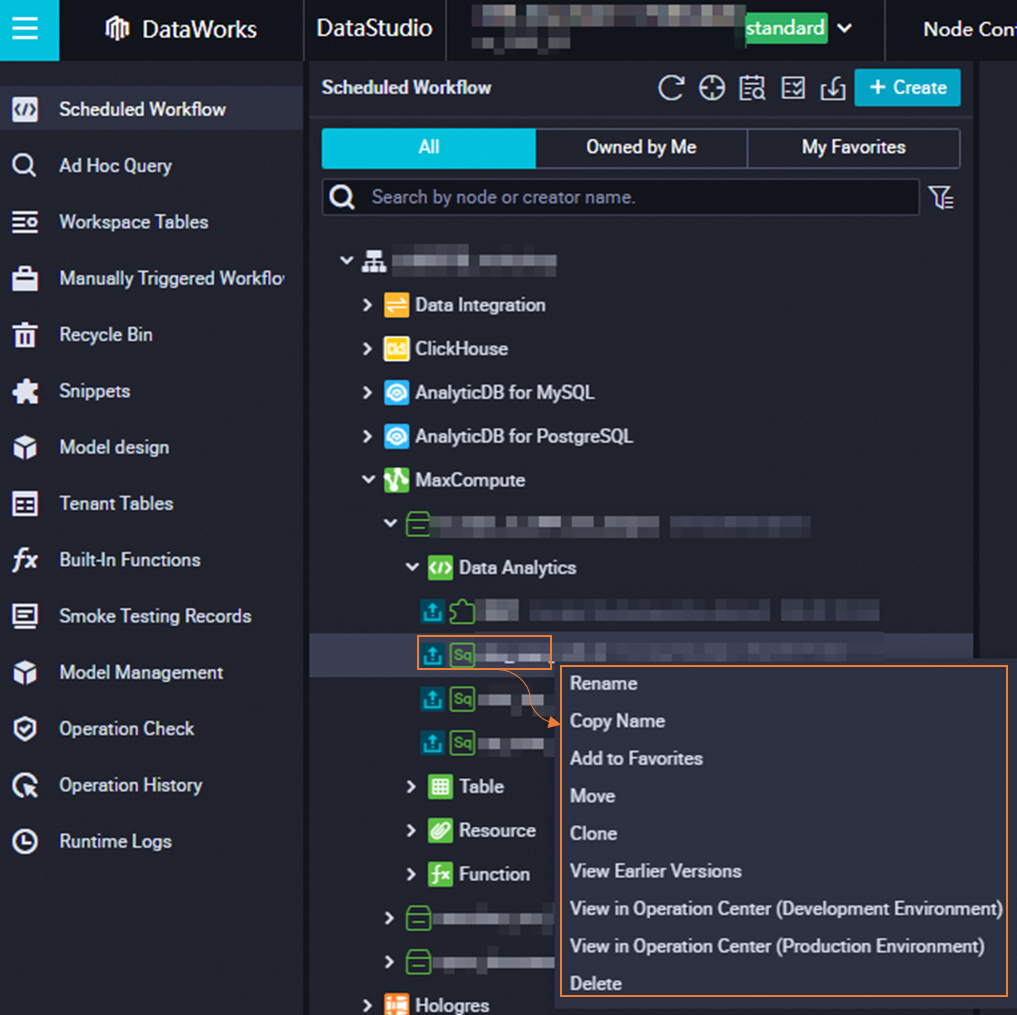
Feature | Description |
Rename | This feature allows you to change the name of the node. |
Add to Favorites | This feature allows you to add the node to favorites. After you add the node to favorites, you can click My Favorites in the upper-right corner of the Scheduled Workflow pane to view the node. If you want to remove the node from favorites, right-click the node name and select Remove from Favorites. |
Move | This feature allows you to move the node to another workflow. |
Clone | This feature allows you to clone the node. The new node is of the same type and has the same owner and resource properties as the original node. Note The new node has a name that is different from that of the original node. |
This feature allows you to view the historical versions and information about each version of the node. The information includes the user that committed the node, the time when the node was committed, change type, status, and remarks. | |
This feature navigates you to Operation Center so that you can view information about the node. If the node is committed to both the development and production environments, you can select View in Operation Center (Production Environment) or View in Operation Center (Development Environment). | |
This feature allows you to commit the code of the node for review. A node that is committed by a developer must pass the code review before the node can be deployed. | |
Delete | This feature allows you to delete the node and the dependency configurations of its ancestor and descendant nodes. After you click Delete to delete a node that has been deployed to the production environment, you must go to the Create Deploy Task page, create a deployment package for the node, and then deploy the node. This way, the node is deleted from the production environment. For more information, see Undeploy nodes. |