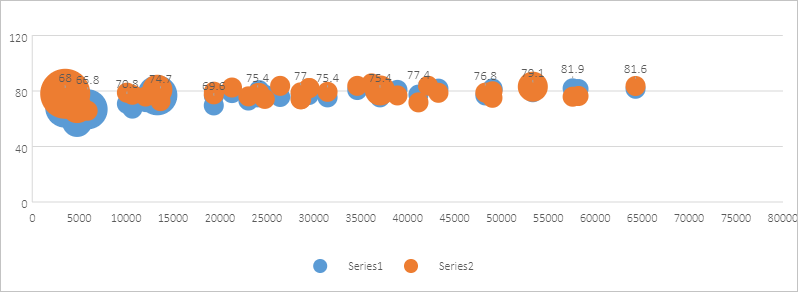
This topic describes the types of scatter charts and their examples.
A scatter chart is often used to display the relationship between the values of variable X and those of variable Y. In a line chart, the X-axis represents different categories. In a scatter chart, the X-axis represents the values of a variable.
A scatter chart consists of a horizontal value axis for variable X and a vertical value axis for variable Y. It combines the values of variable X and those of variable Y to data points and shows them in irregular intervals or clusters. A scatter chart is typically used to show and compare numeric values in scientific, statistical, and engineering data.
You can use a scatter chart to compare values of typically two variables from five dimensions. The color, label, or size of each data point can be used to represent a dimension of values.
Scatter chart
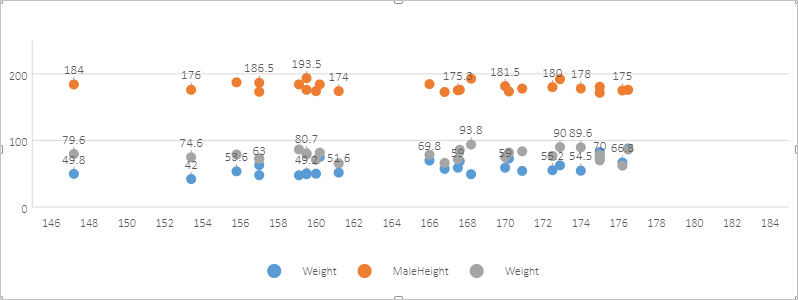
You can use a scatter chart to find out the relationship between variable X and variable Y.
- Sample data
Female Male Height Weight Height Weight 161.2 51.6 174 65.6 167.5 59 175.3 71.8 159.5 49.2 193.5 80.7 157 63 186.5 72.6 155.8 53.6 187.2 78.8 170 59 181.5 74.8 159.1 47.6 184 86.4 166 69.8 184.5 78.4 176.2 66.8 175 62 160.2 75.2 184 81.6 172.5 55.2 180 76.6 170.9 54.2 177.8 83.6 172.9 62.5 192 90 153.4 42 176 74.6 160 50 174 71 147.2 49.8 184 79.6 168.2 49.2 192.7 93.8 175 73.2 171.5 70 157 47.8 173 72.4 167.6 68.8 176 85.9 159.5 50.6 176 78.8 175 82.5 180.5 77.8 166.8 57.2 172.7 66.2 176.5 87.8 176 86.4 170.2 72.8 173.5 81.8 174 54.5 178 89.6 - Sample chart
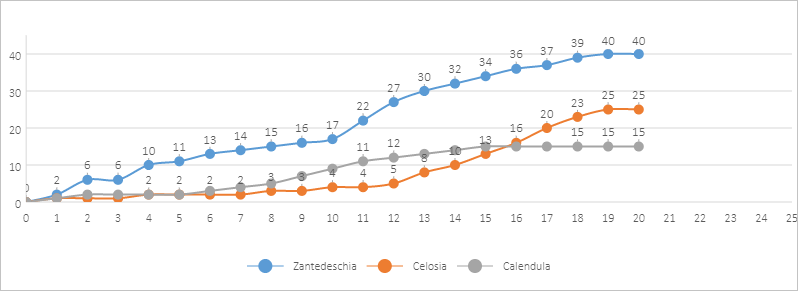
Scatter chart with smooth lines and markers
A scatter chart with smooth lines and markers displays smooth curves that connect data points.
- Sample data
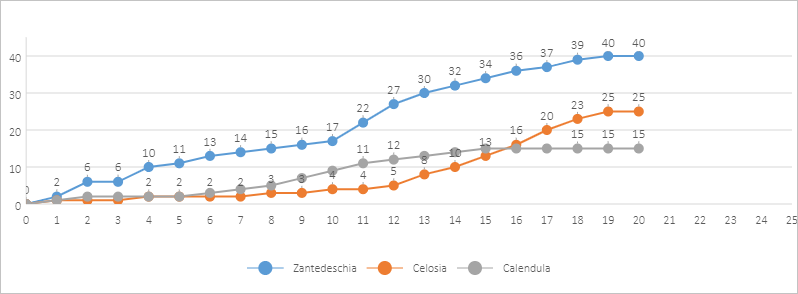
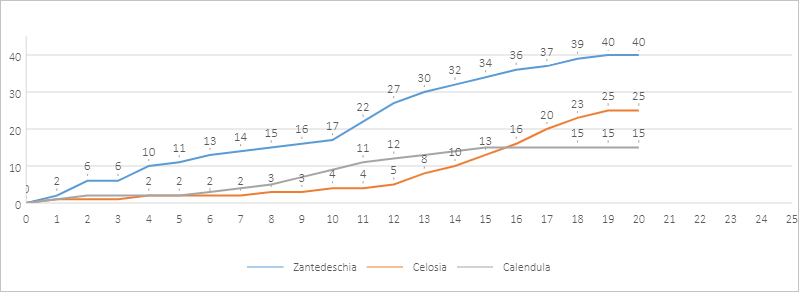
Period Zantedeschia Celosia Calendula 0 0 0 0 1 2 1 1 2 6 1 2 3 6 1 2 4 10 2 2 5 11 2 2 6 13 2 3 7 14 2 4 8 15 3 5 9 16 3 7 10 17 4 9 11 22 4 11 12 27 5 12 13 30 8 13 14 32 10 14 15 34 13 15 16 36 16 15 17 37 20 15 18 39 23 15 19 40 25 15 20 40 25 15 - Sample chart
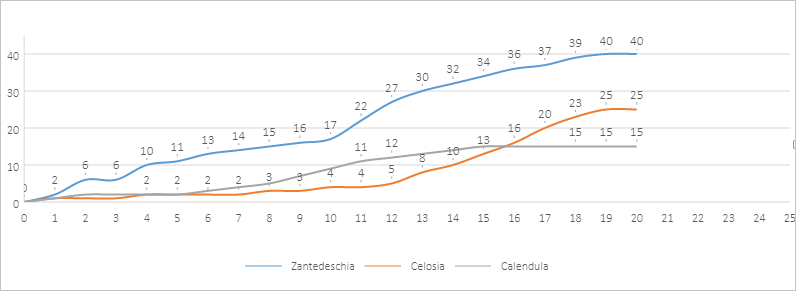
Scatter chart with smooth lines
A scatter chart with smooth lines displays smooth curves that connect data points but does not display markers.
Scatter chart with straight lines and markers
A scatter chart with straight lines and markers displays straight lines that connect data points.
Scatter chart with straight lines
A scatter chart with straight lines displays straight lines that connect data points but does not display markers.
Bubble chart
A bubble chart is a variation of a scatter chart. In a bubble chart, bubbles represent data points and the size of the bubbles represents an additional dimension of data. Similar to a scatter chart, a bubble chart consists of a horizontal value axis for variable X and a vertical value axis for variable Y. Different from the scatter chart, the bubble chart also displays the values of another variable, variable Z, which represents the size of the bubbles.
If your data contains three data series and each series contains a set of values, you can use a bubble chart instead of a scatter chart to display the data. The size of the bubbles is specified by the values in the third data series. A bubble chart is typically used to display financial data. The bubbles in different size bring strong visual impact.
- Sample data
28604 77 17096869 74 67096869 41163 77.4 27662440 71.8 47662440 3516 68 1154605773 78 1654605773 13670 74.7 10582082 72.7 69582082 28599 75 4986705 79 1986705 29476 77.1 56943299 82.1 26943299 31476 75.4 78958237 79.4 98958237 28666 78.1 254830 74.1 954830 4777 57.7 870601776 67.6 570601776 29550 79.1 122249285 82.1 22249285 5076 67.9 20194354 64.9 40194354 12087 72 42972254 76 342972254 24021 75.4 3397534 78.4 1397534 48296 76.8 4240375 78.8 14240375 1088 70.8 38195258 78.7 18195258 19349 69.6 147568552 77.6 234568552 10670 67.3 53994605 77.3 83994605 26424 75.7 57110117 83.7 86110117 37062 75.4 252847810 80.4 652847810 49056 81.8 23968973 79.8 63968973 43294 81.7 35939927 78.7 15939927 13334 76.9 1376048943 80.9 976048943 21291 78.5 11389562 82.5 151389562 38923 80.8 5503457 76.8 1503457 57599 81.9 64395345 75.9 34395345 49053 81.1 80688545 75.1 20688545 42182 82.8 329425 83.8 1329425 5903 66.8 1311050527 65.8 311050527 36162 83.5 126573481 85.5 326573481 4390 71.4 25155317 77.4 55155317 34644 80.7 50293439 83.7 20293439 24186 80.6 4528526 78.6 13528526 64304 81.6 5210967 83.6 3210967 24787 77.3 38611794 74.3 88611794 23038 73.13 143456918 76.13 83456918 19360 76.5 78665830 79.5 58665830 58225 81.4 64715810 76.4 84715810 53354 79.1 321773631 83.1 721773631 - Sample chart
