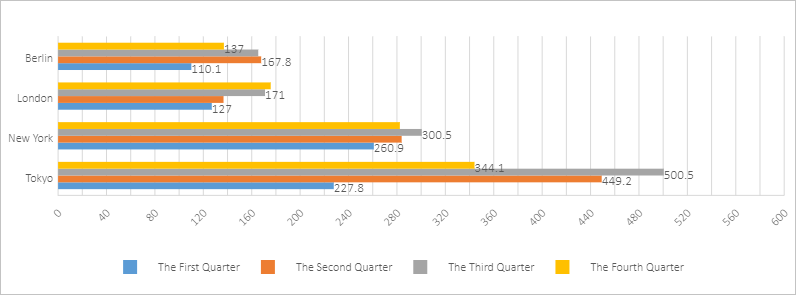
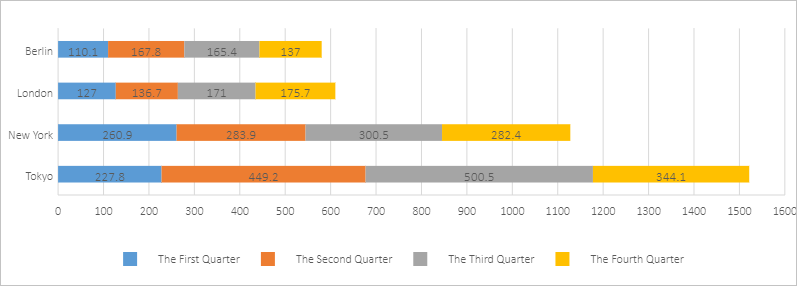
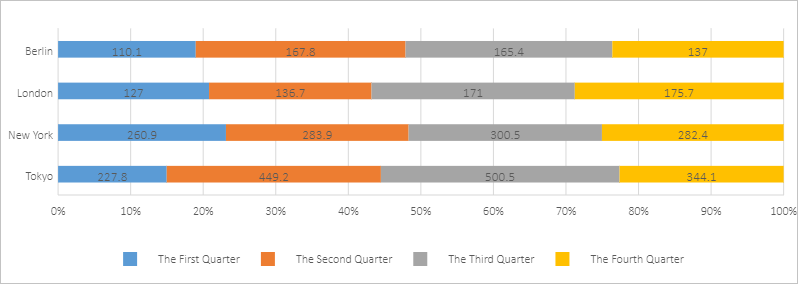
This topic describes the types of horizontal bar charts and their examples.
A horizontal bar chart shows comparisons between categories. A horizontal bar chart consists of a vertical axis that represents categories and a horizontal axis that represents values. You can rank the categories based on a specified order and highlight the top three or five categories. For example, you can use a horizontal bar chart to display the sales of popular commodities in the retail industry.
This topic uses the sample data listed in the following table to show different types
of horizontal bar charts.
| Tokyo | New York | London | Berlin | |
|---|---|---|---|---|
| The First Quarter | 227.8 | 260.9 | 127 | 110.1 |
| The Second Quarter | 449.2 | 283.9 | 136.7 | 167.8 |
| The Third Quarter | 500.5 | 300.5 | 171 | 165.4 |
| The Fourth Quarter | 344.1 | 282.4 | 175.7 | 137 |
- Horizontal bar chart

- Stacked horizontal bar chart

- 100% stacked horizontal bar chart


