You can select metrics from a namespace, create monitoring charts based on your business requirements, and display monitoring charts on a dashboard.
Prerequisites
A namespace is created. For more information, see Create a namespace.
The metrics of a data center, an Alibaba Cloud service, or a third-party cloud service are imported into Cloud Monitor. For more information, see Create a metric import task for a self-managed data center, Create a metric import task within an Alibaba Cloud account, Create a metric import task for multiple Alibaba Cloud accounts, or Create a metric import task for cloud services of a third-party provider.
Procedure
Log on to the Cloud Monitor console.
In the left-side navigation pane, choose .
On the Dashboards page, click View Dashboard in the upper-left corner.
In the left-side navigation pane of the dashboard, click the
 icon. Then, click Add an empty panel.
 On the Edit Panel page, configure metrics and monitoring charts.
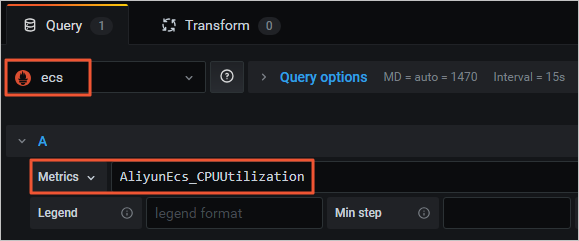
On the Query tab, select the namespace and then select metrics.

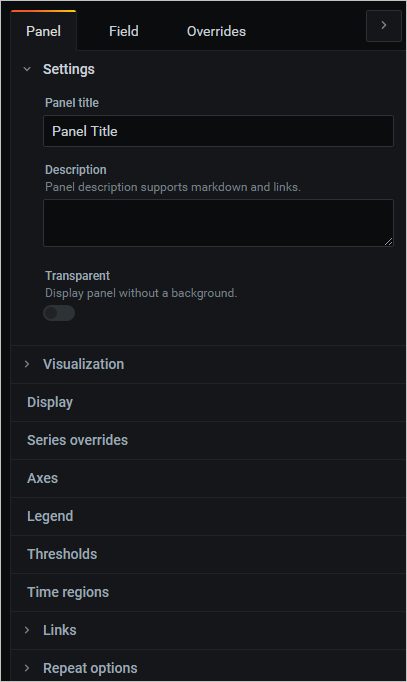
On the Panel tab in the upper-right corner, specify a panel title and enter a description. Then, configure visualization and other settings.

In the upper-right corner of the Edit Panel page, click Apply.
The monitoring chart is created.
In the upper-right corner, click the
 icon. Then, specify the name of the dashboard and the directory in which the dashboard resides.
 Click Save.
The dashboard is created.
In the left-side navigation pane of the dashboard, choose to view the dashboard.
 > Manage