When traffic flows through Service Mesh (ASM) ingress and egress gateways, you need visibility into request volume, latency, and error rates to detect issues and optimize performance. ASM gateways produce Envoy-based monitoring metrics that you can collect to a monitoring backend for storage, querying, and visualization.
Metrics generation and metrics collection are independent features that you enable separately:
| Feature | What it does | When to use |
|---|---|---|
| Metrics generation | The gateway produces metrics locally. You choose which metrics to generate and customize them. | Always required. Without generation, no metrics exist. |
| Metrics collection | Generated metrics are scraped by the Prometheus agent and sent to Managed Service for Prometheus. | Enable when you need centralized storage, dashboards, or alerting. |
You can enable generation without collection if you only need local observability through the gateway's metrics endpoint. Enable both to build dashboards and alerts in Managed Service for Prometheus.
Prerequisites
Before you begin, make sure that you have:
Managed Service for Prometheus activated for your Alibaba Cloud account. See Activate ARMS
The Prometheus agent installed in the Container Service for Kubernetes (ACK) cluster. See Create a Prometheus instance to monitor an ACK cluster
Collecting metrics to Managed Service for Prometheus may incur charges. For billing details, see Billing overview.
Enable metrics generation
Configure which metrics the ASM gateway generates and customize them to match your observability requirements.
For detailed configuration steps, see Customize metrics in ASM.
Collect metrics to Managed Service for Prometheus
After enabling metrics generation, set up the Prometheus agent to scrape metrics from the ASM gateway and send them to Managed Service for Prometheus for centralized storage and querying.
For detailed configuration steps, see Collect metrics to Managed Service for Prometheus.
View gateway metrics in the ASM console
After both generation and collection are enabled, view the metrics in the ASM console:
Log on to the ASM console.
In the left-side navigation pane, choose Service Mesh > Mesh Management.
On the Mesh Management page, click the name of the ASM instance.
In the left-side navigation pane, choose ASM Gateways > Ingress Gateway or ASM Gateways > Egress Gateway.
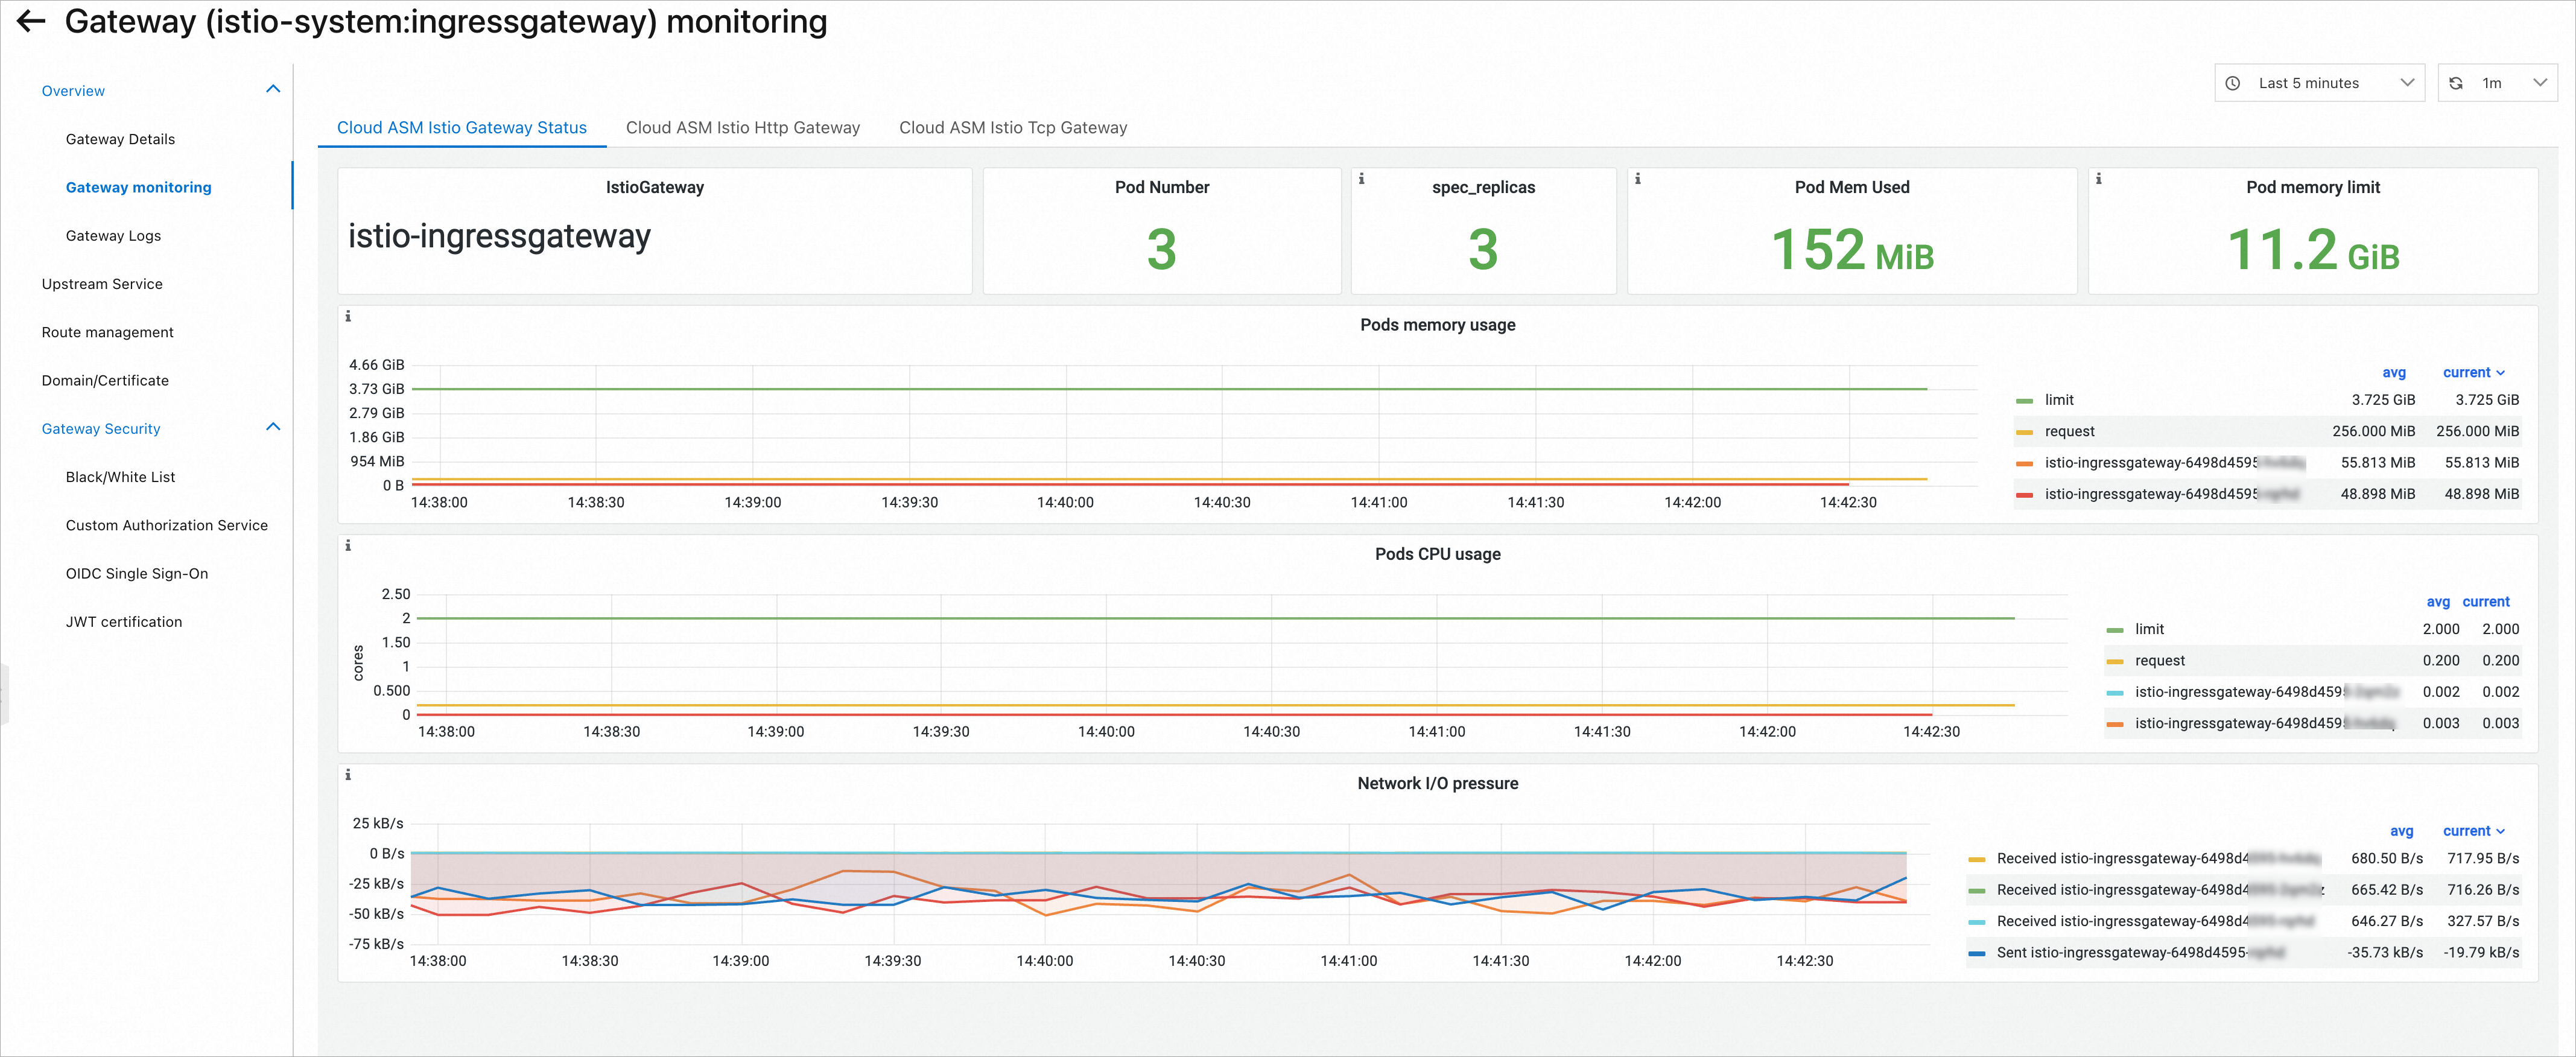
In the Observability section of the gateway, click Gateway monitoring.
The following figure shows sample monitoring data for an ingress gateway.
Related topics
Customize metrics in ASM -- Select and customize the metrics that the gateway generates.
Collect metrics to Managed Service for Prometheus -- Configure scraping of generated metrics into Managed Service for Prometheus.