This topic describes how to configure third-party remote write URLs in Managed Service for Prometheus.
Step 1: Obtain a third-party remote write URL
If you want to configure a third-party remote write URL in Managed Service for Prometheus, the URL must meet the requirements for time-series data formats and authentication. If authentication is not enabled, you can ignore the relevant parameters. In this section, a Prometheus instance is used as an example to describe how to obtain a public remote write URL.
- Log on to the ARMS console.
- In the left-side navigation pane, choose .
- Click the name of the Prometheus instance that you want to manage. In the left-side navigation pane of the page that appears, click Settings.
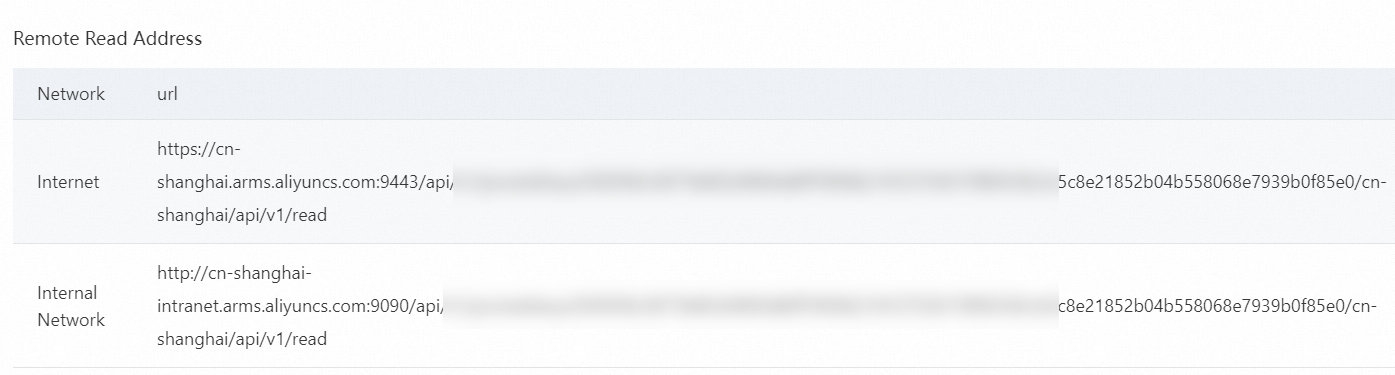
- On the Settings tab, obtain the public remote write URL.
Step 2: Configure the remote write URL
On the Settings tab, click Edit Prometheus.yaml. In the dialog box that appears, set the remote_write parameter (marked 1 in the figure) based on the YAML format. 
Important Set the
url parameter to the public remote write URL obtained in Step 1. You can also choose whether to set the write_relabel_configs parameter (marked 2 in the figure) based on your needs. You can configure multiple remote write URLs to write data to multiple destinations.
remote_write:
  - url: <remoteWriteAddress-1>
    basic_auth:
      username: "***"
      password: "***"
    remote_timeout: 30s
    write_relabel_configs:
      - source_labels: [__name__]
        separator: ;
        regex: service_availiable_record_test
        replacement: $1
        action: keep
  - url: <remoteWriteAddress-2>
    basic_auth:
      username: "***"
      password: "***"
    remote_timeout: 30s
    write_relabel_configs:
      - source_labels: [ __name__ ]
        separator: ;
        regex: service_availiable_record_test
        replacement: $1
        action: keep
Step 3: View the remote write data
- Log on to the ARMS console.
- In the left-side navigation pane, choose .
- Click the name of the Prometheus instance that you want to manage. In the left-side navigation pane of the page that appears, click Dashboards.
- On the Dashboards page, click the Prometheus Agent dashboard to view the status of the Prometheus agent and the transmission rate of the remote write data.