The Application List page of Application Real-Time Monitoring Service (ARMS) displays the name, technology stack, agent type, number of requests, number of errors, and response time of all applications.
Procedure
Log on to the ARMS console. In the left-side navigation pane, choose .
In the top navigation bar, select a region.
Feature description
The Application List page displays the name, technology stack, agent type, number of requests, number of errors, and response time of all applications.
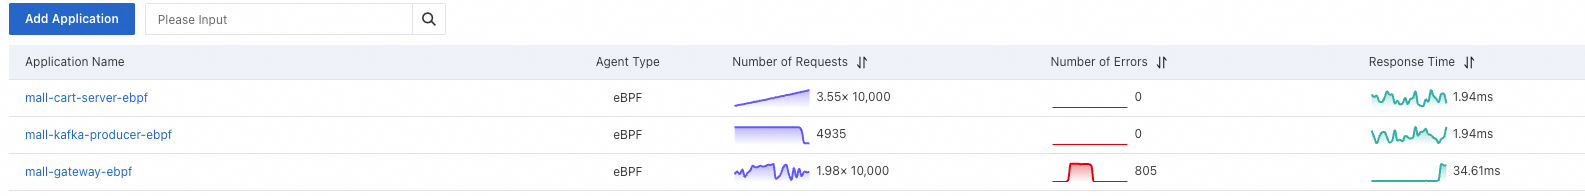
On the Application List page, you can perform the following operations:
Filter applications by setting the application name.
Click the application name to view the details of the target application.
Click the
 icon in the upper-right corner to view the global topology of the application.
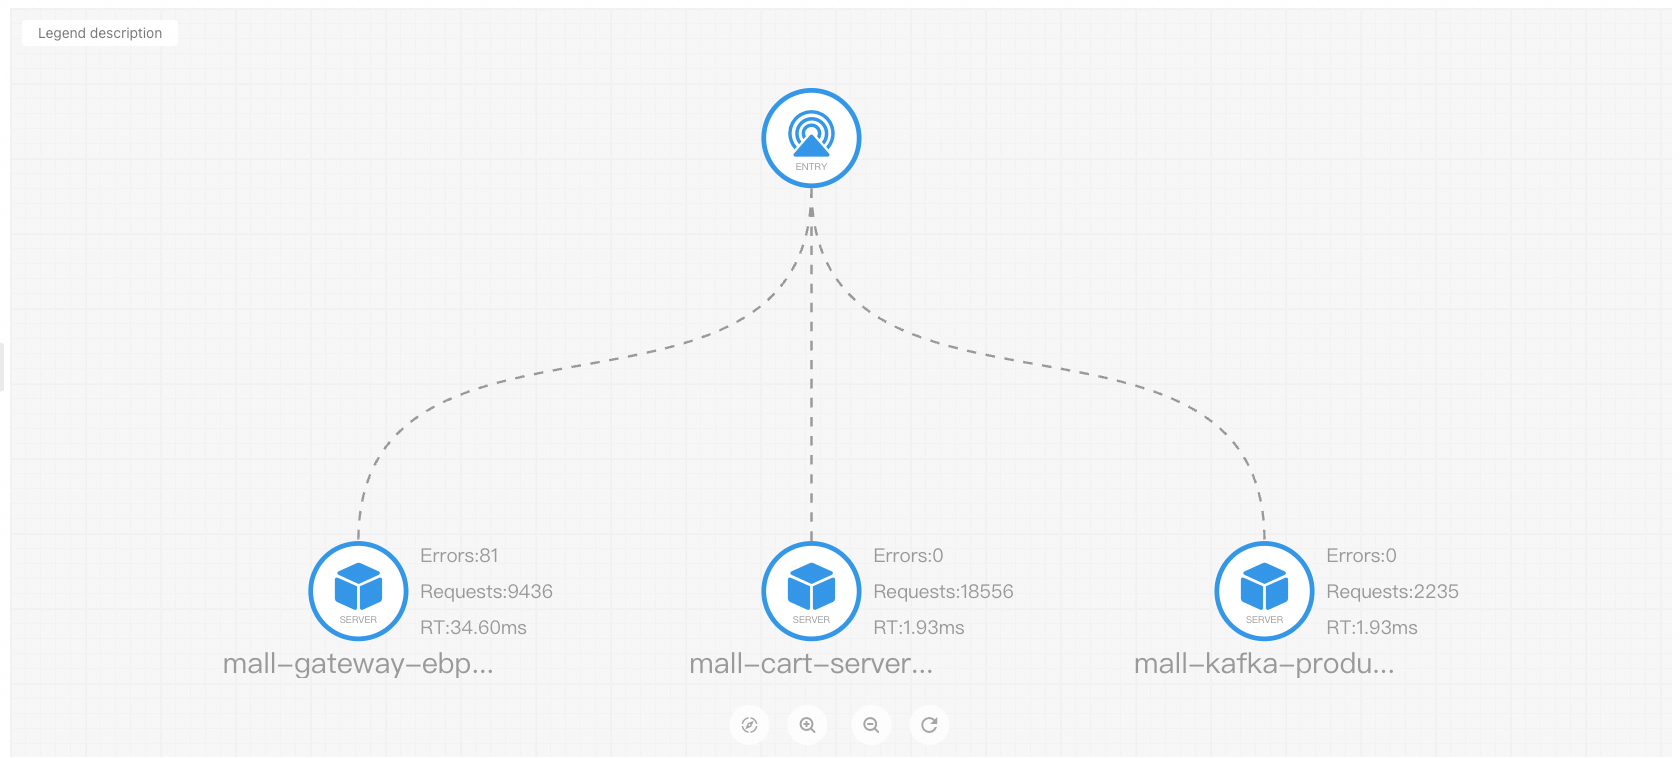
Contact us
If you have any questions about using Application Monitoring eBPF Edition, join the DingTalk group (ID: 35568145) to obtain technical support.