This topic describes how to view the history of operation events in OceanBase Developer Center (ODC).
Background
You can view and export historical operation records in the OceanBase Developer Center (ODC) console.
In the project collaboration window, choose Security Specifications > Operation Records to go to the Operation Records page.

You can click the
 icon to manually refresh the list.
You can select an option from Execution Duration to filter the operation records by time. Operation records in the last 7 days, 15 days, 30 days, or 6 months, or a custom time range can be queried.
View the basic information displayed in the operation record list.
Parameter
Description
No.
The sequence number of the operation record.
Event Type
The type of the operation event. The following types of operation events are supported: personal settings, password management, connection management, script management, database operations, organization configuration, member management, resource group management, data mocking, database changes, import, export, permission application, and task processes. You can click the filter icon
 to filter the operation records by event type.
Event Operation
The operation performed in the event. You can click the
 icon to filter the operation records by event operation.
IP Address
The IP address. You can click the
 icon to search by IP address.
Operator
The user who performed the operation. You can click the
 icon to search by operator.
Execution Time
The time when the operation was performed. By default, the operation records are sorted by execution time. The latest record is displayed at the top. You can click the
 icon to sort the operation records in ascending or descending order of execution time.
Execution Result
The execution result. Valid values: Succeeded and Failed. You can click the
 icon to filter the operation records by execution result.
Actions
Provides options for you to manage the record. Currently, only View is available.
View details of an operation record
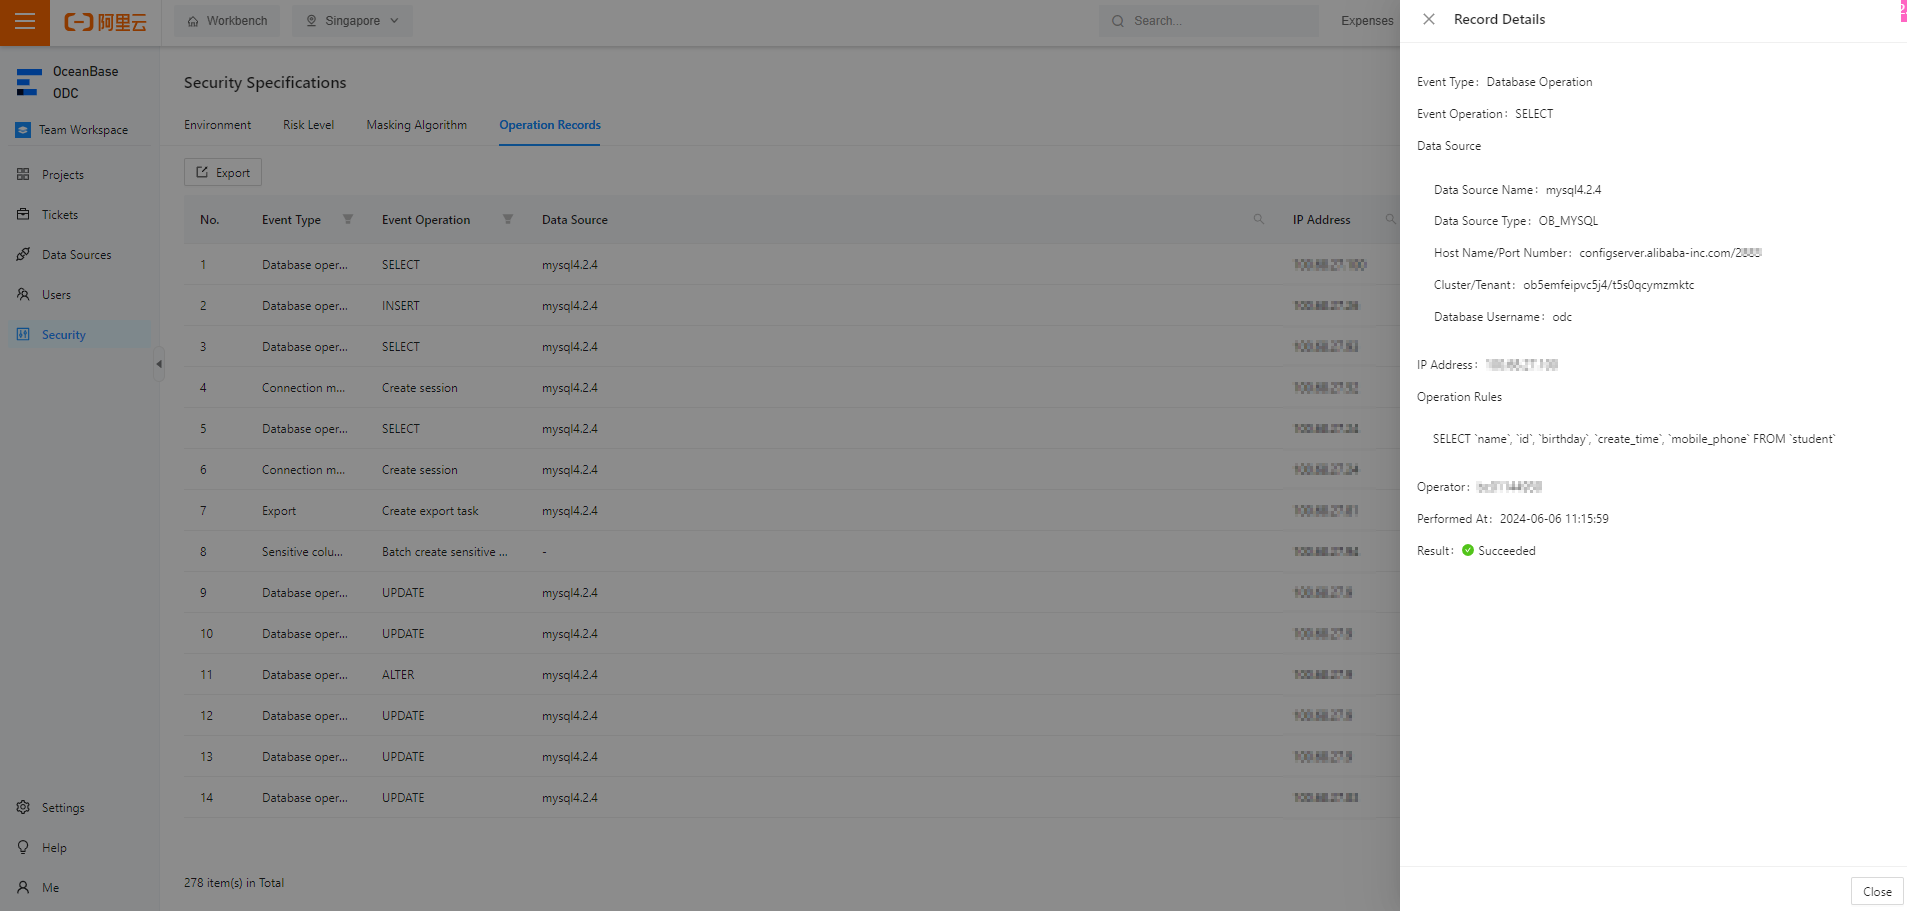
In the operation record list, click View in the Actions column of an operation record. The Record Details panel appears.

You can view the event type, event operation, IP address, execution details, executor, execution time, and execution result of the operation record.
Export operation records
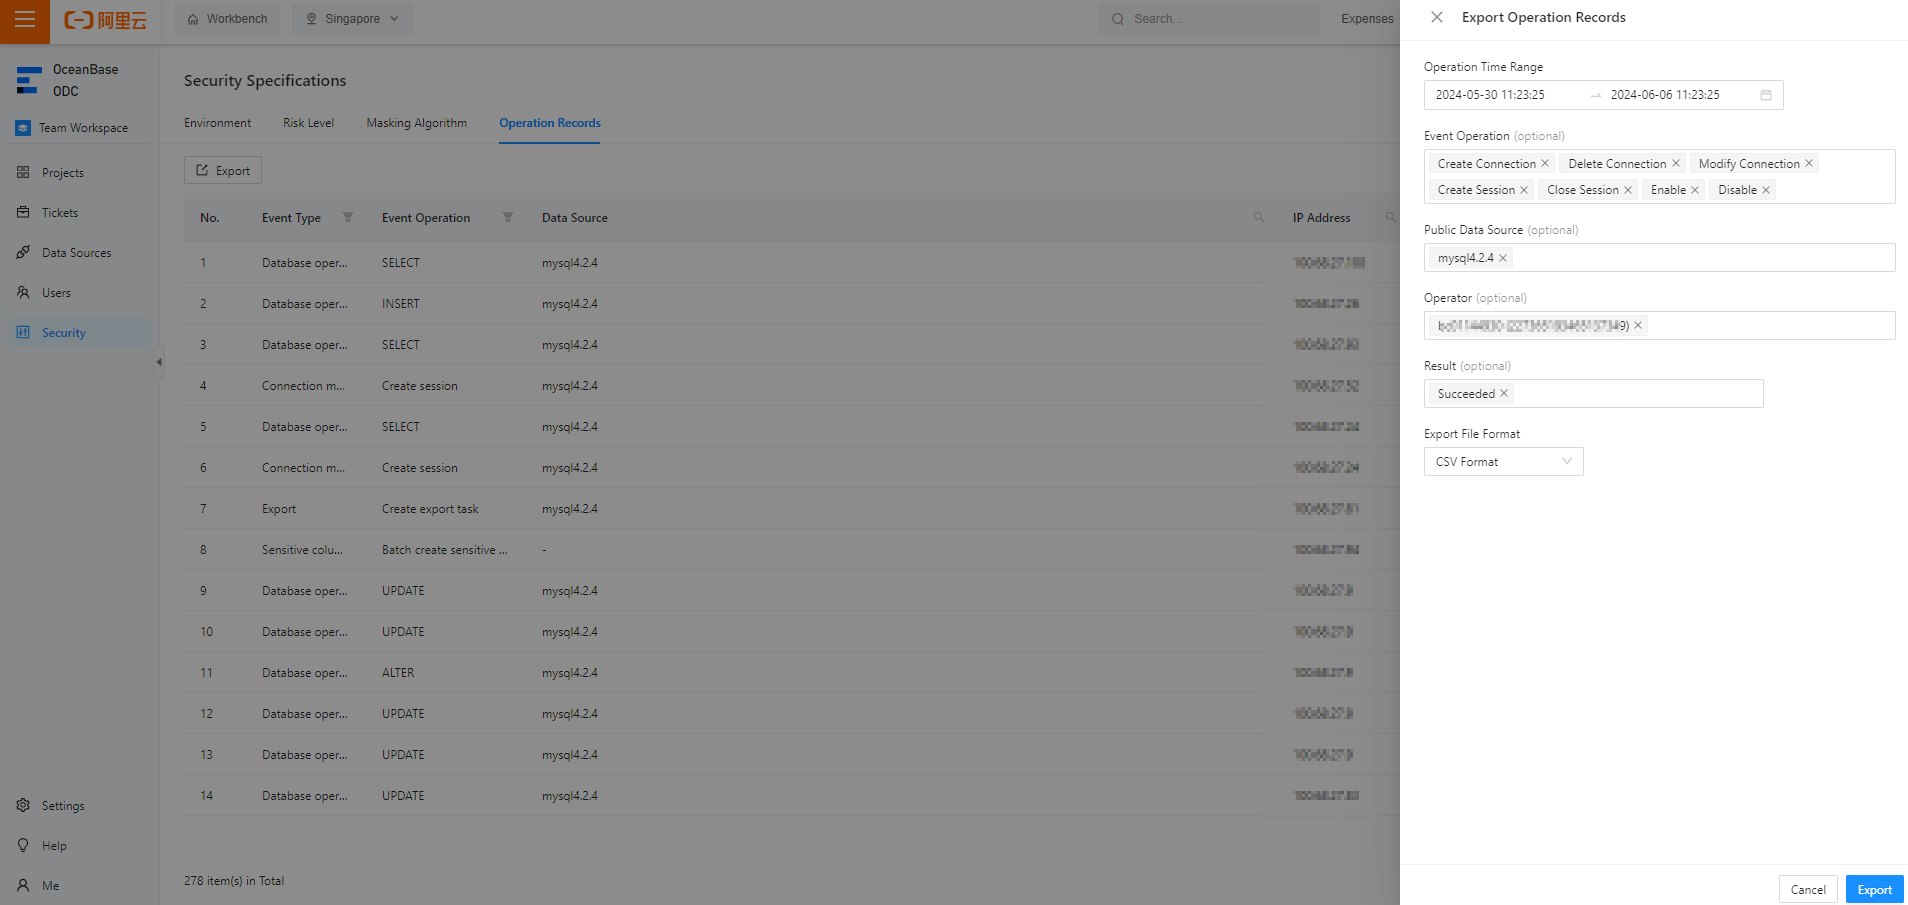
Click the icon in the upper-left corner of the Operation Records page to go to the Export Operation Records panel.
The following table describes the parameters that you can specify when you export operation records.

Parameter | Description |
Operation Time Range | Select the start date and the end date. |
Event Operation | Select event operations. |
Connection | Select data sources whose operation records that you want to export. By default, all data sources are selected. |
Operator | You can specify to export operation records of specific operators. |
Execution Result | Select the execution result. |
Export Format | Select the format for exported data. Supported formats are Excel and CSV. |