Slow or failing database calls directly affect end-user experience. The Database Invocation page in Application Real-Time Monitoring Service (ARMS) surfaces call topology, SQL-level performance metrics, exceptions, and distributed traces. Use it to identify slow queries, trace errors to their source, and determine which upstream services generate the most database load.
The page organizes database call data across five tabs:
| Tab | Purpose | Key metrics |
|---|---|---|
| Overview | Visualize call relationships and aggregate performance | Call topology, request count, response time, error count, result size |
| SQL Analysis | Analyze individual SQL statement performance | SQL call volume, response time trends, per-statement statistics |
| Exception Analysis | Investigate database call failures | Exception types, occurrence trends, error details |
| Call source | Identify which upstream services call the database | Calling applications, calling interfaces, per-source metrics |
| Interface Snapshot | Drill into distributed traces for individual requests | Trace IDs, trace timelines, associated logs |
Prerequisites
Your application must be monitored by ARMS Application Monitoring. For setup instructions, see Overview.
Open the Database Invocation page
Log on to the ARMS console.
In the left-side navigation pane, choose Application Monitoring > Applications.
On the Applications page, select a region in the top navigation bar and click the application name.
Note: If the
 icon appears in the Language column, the application is connected to Application Monitoring. A hyphen (-) indicates the application is connected to Tracing Analysis.
In the left-side navigation pane, click Database Invocation.
Select a database and set the time period.
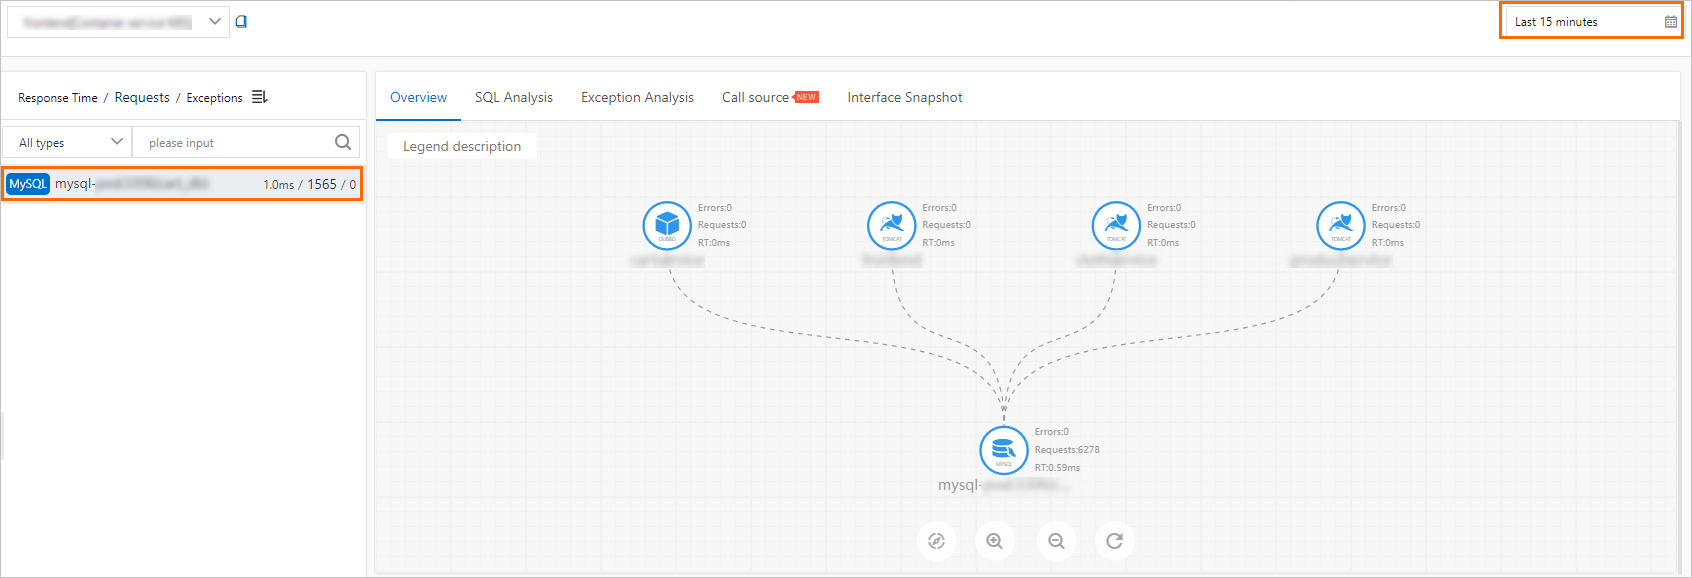
After you select a database and time period, use the tabs described below to analyze different aspects of the database calls.
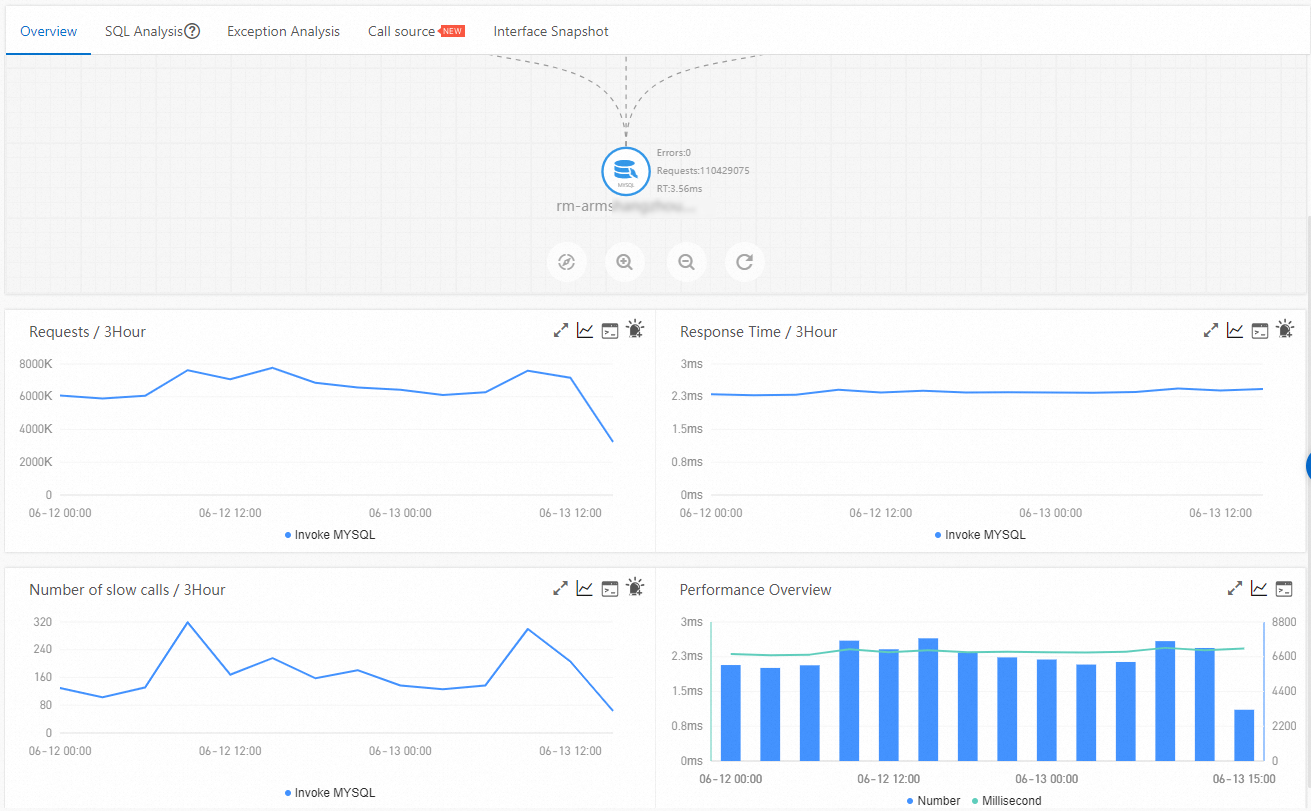
Overview tab
The Overview tab displays a call topology and performance charts for request count, response time, error count, result size, and overall performance.
Topology controls
| Action | How to |
|---|---|
| Zoom in | Click  or scroll up or scroll up |
| Zoom out | Click  or scroll down or scroll down |
| Reset to default size | Click  |
| Fit to page | Click  |
Chart interactions
| Action | How to |
|---|---|
| View point-in-time statistics | Hover over a chart |
| Zoom into a time range | Click and drag on a chart |
| View metrics for a custom period or compare dates | Click |
| View API details for a metric | Click |
| Create an alert rule for a metric | Click |
SQL Analysis tab
The SQL Analysis tab shows a column chart of SQL call volume and time series curves for response time. It also lists the SQL statements executed against the database.
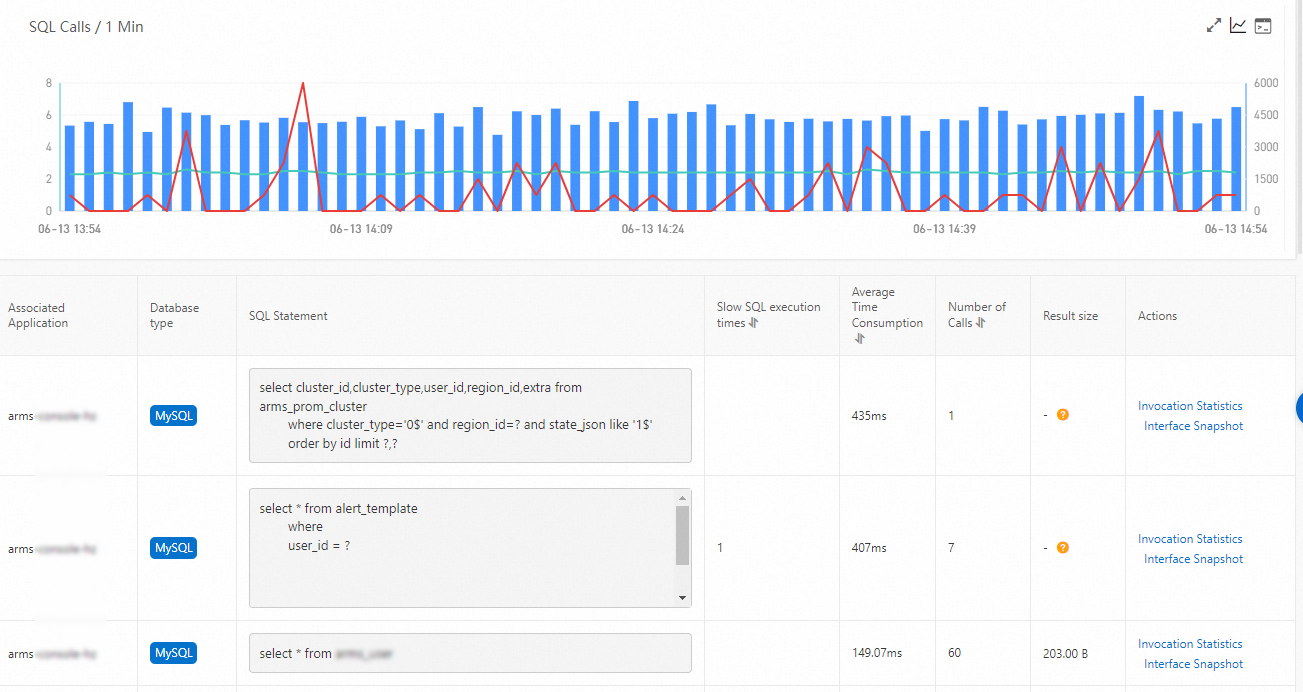
Chart interactions
| Action | How to |
|---|---|
| View detailed statistics | Hover over a chart |
| View metrics for a custom period or compare dates | Click |
| View API details for a metric | Click |
SQL statement actions
In the SQL statements list, use the Actions column:
| Action | Result |
|---|---|
| Invocation Statistics | View call statistics for an individual SQL statement |
| Interface Snapshot | View distributed traces for the statement. See Interface Snapshot tab. |
Exception Analysis tab
The Exception Analysis tab lists database call exceptions and their occurrence trends.
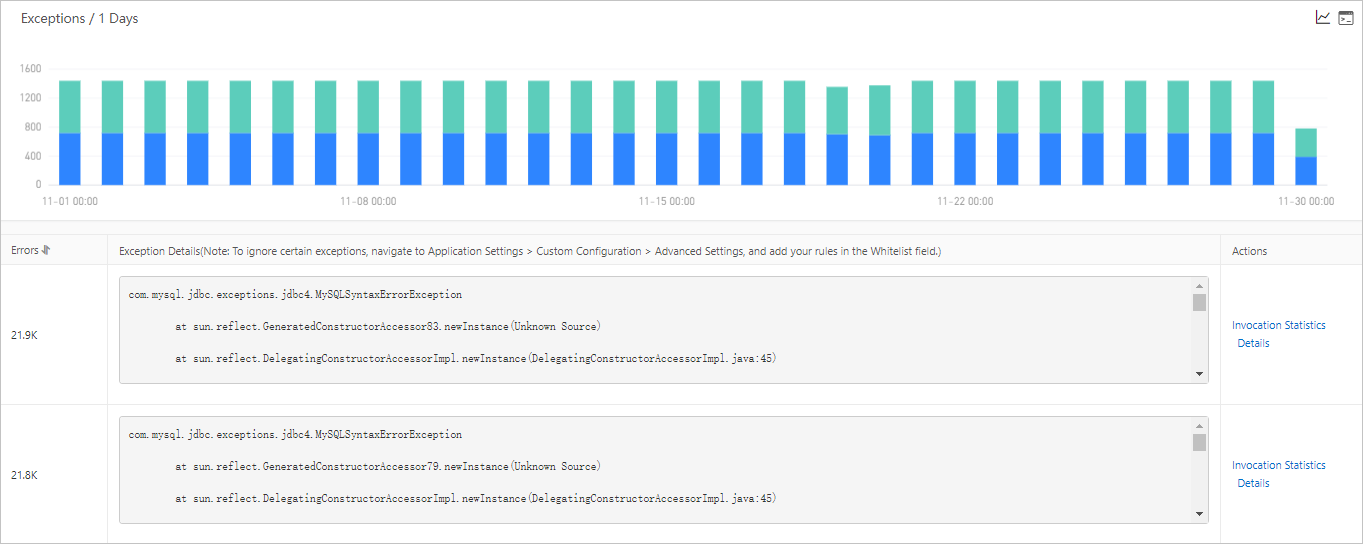
Note: To query exceptions, specify the Whitelist field in the Advanced Settings section of the Custom Configuration tab on the Application Settings page.
Chart interactions
| Action | How to |
|---|---|
| View detailed statistics | Hover over a chart |
| Zoom into a time range | Click and drag on a chart |
| View metrics for a custom period or compare dates | Click |
| View API details for a metric | Click |
Exception actions
In the exceptions list, use the Actions column:
| Action | Result |
|---|---|
| Invocation Statistics | View statistics for a specific exception |
| Details | View the full exception details |
Call source tab
The Call source tab shows which upstream applications and interfaces call the database. Use it to identify where database load originates.
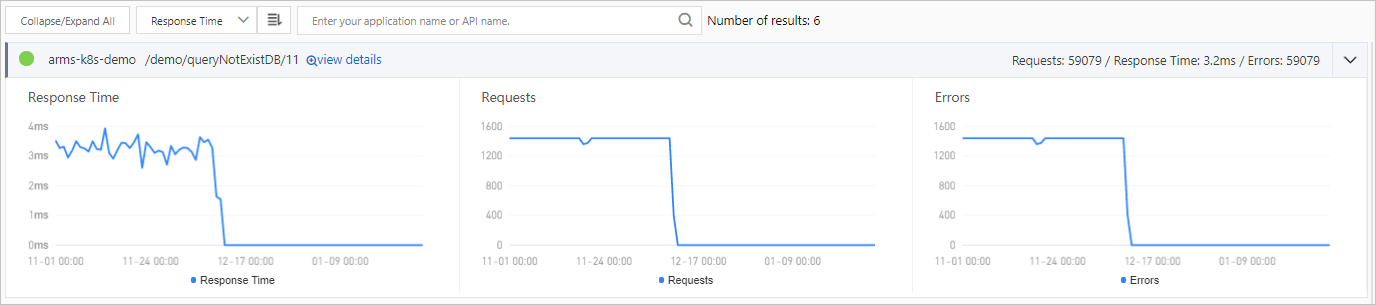
| Action | How to |
|---|---|
| Search for a specific application or API | Enter the name in the search box and click  |
| View traces for a specific API called by an upstream source | Click view details next to the API. See Interface Snapshot tab. |
| View detailed statistics | Hover over a chart |
| View metrics for a custom period or compare dates | Click |
Interface Snapshot tab
The Interface Snapshot tab displays distributed traces for database calls. Use traces to drill into individual requests and pinpoint performance bottlenecks at the query level.
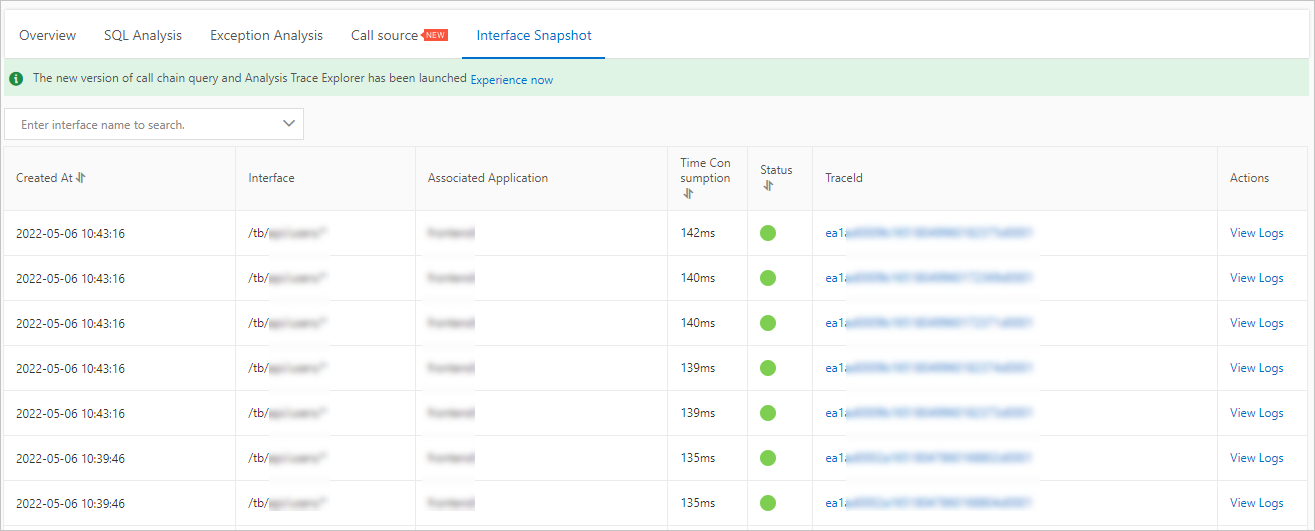
| Action | How to |
|---|---|
| Search traces by API name | Enter the name in the search box and click  |
| View trace details | Click the trace ID in the TraceId column. For more information, see Supported operations. |
| View logs associated with a trace | Click View Logs in the Actions column |
Note: You must associate trace IDs with your application's business logs to streamline error troubleshooting. When an error occurs, the linked business logs provide the context needed to diagnose the root cause. For setup instructions, see Associate trace IDs with business logs.