When microservices communicate across a service mesh, identifying unhealthy services, latency bottlenecks, and unexpected traffic patterns requires visibility into every service-to-service connection. Mesh Topology provides a real-time, interactive graph of all service communication in your Service Mesh (ASM) instance -- collected passively from Envoy sidecar proxies, with no code changes or manual instrumentation required.
How it works
ASM collects telemetry data from the sidecar proxies attached to every workload. Mesh Topology aggregates this telemetry into an interactive graph that shows:
Service dependencies -- which services call which, and in what direction
Traffic health -- success rates and error rates per edge
Latency -- request duration between services
Traffic volume -- traffic flow on each connection
For more information about the observability features of ASM, see Observability Management.
Prerequisites
Before you begin, make sure that you have:
An ASM instance of V1.15.3.120 or later with a Container Service for Kubernetes (ACK) cluster added to the instance
NoteIf your ASM instance is earlier than V1.15.3.120, follow the steps in Enable Mesh Topology to improve observability instead. To upgrade, see Update an ASM instance.
A Prometheus instance integrated with the ACK cluster for metrics collection -- either Managed Service for Prometheus or a self-managed Prometheus instance
A routing rule configured for the Bookinfo application, accessible through an ingress gateway. For setup instructions, see Use Istio resources to route traffic to different versions of a service
Enable Mesh Topology
Log on to the ASM console. In the left-side navigation pane, choose .
On the Mesh Management page, click the name of the ASM instance. In the left-side navigation pane, choose .
In the Enable ASM Mesh Topology section, enable the feature based on your ASM version:
ASM version Action Earlier than V1.18.2.112 Click To enable. V1.18.2.112 or later Choose a deployment mode (see below), then click To enable. Deployment modes (V1.18.2.112 or later):
Mode Description When to use In-Kubernetes-cluster Mode Mesh Topology runs inside the ACK cluster. Enter the HTTP API URL of your Prometheus instance, then click To enable. Single-cluster deployments Managed Mode Mesh Topology runs as a managed service. Click Managed Mode, then click To enable. Configure the required parameters in the dialog box and click OK. Multi-cluster deployments that need a single topology view For a comparison of these two modes, see Enable Mesh Topology in managed mode.
Access the Mesh Topology console
In the ASM console, navigate to and click the name of your ASM instance.
In the left-side navigation pane, choose .
In the Access section, create a Classic Load Balancer (CLB) instance to expose the Mesh Topology UI:
ASM version Action Earlier than V1.17.2.19 Turn on Automatically Create an Internet-facing CLB Instance to Access ASM Mesh Topology and click OK. V1.17.2.19 or later Turn on Create a CLB Instance to Access ASM Mesh Topology, configure the parameters in the dialog box, and click OK. Wait for the ASM instance to finish updating:
In the left-side navigation pane, choose .
In the Basic Information section, check the Status field. Updating means the instance is still being updated. Proceed when the status changes to Running.
Return to and click Copy token and open in new window.
On the Mesh Topology login page, paste the token and click Login.
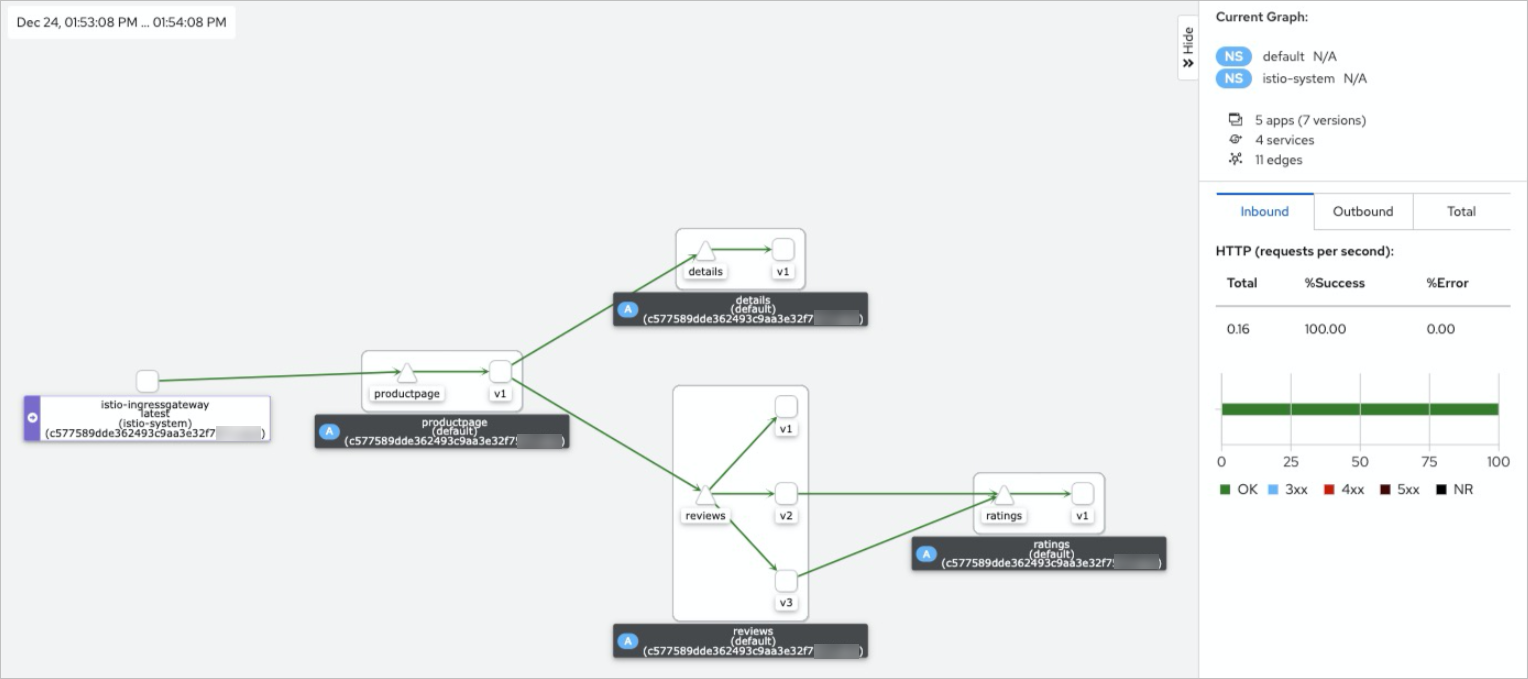
View the application topology
Generate traffic
In your browser, access the Bookinfo application:
http://<ingress-gateway-ip>/productpageReplace <ingress-gateway-ip> with the IP address of your ingress gateway. To find this address, see "Step 3: Query the gateway address" in Use Knative on ASM to deploy a serverless application.
Refresh the page a few times to generate traffic that Mesh Topology can visualize.
Choose a graph type
In the Mesh Topology console, select default from the Namespace drop-down list. Then select a graph type from the Versioned App graph drop-down list:
| Graph type | What it shows |
|---|---|
| Workload graph | Call relationships between workloads and traffic flows |
| App graph | Call relationships between applications and traffic flows |
| Versioned App graph | Call relationships between application versions and traffic flows |
| Service graph | Call relationships between services and traffic flows |
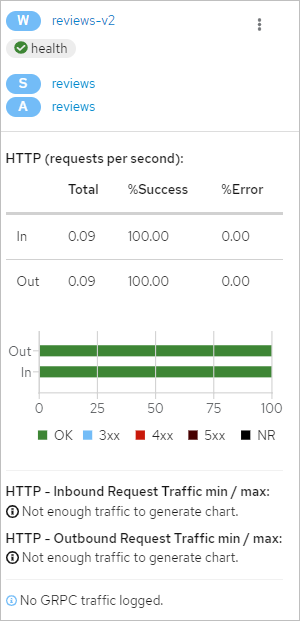
Inspect a workload
Click a node in the topology graph -- for example, reviews-v2 -- to open the side panel. The panel displays:
Running status of the workload
Inbound traffic -- details for incoming requests
Outbound traffic -- details for outgoing requests
What's next
Troubleshoot latency: If you spot high-latency edges in the topology, use access logs to locate the root cause. See Locate the cause of high response latency by using access logs in ASM.
Reduce latency with zone-aware routing: Route traffic to services in the same availability zone first to lower service call latency. See Verify the zone aware routing feature on the topology of an ASM instance.
Scale to multiple clusters: Monitor traffic topologies across clusters by switching to managed mode -- a single Mesh Topology deployment for the entire ASM instance. See Enable Mesh Topology in managed mode.
Run diagnostics: Check data plane versions, service ports, and service associations to detect configuration issues early. See Diagnose ASM instances.