This topic helps you diagnose and resolve issues when data reported through an open-source client does not appear in the Managed Service for OpenTelemetry console, or when error logs appear in the console or log files.
Missing data falls into one of two categories:
Data is not reaching the server -- caused by network issues, disabled ingestion settings, exceeded quotas, or protocol-level errors (HTTP or gRPC).
Data arrives but does not display as expected -- caused by broken traces, missing spans, or agent misconfiguration.
Verify network connectivity
Confirm that the client can reach the Managed Service for OpenTelemetry endpoint.
Identify whether the endpoint in your code is a private endpoint or a public endpoint.
A private endpoint must belong to the same virtual private cloud (VPC) as the server. Cross-region reporting is not supported.
From the reporting environment, run the
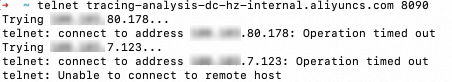
curlortelnetcommand to test the endpoint and port. If the endpoint is unavailable, check the security group settings of the Elastic Compute Service (ECS) instance. Example for the gRPC endpoint in the China (Hangzhou) region:telnet <endpoint> <port>telnet tracing-analysis-dc-hz.aliyuncs.com 8090Check the result: The following figure shows a successful connection. The following figure shows a failed connection.
Result Meaning Next step Connection established (the terminal shows Connected to ...)The client can reach the server. Proceed to Check data ingestion settings. Stuck at Trying <IP>...or returnsUnable to connect to remote hostThe client cannot reach the server. Check the security group rules of the Elastic Compute Service (ECS) instance and the VPC network configuration. For details, see Connect to Managed Service for OpenTelemetry and authenticate clients and Security groups. 
Check data ingestion settings
Data ingestion can be controlled globally (for all applications) or per application. A quota limit can also block ingestion.
Global settings
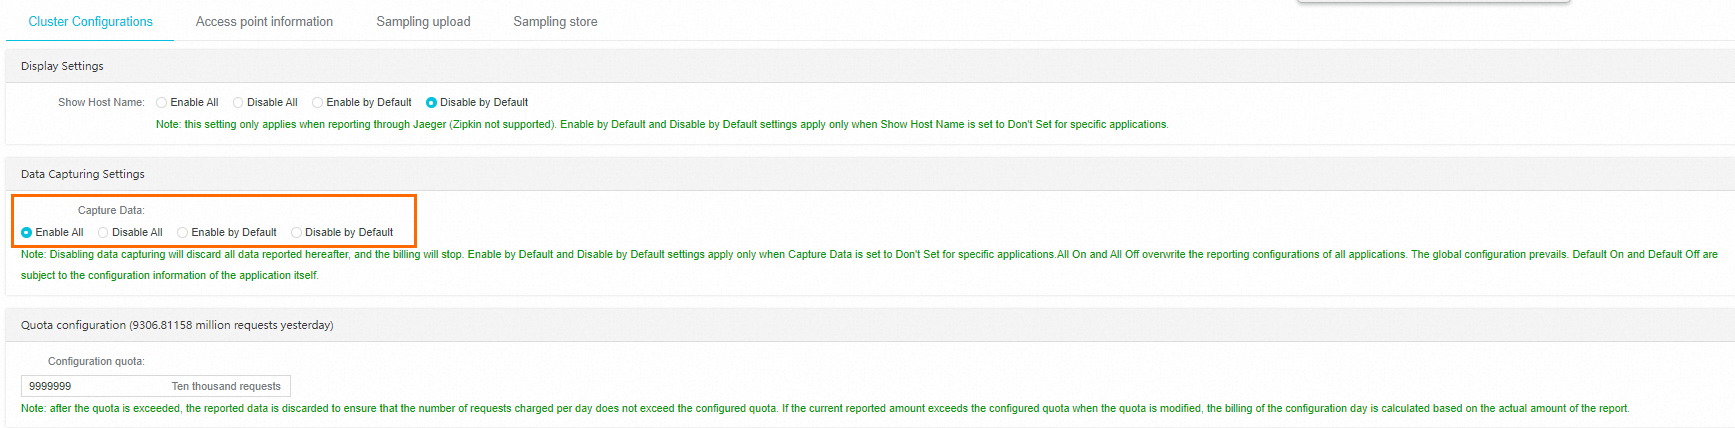
In the left-side navigation pane of the Managed Service for OpenTelemetry console, click Cluster Configurations.
In the Data Capturing Settings section, verify that Enable All or Enable by Default is selected.
Per-application settings
On the Applications page, click the target application name.
In the left-side navigation pane, click Application Settings.
On the Custom Configuration tab, in the Data Capturing Settings section, verify that Capture Data is set to Enable or Don't Set.
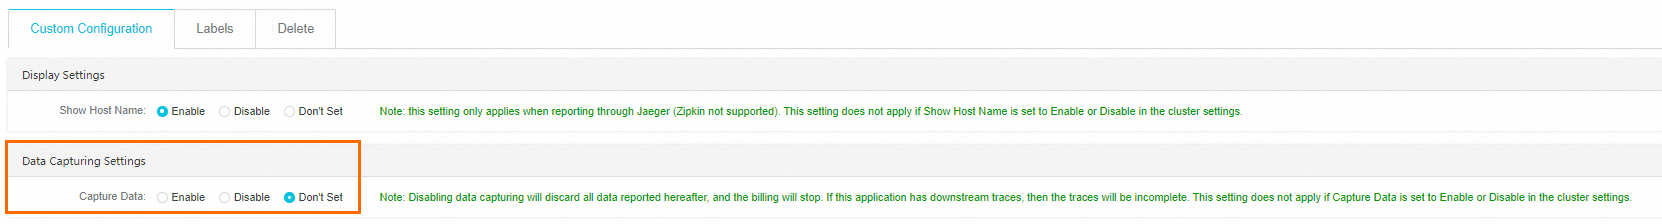
If the global setting is Enable All or Disable All, per-application settings do not take effect. The global setting always takes precedence. When Don't Set is selected for an application, the application inherits the cluster-level setting.
Quota
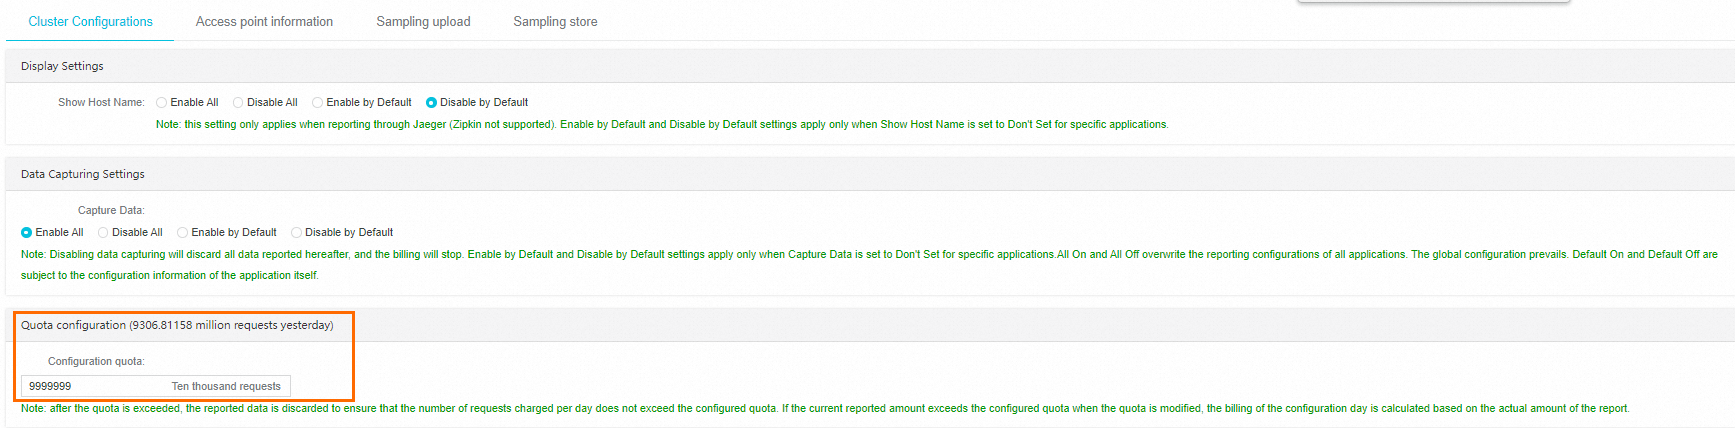
On the Cluster Configurations page, check the Quota configuration section.
If the reported data volume has reached the configured quota, increase the quota. No additional data is accepted after the quota is reached.
Verify the Simple Log Service data source
Managed Service for OpenTelemetry stores data in Simple Log Service (SLS) projects within your account. If the number of SLS projects reaches the account limit, data fails to be reported.
To resolve this issue:
Release unused SLS projects to free up capacity.
Submit a ticket to request a higher project limit.
Check the monitoring task status
If the console indicates that the monitoring task is abnormal or not enabled, submit a ticket to Alibaba Cloud Support.
Troubleshoot HTTP reporting errors
Check the HTTP status code in the console or log files and match it to the cause and resolution below.
| HTTP status code | Cause | Resolution |
|---|---|---|
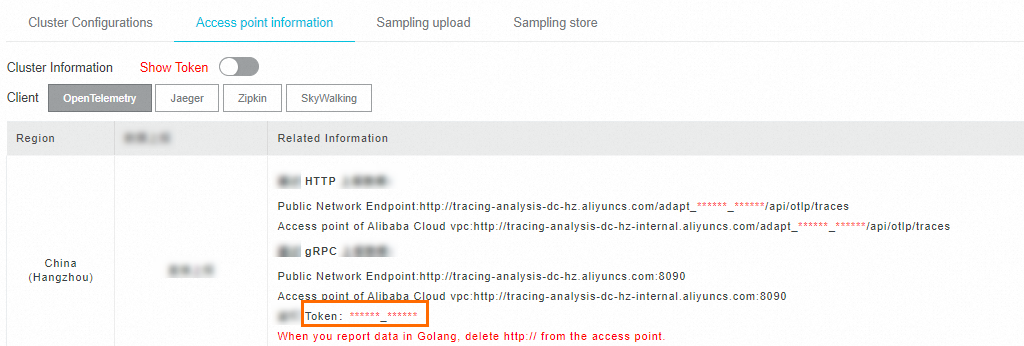
| 403 | The server rejected the request due to an authorization failure. | Verify the endpoint and token. To get the correct values, go to Cluster Configurations > Access point information. For Zipkin clients, also remove /v2/spans from the URL if present. |
| 405 | The reported data volume has reached the configured quota. | Increase the quota in the Quota configuration section of the Cluster Configurations page. |
| 406 | Cluster-level data collection is disabled. | Enable collection in the Ingestion Configuration section of the Cluster Configurations page. |
| 400 | The request body has an unsupported data format. | Set the Content-Type header to application/json or application/x-thrift. Verify that tag keys and values are strings (not JSON arrays) and that spans are sent as a JSON array (not a JSON object). |
APISIX-specific error
If the following error appears:
The origin server did not find a current representation for the target resource or is not willing to disclose that one exists.APISIX cannot report data directly to Managed Service for OpenTelemetry through OpenTelemetry. Use OpenTelemetry Collector as an intermediary to forward data.
Troubleshoot gRPC reporting errors
Check the gRPC status code in the console or log files. For a full list of gRPC status codes, see Status codes and their use in gRPC.
Timeout
Error message:
Failed to export spans. The request could not be executed. Full error message: timeoutResolution:
Verify network connectivity (see Verify network connectivity).
Increase the reporting timeout in the SDK or agent configuration to accommodate your environment.
Authentication failure (gRPC status code 7)
Error message:
Failed to export spans. Server responded with gRPC status code 7. Error message:Resolution:
Verify that the Authentication field in the gRPC request header matches the token shown in the Managed Service for OpenTelemetry console. To find the token, go to Cluster Configurations > Access point information.
SkyWalking MeterSender error
Error message:
MeterSender : Send meters to collector fail with a grpc internal exception.
org.apache.skywalking.apm.dependencies.io.grpc.StatusRuntimeException:
UNIMPLEMENTED: Method not found: skywalking.v3.MeterReportService/collect
Cause: The SkyWalking client is attempting to send metrics (not traces) to the Managed Service for OpenTelemetry server, which does not support this method.
Resolution: Disable metrics reporting in the SkyWalking client configuration.
Troubleshoot unexpected trace data
If data reaches the console but traces are incomplete or unexpected, use the following guidance based on the agent or SDK in use.
SkyWalking agent or SDK
Missing framework or middleware events
Check the SkyWalking agent plugin directory. For SkyWalking v8 and later, the default path is:
${agent-path}/agent-8.x/pluginsVerify that the plugin versions match the framework versions used in the application. If a required plugin is missing, copy it from the
bootstrap-pluginsoroptional-pluginsdirectory, or download it from the SkyWalking community.Confirm that only one agent is attached to the application. Multiple agents can cause instrumentation conflicts.
Broken traces
Check whether the application uses asynchronous processing. In asynchronous scenarios, trace context may not propagate automatically. For the solution, see Trace Cross Thread in the SkyWalking documentation.
Traces shorter than expected
Increase the maximum number of spans that can be reported by the SkyWalking agent by modifying collector.agent.service_graph.batch_size in:
${agent-path}/agent-8.x/config/agent.configOpenTelemetry agent or SDK
Broken traces
Check whether the application uses asynchronous processing. To resolve broken traces in asynchronous scenarios:
Update OpenTelemetry to the latest version.
Use the SpanLinks API to link related spans.
Explicitly specify a parent span to correlate operations.
Pass the trace context to downstream services through context propagation.