End-to-End Trace Analysis
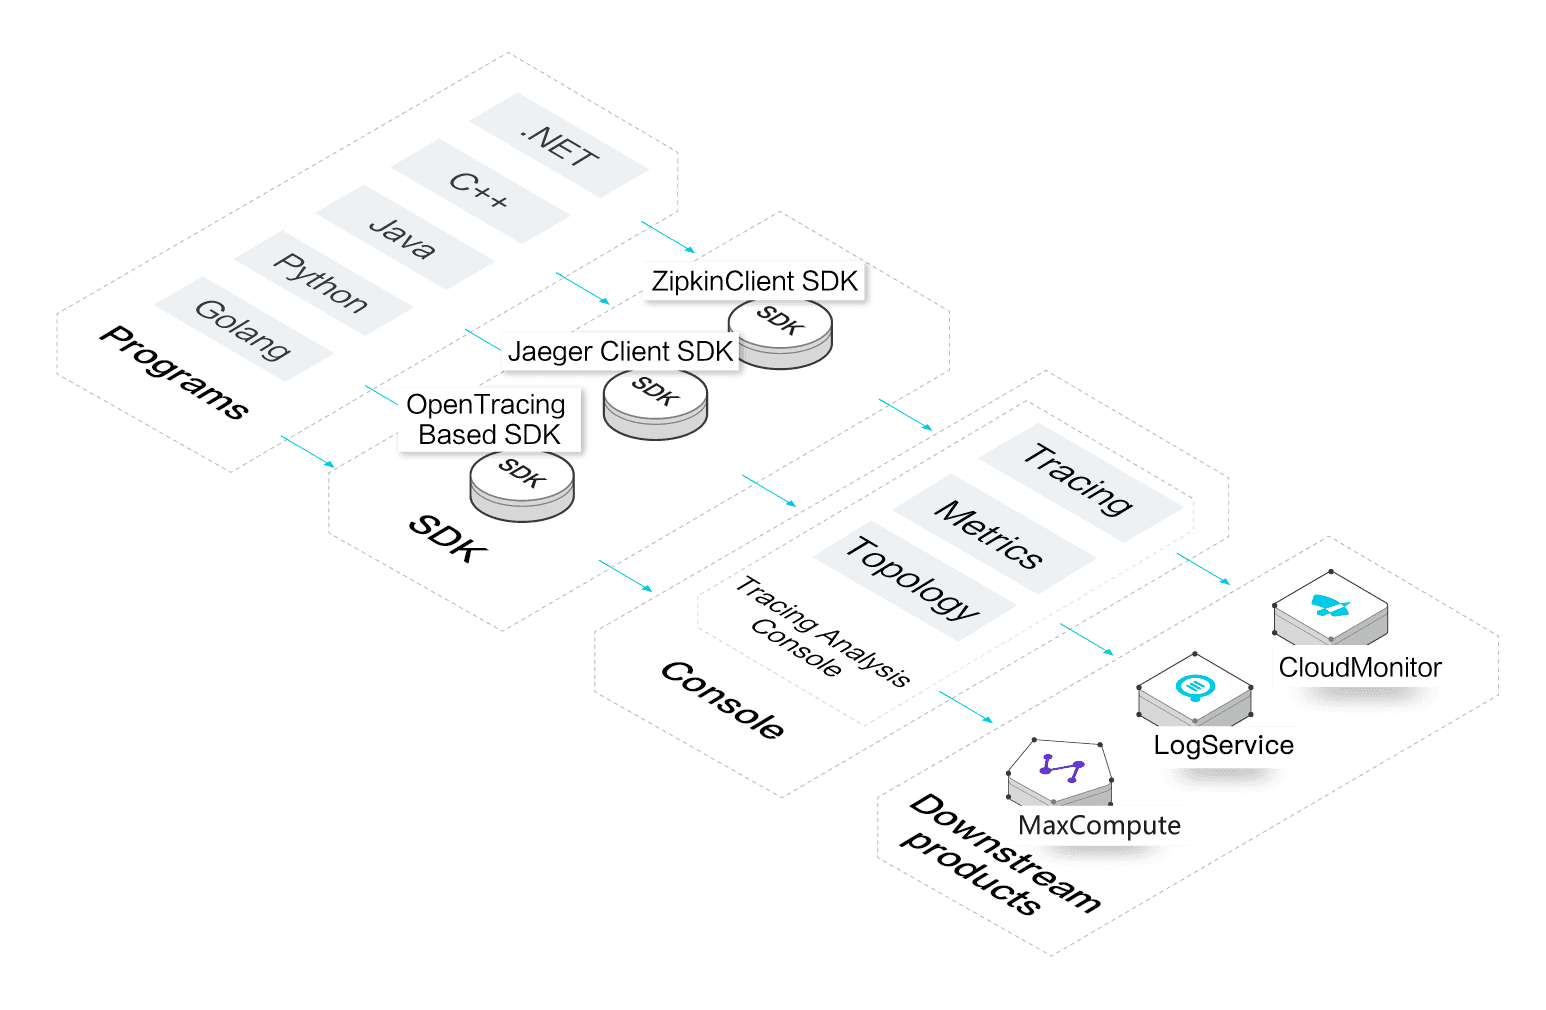
Managed Service for OpenTelemetry provides a wide range of tools to help developers identify performance bottlenecks of distributed applications. This helps developers improve the efficiency of developing and troubleshooting applications that use the microservices architecture. The provided tools can be used to map traces, offer trace topologies, analyze application dependencies, and calculate the number of requests.
To use Managed Service for OpenTelemetry, you must activate Log Service. You do not need to pay for the Log Service resources that are consumed to offer the Tracing Analysis service.
Step-by-Step Tracing
Simplifies the troubleshooting of distributed applications. You no longer need to log on to individual machines to obtain logs for troubleshooting.
Compatibility with Open Source Systems
Allows you to use open source SDKs to specify tracking points, such as SDKs for Zipkin, Jeager, and OpenTracing.
Low Cost
Tracing Analysis provides the pay-as-you-go billing method. This billing method can help you reduce costs to one fifth when compared to a similar self-built open source system.
Features
Troubleshooting and Data Retrieval Based on Distributed Tracing
Tracks all user requests for applications in a distributed architecture and provides an overview of service calls to troubleshoot issues and retrieve data.
RPC Tracing
Tracks all user requests for applications that use the microservices architecture, including HTTP, Dubbo, and HSF requests.
PaaS Tracing
Tracks PaaS service calls for SQL databases, NoSQL databases, message queuing systems, and other compatible systems.
Near Real-Time Integration of Performance Data
Tracks all user requests for an application and analyzes the performance of the application and corresponding interfaces in near real time.
Diverse Statistical Granularities
Integrates performance data across a diverse range of statistical granularities, such as application-level or service-level data.
Near Real-Time Integration
Integrates performance data in near real time, with an update frequency of less than one minute.
Near Real-Time Detection of Distributed Tracing Topologies
Collects information about the service calls for distributed applications built on the microservices architecture, and the service calls for the underlying PaaS products.
High Accuracy
Offers a near real-time topology of tracing data based on the reported information, guaranteeing the accuracy of the topology.
Support for Multiple Programming Languages
Features compatibility with multiple open source APM systems, such as Jaeger, Zipkin, and SkyWalking. Tracing Analysis is developed based on the open source OpenTracing project.
Direct Data Reporting
Uses SDKs in multiple programming languages to report tracing data to a data consumption platform based on the supported protocols.
Indirect Data Reporting
Uses SDKs in multiple programming languages to report tracing data to agents, which process and send the data to a data consumption platform.
Integration with Diverse Services
Supports integration with data analysis platforms, such as MaxCompute. You can also consume tracing data for log analysis without sending the data to a data analysis platform.
Alert Reporting
Supports integration with CloudMonitor for alert reporting based on monitoring data.
Big Data Analysis
Supports integration with MaxCompute for data mining.
Upgraded Support For You
1 on 1 Presale Consultation, 24/7 Technical Support, Faster Response, and More Free Tickets.

1 on 1 Presale Consultation

24/7 Technical Support

6 Free Tickets per Quarter
