By Baiye
Please refer to Part 1 of this article series to read more about the concept of atomicity.
Experiment platform: The experiment uses an Alibaba Cloud ECS instance. The instance specification is ecs.ebmre6p.26xlarg. This instance has two Intel(R) Xeon(R) Platinum 8269CY CPUs, each with 52 cores. Each core has an L1 cache of 32 KB and an L2 cache of 1 MB. All cores on each CPU share a 32-MB L2 cache. The instance also has 187 GB of DRAM and 1 TB of PM. PM is evenly distributed to two CPUs, that is, each CPU is equipped with 512-GB PM. A total of 2-TB ESSDs are configured for the instance as cloud hard disks. In the experiment, all PM devices are configured as two Linux devices, and each device belongs to one CPU. All experiments run on a Linux kernel of version 4.19.81.
Parameter configurations. Unless otherwise specified, in the experiment, the size of a single memory table is 256 MB, the maximum GI of a single subtable is 8 GB, and the level 1 of a single subtable is 8 GB. The system before the improvement is configured with 256 MB of level 0. All experiments use synchronous WAL, use Direct I/O to bypass the impact of page cache on the system, and turn off the compression to evaluate the maximum performance of the system as accurately as possible.
The experiment first uses the test benchmark of YCSB and loads 8 billion records in the database in advance. These records are evenly distributed to 16 subtables. Each record has 8 bytes for storing keys and 500 bytes for values, totaling about 500 GB. Four configurations are configured in the experiment: (1) The benchmark system and all data are placed in ESSD (marked as XS); (2) The scheme is improved and 200 GB of PM spaces are managed by Halloc (marked as XP); (3) The benchmark system and all data are placed in a faster PM (marked as XS-PM); (4) The scheme is improved and put the data originally in ESSD to PM (marked as XP-PM). Configuration (1) and configuration (2) are standard configurations in actual usage, while configuration (3) and configuration (4) are mainly used to evaluate the system performance after removing the ESSD. Each experiment uses 32 client threads, sets 50 GB of row cache and 50 GB of block cache, and runs for 30 minutes to ensure that the system compaction runs in time.

Figure 12 YCSB experiment results
The experiment results are shown in Figure 12. For write-intensive load A under random requests, the performance of XP and XP-PM is 3.8 and 2.3 times that of XS and XS-PM. For write-intensive load F under random requests, the performance of XP and XP-PM is 2.7 and 2.2 times that of XS and XS-PM. As shown in Figure 10, the average access latency of XP is 36% lower than that of XS. In the case of load tilt (Zipf=1), the performance of XP is close to that of XS, and the performance of XP-PM is lower than that of XS-PM. These results show that the overall performance of the scheme introduced in this article is better and produces less disk I/O than the benchmark system. However, there is not much difference between the performance of XP-PM and XS-PM. Especially, under the load tilt, the performance of XP-PM is worse than that of XS-PM of the benchmark system. However, this configuration places all the data in PM. This approach is not used in practice due to the high cost.
For read-intensive applications (B, C, D, E), under load B and random requests, the performance of XP and XP-PM is 1.7 times and 1.2 times higher than that of XS and XS-PM, respectively, and 1.4 times and 1.1 times higher under load D. Besides, XP and XP-PM have lower latency. The average latency of load B is reduced by 39%, and the average latency of load D is reduced by 26%. This is mainly because XP does not need to write WAL logs, so it has lower write latency. When the load is tilted, the performance benefits of XP are reduced. Under load B, the performance of XP and XP-PM is only 1.1 times and 1.5 times higher than that of XS and XS-PM. Under load C and load E, due to fewer writes, all data is merged into ESSD. Therefore, the performance of XP and XP-PM is close to that of XS and XS-PM.
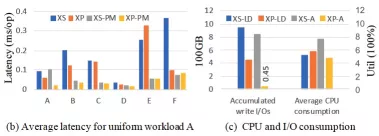
Figure 12 (continued) System latency and CPU and I/O overhead
CPU and I/O consumption. Figure 12 (continued) shows CPU consumption and accumulated I/O when running load YCSB and load A. The result shows that XP has better CPU usage efficiency, and its I/O consumption is 94% lower than that of the benchmark system when running load A. The main reason is that XP uses a larger GI to cache more updates in PM, thus reducing data flush operations.
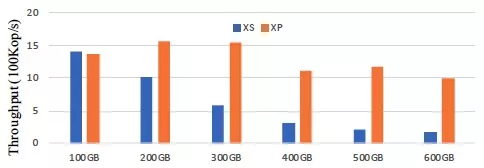
Figure 13 System latency and CPU and I/O overhead
Database size sensitivity. To find the relationship between the benefits brought by improved system performance and the database size, the experiment injected 100 to 600 GB of data, respectively, and then ran load D. As shown in Figure 13, when the database size increases from 100 GB to 600 GB, the performance of the XS benchmark system decreases by 88%, while XP decreases by only 27%. This is mainly because load D reads the most recent updates as much as possible. XP places hot data in high-speed persistent PM, while XS benchmark system needs to read data from low-speed disks every time the system is started for testing.
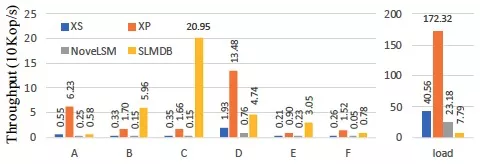
Figure 14 Experiment results of a single LSM-tree instance (40-GB dataset)
Experiment of a single LSM-tree instance. In order to compare with the latest scheme of improving LSM-tree by using PM, SLMDB and NoveLSM were selected for comparison in the experiment. Since SLMDB and NoveLSM do not support running multiple LSM-tree instances in the same database, we set only one subtable. In the experiment, four clients were used and 40 GB of data was loaded. As shown in Figure 14, XP has higher data loading performance, which is 22 times that of SLMDB and 7 times that of NoveLSM. This is mainly because SLMDB and NoveLSM use persistent skiplist as the memory table, but when transactions are involved, they still rely on WAL to ensure the atomicity of transactions. In addition, neither of them supports concurrent write. SLMDB uses a single-layer structure and global persistent B+ tree to index data on the disk. Although this design can improve the data read performance, the write performance is low due to the consistency maintenance of the disk and persistent indexes in PM. NoveLSM only introduces persistent memory tables, so the performance improvement is relatively limited (not very novel).

Figure 15 Evaluation results of TPC-C experiment
TPC-C performance. In the experiment, the improved scheme was integrated into MySQL as a plug-in for a storage engine. An initial database size of 80 GB was preloaded, and then the TPC-C experiment lasted for 30 minutes. The experiment results (as shown in Figure 15) show that the TPS performance of XP is improved by 1 time compared with XS, and its P95 latency is reduced by 62%. This is mainly because XP avoids WAL writing and has a larger PM to cache more data. However, XP has greater jitter in TPS performance than XS does, mainly because XP is more inclined to implement the all-to-all compaction strategy from level 0 to level 1. This leads to more severe cache elimination. Therefore, the balance between compaction and the elimination strategy of cache is an important issue to be solved.
In order to evaluate the performance of the semi-persistent memory table in the improved scheme, all flush and compaction operations in the background of the system were disabled in the experiment. The batch of ROR was set to 50 to bypass the impact of ROR as much as possible (when the batch is 50, it is close to the performance limit of PM hardware). In the experiment, the following index schemes are mainly tested: (1) The default type of memory table index of baseline system based on skiplist of DRAM (marked as SLM); (2) Persistent memory table implemented based on FAST&FAIR (marked as FFM); (3) Semi-persistent memory table implemented based on the variant of FPTree (marked as FPM). OLC is used to perform the concurrent operation in this experiment. The original FPTree uses HTM and leaf lock to perform the concurrent operation; (4) A scheme proposed in this article that uses DRAM to store index nodes (marked as SPM-D); (5) A scheme proposed in this article that uses PM to store index nodes (marked as SPM-P). Schemes (4) and (5) are used to detect the performance of the memory table when PM is not used persistently. FAST&FAIR and FPTree are persistent B+ trees optimized for PM. FPTree only persists leaf nodes, so it is also a semi-persistent index. Since FAST&FAIR and FPTree do not support variable-size keys, this experiment adds KV resolution to these two kinds of memory tables during run time. In other words, only pointers of fixed-size KV pairs are stored in the index. In the experiment, 30 million KV pairs, 8-byte keys, and 32-byte values are inserted, totaling about 1.5 GB. KV pairs will be converted into 17-byte keys and 33-byte values in the memory table.

Figure 16 Performance evaluation results of memory tables
insert performance: (a) and (b) in Figure 16 show the write performance of different memory tables when concurrent threads are increased from 1 to 32. The results show that the difference between SPM-D and SPM-P is very small during writing, even if SPM-P places the index node in a slower PM. This is mainly because the persistence overhead is relatively large. Compared with SLM, FFM, and FPM, the sequential write performance of SPM-D increased by 5.9 times, 5.8 times, and 8.3 times, respectively, and 2.9 times, 5.7 times, and 6.0 times on random write performance. Even if LSM places indexes in faster DRAM, the performance of SPM-D and SPM-P is still much better. This is because SPM uses radix tree indexes and has better read and write efficiency. Even though FPM also places index nodes in faster DRAM, it relies on KV resolution during run time in its implementation to load specific KV data from slower PM.
lookup performance: Table 16 (c) shows the performance of the point read. In this experiment, the performance improvement of SPM-D compared with SLM, FFM, and FPM reached up to 2.7 times, 14 times, and 16 times, respectively. For point-read scenarios, SPM uses prefix matching, while SLM, FFM, and FPM all use binary search. In scenarios where keys are generally short, the radix tree has higher read efficiency. FPM uses hash-based fingerprint identification technology in leaf nodes to accelerate point read performance. In memory tables, point read will be converted into short-range queries to obtain the latest version of the corresponding keys. Therefore, the fingerprint technology in FPM is of little use. In addition, FPM leaf nodes adopt an out-of-order storage strategy to sacrifice a certain read efficiency in exchange for an increase in write speed. The performance of SPM-D is higher than that of SPM-P in point-read scenarios, mainly because SPM-P places the index node in a slower PM. When reading, the index performance is limited by the read bandwidth of the PM. For range queries shown in Figure 16 (d), the performance of SPM-D and SPM-P is not as good as that of SLM. The range query performance of the base tree in DRAM is generally not high. It is found in this experiment that this is mainly due to the limitation of the read bandwidth of PM. In fact, system analysis shows that SPM-D takes 70% of the time during range query to read data from PM.
ROR mainly affects the write performance of the system. In order to reduce the interference of system background tasks, all flush and compaction operations are disabled in the experiment. Index creation in the memory table is also disabled. Each thread writes 1 million KV pairs, with a size of 24 bytes for each. The experiment evaluates the impact of these parameters on the write performance of the system by setting different thread numbers and batch sizes.
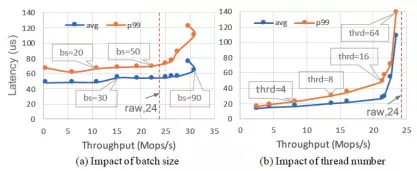
Figure 17 Evaluation results of ROR algorithm
Impact of the batch size: In the experiment shown in Figure 17 (a), the number of threads is fixed to 32, and the batch size is changed to test its impact on system write performance and latency. The results show that when the batch size is changed from 1 to 90, the write throughput of the system increases by 49 times, while the average latency and P99 latency increase by 1.3 times and 1.7 times, respectively. When batch size equals 90, the write throughput even exceeds the random write throughput (24 bytes) to PM hardware. This is because ROR always writes sequentially. When the batch size increases from 50 to 90, its performance benefits grow slowly, while the latency increases relatively faster. This is because the PM hardware is nearly at its peak at this time. When the batch size is greater than 90, the throughput of the system does not increase but decreases. This is mainly because the large batch causes ROR blocking, which in turn affects the write throughput.
Impact of the thread number: In the experiment, the batch size is fixed to 50, and the number of threads is changed from 1 to 64. The results in Figure 17 (b) show that when the number of threads increases from 1 to 16, its throughput increases linearly. When the number of threads is greater than 16, the performance growth is relatively slow. For example, when the number of threads increases from 16 to 64, the throughput increases by 1.1 times, but the P99 latency increases by 2.9 times. This is mainly due to increased competition for access to PM hardware from concurrent writes by more threads. In practice, we need to select the appropriate number of threads and batch size based on the specific hardware devices and workload.

Figure 18 Evaluation results of global index
In the experiment, the compaction from level 0 to level 1 is disabled to evaluate the advantage of GI over out-of-order level 0 of XS. XS-PM means putting the level 0 and WAL of the baseline system into PM. In the experiment, first, we randomly write KV pairs of different sizes, ranging from 64 bytes to 4 KB and totaling 50 GB. Then, we test the performance of random point read and range query. Figure 18 (a) shows that XP is better than XS and XS-PM in terms of random write of KV pairs of different sizes. In (b) and (c) of Figure 18, XP has a huge improvement over XS and XS-PM. Its random read performance is 113 times higher than that of XS-PM, and the performance of random range query is 21 times higher than that of XS-PM. This is mainly because the compaction from level 0 to level 1 is disabled in the experiment, which causes level 0 to accumulate too many out-of-order data blocks (over 58 out-of-order data blocks are observed in the experiment). GI in XP is globally ordered, so it has high query performance.
Another experiment uses 32 client threads to write data under a high-pressure read-write ratio of 1:1. It lasts for 10 minutes, and the change of system performance with time is recorded. Figure 18 (d) shows that XP has a performance improvement of up to 15 times compared with XS/XS-PM, and its performance is more stable. In the experiment, the performance of XS and XS-PM decreased by 85%, while that of XP only decreased by 35%. Although XS-PM put data in faster PM (used as a normal disk), its performance still lags far behind XP. Data accumulation in level 0 still has a great impact. XP adopts globally ordered GI and more efficient in-memory compaction, which greatly reduces the impact of data accumulation in level 0.
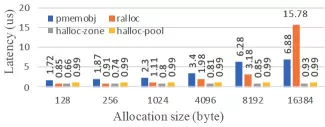
Figure 19 Halloc evaluation results
This experiment evaluates the persistent memory allocation performance of Halloc by comparing Ralloc with pmemobj. Halloc hosts the management of non-persistent memory into jemalloc, so its performance is similar to that of similar methods. You can check reference [4] to learn more about the performance of allocators that use PM as non-persistent memory. The experiment was run with a single thread, and the latency of a single allocation was calculated by performing memory allocation 1 million times. The size of the allocated object ranged from 128 bytes to 16 KB. Since Halloc is not a general memory allocator, the experiment simulated the malloc operation of general memory allocation by allocating from the object pool (Halloc-pool) and by using grant (Halloc-zone), respectively. Figure 19 shows that the object allocation latency of Halloc-pool and Halloc-zone in all tests is less than 1 μs. It is mainly because Halloc uses only one flush and fence instruction for each allocation. However, Halloc is designed only to support LSM-tree-based systems, and its versatility is not as good as Ralloc and pmemobj.
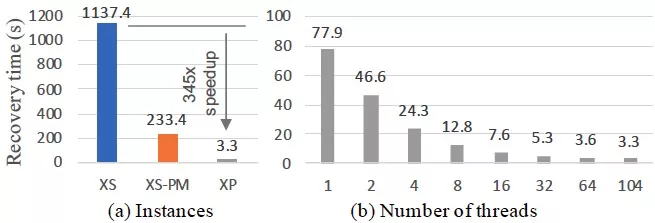
Figure 20 Performance evaluation of restart and recovery
In order to evaluate the recovery performance of the system, 32 GB of data is written in the experiment. The size of key and value is 8 bytes and 500 bytes, respectively, totaling 70 million KV pairs. In the experiment, GI uses a non-persistent index and keeps all the data in GI. The non-persistent GI makes it necessary to restore all indexes in the GI when the system restarts, so it means we need to restore a memory table of 32 GB. For baseline systems XS and XS-PM (WAL placed in PM), the system disables flush, thus ensuring at least 32 GB of valid WAL. Since XP can rebuild indexes in parallel, the number of recovery threads set in the experiment gradually increases from 1 to 104 (equal to all CPU cores). Figure 20 shows that XP can be started within seconds by rebuilding indexes in parallel. However, both XS and XS-PM take several minutes to start. One major reason is that the baseline system only supports single-thread recovery. Since XP can be recovered in parallel, all CPU resources can be used to speed up system startup. In practical scenarios, the size of a memory table is usually much smaller than 32 GB, so the recovery time can be less than one second. The rapid database recovery may change the existing scheme of achieving HA through primary/secondary databases. Then we may be able to reduce ECS instances by half as backup nodes are not needed.
This article is only a small step forward in exploring new hardware such as PM and optimization of LSM-tree-based OLTP storage engine. In fact, the implementation of a usable industrial storage engine involves many aspects such as reliability, availability, stability, and cost performance. It is more of a process of balancing many factors. As for the scheme talked about in this article, the following problems have to be solved before actual industrial implementation.
• Data reliability. For database systems, data reliability is extremely important. Although PM can provide persistent byte addressing capability, it still has problems that affect data reliability, such as device write wear and hardware failure. In on-cloud database instances, the traditional persistent storage layer implements data storage with high reliability through multiple replicas and distributed consensus protocols. Therefore, this problem still needs to be solved when PM is used for persistent storage. One possible solution is to build a highly reliable distributed persistent memory pool based on PM. However, we still need to find out how to design a distributed PM memory pool and what I/O features it may have. For industrial implementation, it may not be of great significance to optimize persistent indexes for standalone PM hardware in OLTP storage engines.
• PM usage efficiency. PM can be used for persistence purposes as well as non-persistence purposes. However, under a fixed PM capacity, we need to determine the memory space to be allocated for persistence and non-persistence purposes. This is a problem worthy of further exploration. For example, the allocation ratio of space is automatically adjusted according to the load. More PM memory is allocated for persistent storage in a write-intensive load, and more memory is allocated for non-persistent purposes such as cache in a read-intensive load.
• Performance jitter. For LSM-tree-based storage engines, the performance jitter issue is a pain point. An important reason for jitter is the severe cache batch failure caused by background compaction. In distributed scenarios, this problem can be alleviated through the smart cache [5]. For standalone machines, is it possible to temporarily cache the old data of compaction by allocating a separate cache space in PM and then slowly perform cache replacement?
[1] J. Yang, J. Kim, M. Hoseinzadeh, J. Izraelevitz, and S. Swanson, “An empirical guide to the behavior and use of scalable persistent memory,” in Proceedings of the 18th USENIX Conference on File and Storage Technologies (FAST '20), 2020, pp. 169–182.
[2] B. Daase, L. J. Bollmeier, L. Benson, and T. Rabl, “Maximizing Persistent Memory Bandwidth Utilization for OLAP Workloads,” Sigmod, no. 1, p. 13, 2021.
[3] G. Huang et al., “X-Engine: An optimized storage engine for large-scale e-commerce transaction processing,” in Proceedings of the ACM SIGMOD International Conference on Management of Data, Jun. 2019, pp. 651–665.
[4] D. Waddington, M. Kunitomi, C. Dickey, S. Rao, A. Abboud, and J. Tran, “Evaluation of intel 3D-Xpoint NVDIMM technology for memory-intensive genomic workloads,” in ACM International Conference Proceeding Series, Sep. 2019, pp. 277–287.
[5] M. Y. Ahmad and B. Kemme, “Compaction management in distributed keyvalue datastores,” Proc. VLDB Endow., vol. 8, no. 8, pp. 850–861, 2015.
ApsaraDB - June 7, 2022
ApsaraDB - December 21, 2022
ApsaraDB - April 13, 2020
ApsaraDB - December 26, 2023
ApsaraDB - November 17, 2020
Alibaba Clouder - November 6, 2018
 PolarDB for PostgreSQL
Alibaba Cloud PolarDB for PostgreSQL is an in-house relational database service 100% compatible with PostgreSQL and highly compatible with the Oracle syntax.
Learn More PolarDB for Xscale
Alibaba Cloud PolarDB for Xscale (PolarDB-X) is a cloud-native high-performance distributed database service independently developed by Alibaba Cloud.
Learn More PolarDB for MySQL
Alibaba Cloud PolarDB for MySQL is a cloud-native relational database service 100% compatible with MySQL.
Learn More Database for FinTech Solution
Leverage cloud-native database solutions dedicated for FinTech.
Learn MoreMore Posts by ApsaraDB