By System O&M SIG

CentOS has announced the end of life (EOL) for the CentOS Linux project. Both enterprises and individual users face problems, including CentOS updates, maintenance, and migration. It is inefficient while you carry out the migration manually, for the reason that the migration process cannot be standardized, and in-place migration cannot be implemented. It will also consume plenty of manpower and resources. So, it is impractical to migrate systems manually. It is imperative to achieve one-stop migration assessment, migration implementation, and post-migration optimization through tools.
Based on this, OpenAnolis launched SysOM 2.0, an automated O&M platform centered around operating system migration and O&M. The architecture and core features of version 2.0 have been upgraded. There are three core capabilities: operating system migration, upgraded diagnostic center, and overall architecture upgrade. SysOM 2.0 provides complete migration capabilities, which include migration assessment, migration tools, comparison of pre-migration with post-migration, and system optimization, ensuring a closed loop of operating system management from migration to O&M. For migration scenarios, SysOM 2.0 also enriches related features in existing modules (such as the monitoring center and diagnostic center), improving the O&M experience of the operating system.
After CentOS stops service, are you still worried about what, whether or how to change the system, and whether the system will go wrong after changing it? The new Operating System Migration feature of SysOM 2.0 can give you the answer. SysOM 2.0 allows you to migrate all versions of operating systems from CentOS 7 and CentOS 8 to Anolis OS 7 and Anolis OS 8, providing users with a simple and visualized interface to complete one-stop migration.
The features of the operating system migration module in SysOM 2.0 include migration assessment and migration implementation. It supports in-place migration and batch migration to solve the problem that the number of user machines is too large to rotate. It supports diagnostic analysis and system tuning for system exceptions after migration.
Migration Assessment: Before migration, the automatic migration assessment feature allows users to understand the compatibility of the Anolis OS with the original system after migration (such as software compatibility and hardware compatibility). In addition, detailed compatibility reports are provided for users to make informed decisions before the subsequent migration to Anolis OS.
Migration assessment features include:
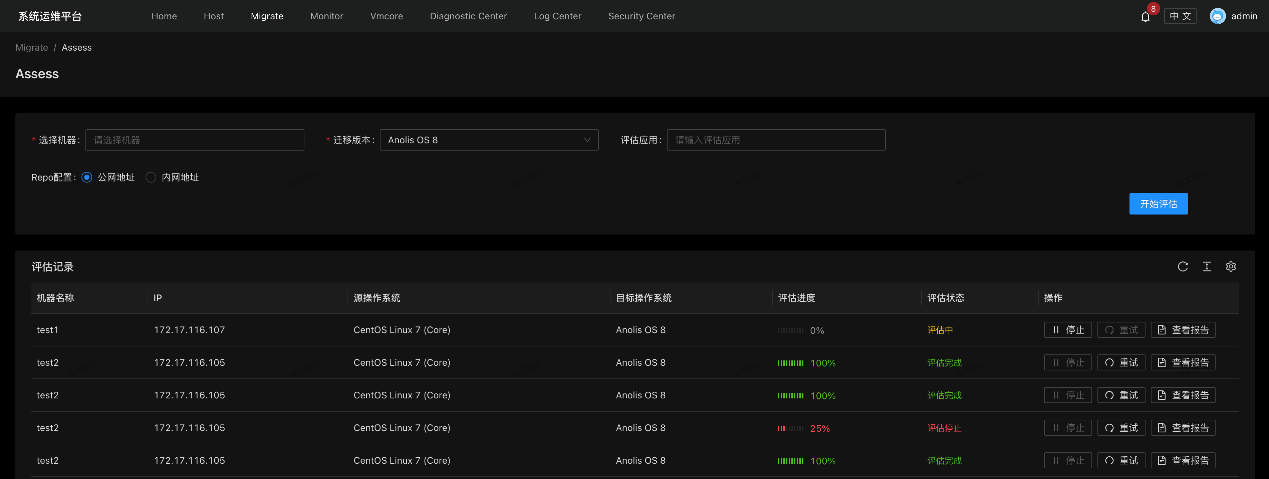
Figure: Migration Assessment
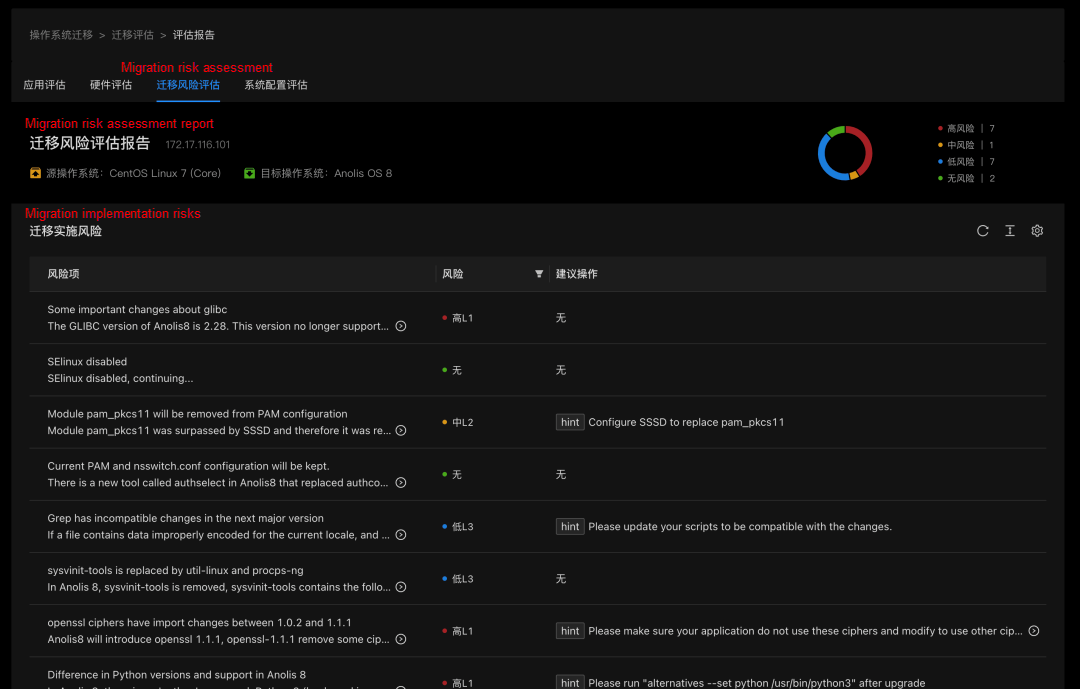
Figure: Migration Assessment Report
Migration Implementation: After completing the migration assessment, you can complete the system migration through the interface operation of migration implementation. You can perform a system backup in advance through the interface to avoid failure or unexpected migration results during the migration process. The migration implementation feature supports standalone migration, batch migration, one-step migration, one-click migration, backup restoration, and offline migration.
The migration implementation process includes the following:
If you have backed up the system, you can use the system restore feature to restore the current system to the unmigrated state at any time.
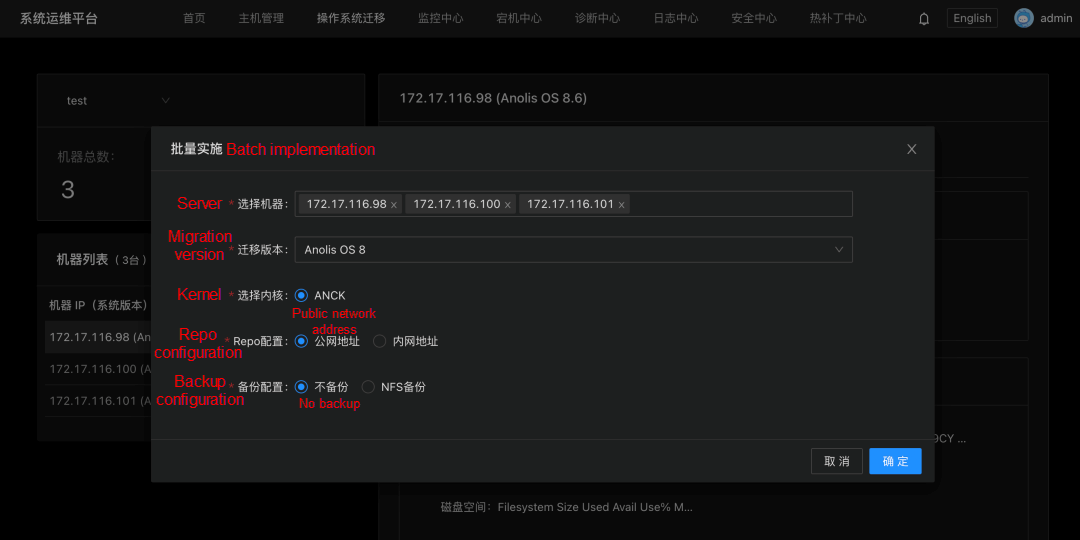
Figure: Batch Migration Implementation
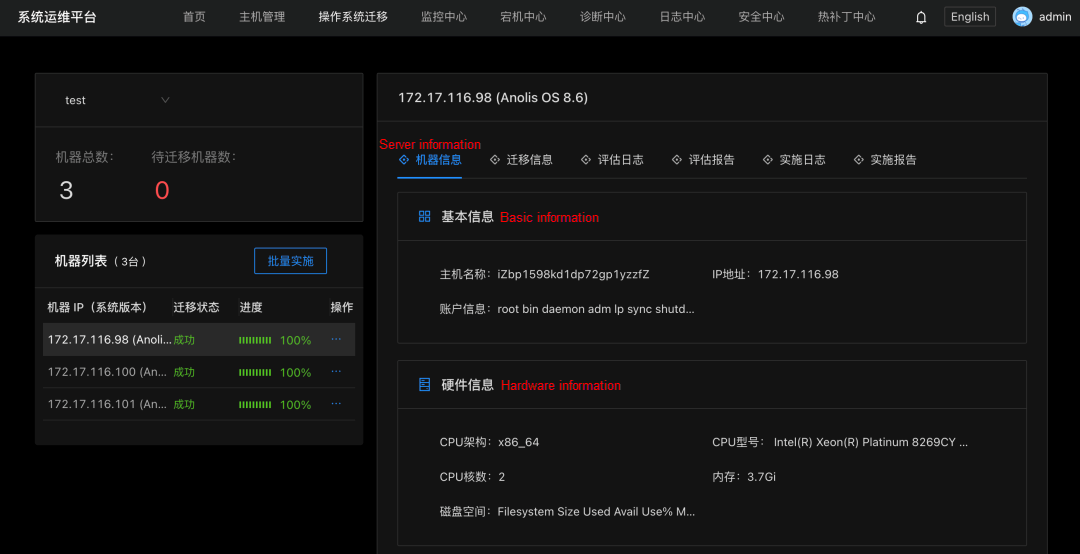
Figure: Migration Implementation
SysOM 2.0 has a new monitoring report feature. This feature collects and visualizes the total resource usage, basic metric trends, and metric fluctuations of the system before and after the migration. This allows you to visualize the changes in the operating system before and after the migration. At the same time, by running a test task for a period of time before and after the migration, you can get an intuitive comparison of the performance of the actual business running on the two operating systems.
Migration monitoring visualizes the changes and trends of common resources used before and after the migration. You can visually compare the changes in system resources before and after the migration.
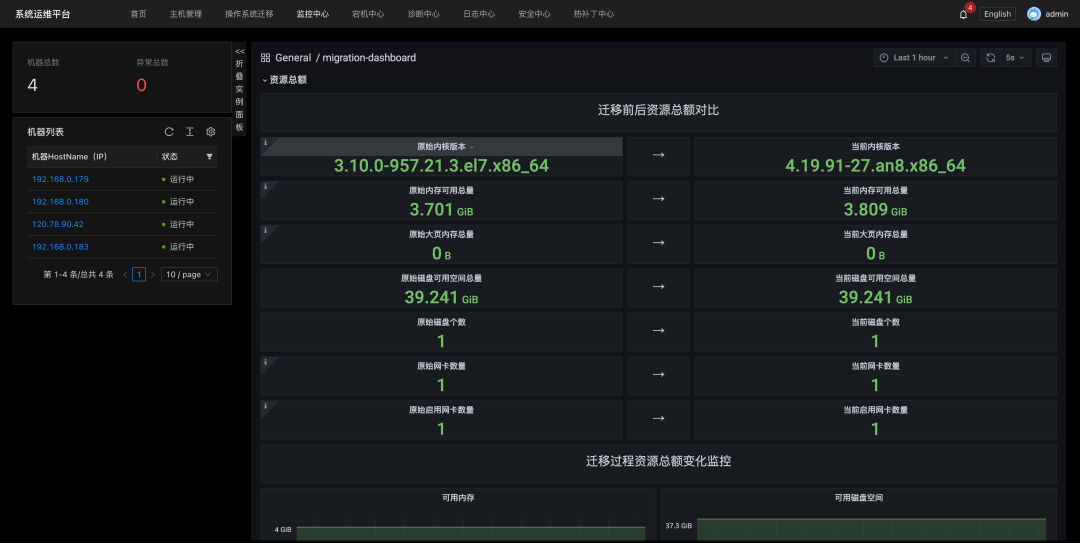
Figure: Migration Monitoring
At the same time, migration monitoring monitors common metrics (CPU, memory, network, I/O, and disk) and visualizes the real-time value, change trend, and fluctuation range of each metric. You can visually compare the fluctuation of each metric in the time dimension before and after the migration.
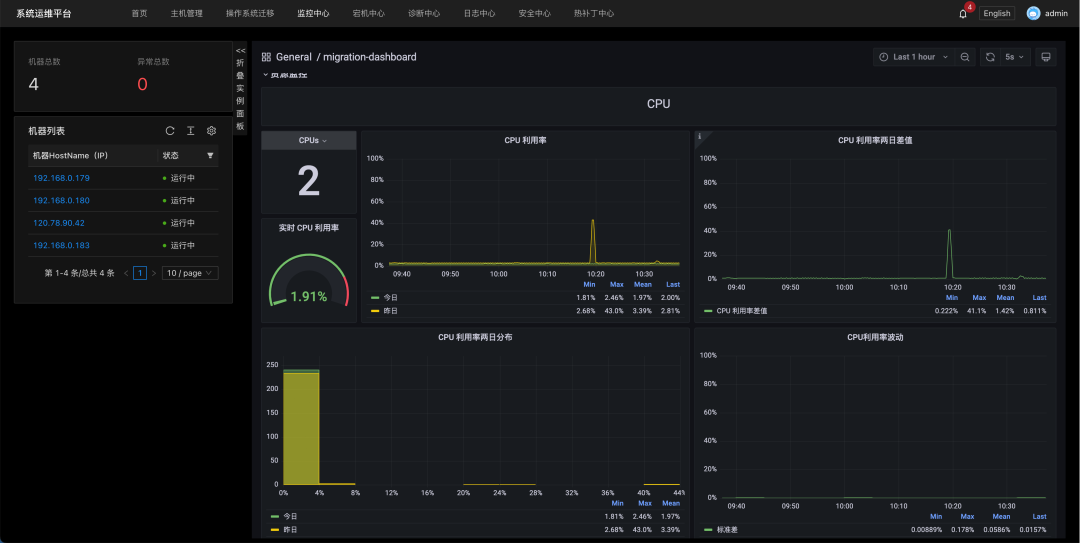
Figure: Basic Monitoring
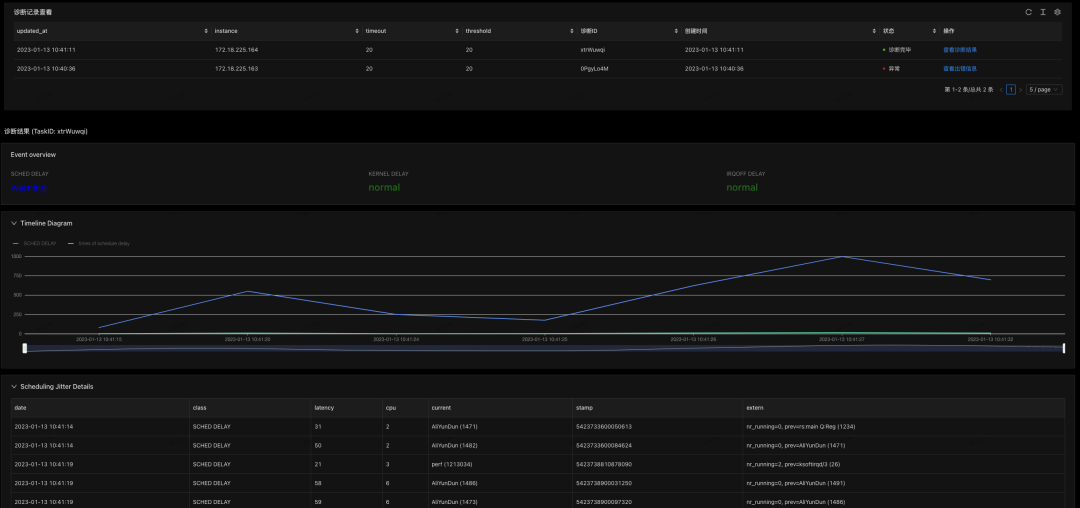
SysOM 2.0 provides a comprehensive diagnosis of scheduling, storage, network, and memory to help operating system users troubleshoot and locate problems in a comprehensive manner. New diagnostic features include scheduling jitter diagnosis, I/O latency analysis, I/O hang diagnosis, network packet loss diagnosis, network jitter diagnosis, network retransmission diagnosis, Cache analysis, Out of Memory (OOM) diagnosis, and the support for custom command sending.
Scheduling Jitter Diagnosis: In system O&M scenarios, if the CPU runs in the sys mode for a long time, the programs in the user mode cannot be scheduled. If interrupts are disabled for a long time, the CPU cannot receive TICK interrupts normally, causing scheduling jitter. These two cases are often accompanied by sudden scheduling latency in the business process or even transient system hangs. Scheduling jitter records the time point at which the scheduling jitter occurs, the number of occurrences, and the specific value of the jitter to help users better locate the problems that occur in this scenario.
I/O Latency Analysis: High I/O latency generally indicates I/O performance bottlenecks (such as excessive I/O traffic, backlogs, storage device bottlenecks, storage device anomalies, OS storage stack anomalies, etc.), resulting in slow processing of I/O requests and high IO latency. It monitors the historical I/O latency level of each storage device and counts the number of times the I/O latency deviates from the historical latency level per minute. This helps you quickly locate at which level the IO latency is consumed the most, which is easy to locate problems.
I/O Traffic Analysis: If the system I/O traffic is too high and the disk I/O is full, it is easy to cause competition for I/O resources, and user processes with I/O requirements may be blocked. This situation generally means I/O resources have not been properly allocated, causing some processes to occupy a large amount of I/O resources beyond expectations. I/O traffic analysis monitors the I/O resources (such as IOPS and throughput) usage of each storage device at the process level and can analyze the process with the largest resource usage to facilitate problem location.
I/O Hang Diagnosis: I/O hang is a disaster for the system. It is important to detect the I/O hang, switch I/O traffic to normal storage devices in time, and isolate abnormal storage devices. This monitoring item monitors whether there is I/O hang problem on the I/O access path of each storage device of the system.
Network Packet Loss Diagnosis: Packet loss diagnosis monitors and records packet loss events, hardware or network interface card devices that lose packets, packet loss points and times, and causes of packet loss. This helps diagnose and locate network packet loss problems.
Network Jitter Diagnosis: Jitter diagnosis supports the ICMP packet. It consists of two parts. One part is the message time delay of the ping initiator (the path of sending messages). The other part is the message time delay of the ping receiver (the path of receiving messages).
Network Retransmission Diagnosis: Retransmission diagnosis records the retransmission time, IP, TCP socket status, and congestion status to help you understand the occurrence of network retransmission.
Cache Analysis in Memory: You can use the cache analysis feature to resolve the files corresponding to the file cache and shared memory in the system or within containers and container groups (as well as the percentage of active and inactive file caches).
OOM Diagnosis: OOM is a common exception in the production environment. When an OOM occurs, it is accompanied by a large number of kernel logs, which are often difficult to analyze. This diagnosis helps locate OOM caused by improper settings (such as memory leaks, cpuset, and mempolicy in system cgroups).
Command Diagnosis: Considering there are various scenarios when O&M personnel diagnose problems, and these scenarios may not be accurately covered by some of SysOM's existing diagnostic features, a new command diagnosis feature has been introduced to support users to input the commands they need as they normally do in the terminal. Then, they can view the returned results.
The SysOM 1.0 architecture is suitable for deploying full functions on a single machine. It can integrate powerful O&M functions (such as host management, host monitoring, host diagnosis, downtime analysis, and security detection) with one click. As SysOM has been implemented in multiple scenarios and the popularity of the open-source community has increased, new features and growth in management scale have posed new demands on SysOM's architectural design.
In order to address the requirements above, SysOM 2.0 upgraded the overall architecture design to enable the platform to deploy and access new services more flexibly and quickly.
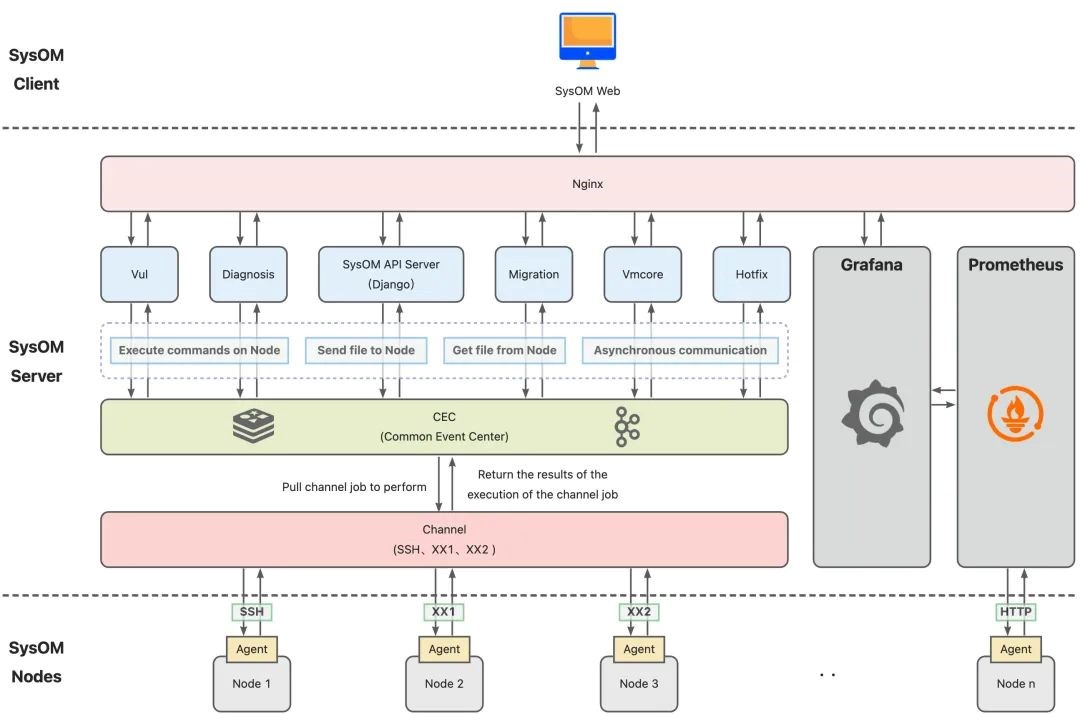
Figure: SysOM 2.0 Architecture
Download the rpm package:
wget https://gitee.com/anolis/sysom/releases/download/v2.0/sysom-2.0-1.an8.x86_64.rpmInstall the rpm package:
rpm -ivh sysom-2.0-1.an8.x86_64.rpm
# or yum install -y sysom-2.0-1.an8.x86_64.rpm/usr/local/sysom.export SERVER_PORT=xxx.ip -4 route command and can be configured by export SERVER_LOCAL_IP=xxx.xxx.xxx.xxx.Start:
# Run the following command to start:
bash -x /usr/local/sysom/init_scripts/server/init.sh
If the following log is generated by Log Service, the deployment is successful:
Oct 10 12:58:51 mfeng bash[3217754]: /usr/local/sysom/init_scripts/server
Oct 10 12:58:51 mfeng bash[3217754]: + for dir in `ls`
Oct 10 12:58:51 mfeng bash[3217754]: + '[' -d init.sh ']'
Oct 10 12:58:51 mfeng bash[3217754]: + for dir in `ls`
Oct 10 12:58:51 mfeng bash[3217754]: + '[' -d stop.sh ']'
Oct 10 12:58:51 mfeng bash[3217754]: + sed -i 's/^FIRST_INIT_DONE=0/FIRST_INIT_DONE=1/g'     /usr/local/sysom/init_scripts/server/init.sh
Access through the WEB frontend:
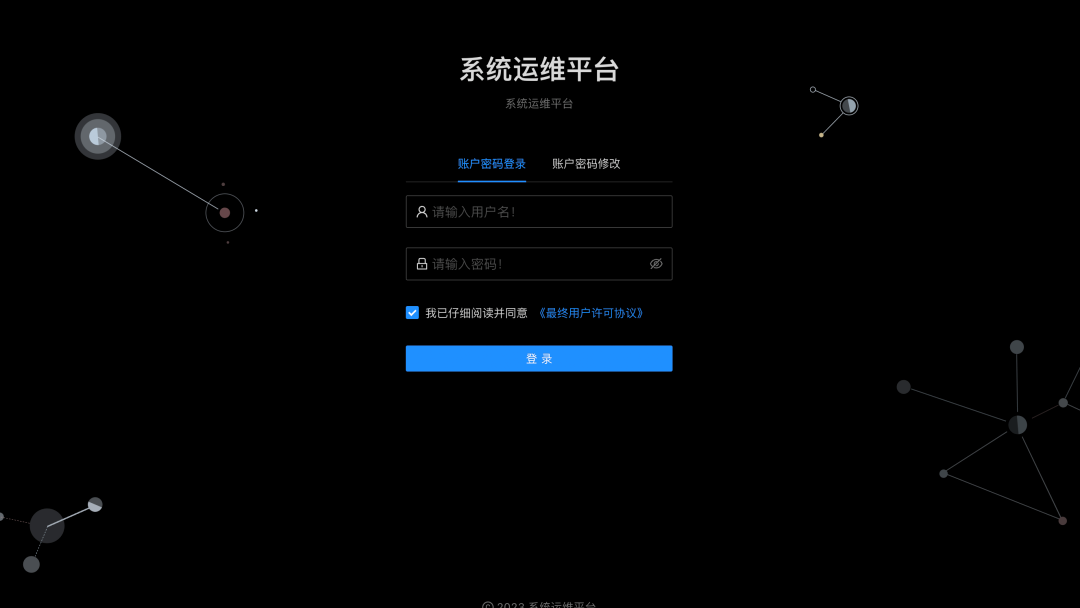
After the deployment is successful, you can access the SysOM frontend by accessing the public or private network IP address specified during deployment (such as http://172.22.3.238).
Default username and password: admin/123456
SysOM provides a Demo website (In Chinese): http://sysom.openanolis.cn/
An Analysis of the Exploration and Practice of Python Startup Acceleration

99 posts | 6 followers
FollowOpenAnolis - January 24, 2024
Alibaba Cloud Community - September 23, 2022
OpenAnolis - January 21, 2025
OpenAnolis - September 21, 2022
OpenAnolis - September 4, 2025
OpenAnolis - June 25, 2025

99 posts | 6 followers
Follow Bastionhost
A unified, efficient, and secure platform that provides cloud-based O&M, access control, and operation audit.
Learn More Cloud Migration Solution
Secure and easy solutions for moving you workloads to the cloud
Learn More Managed Service for Grafana
Managed Service for Grafana displays a large amount of data in real time to provide an overview of business and O&M monitoring.
Learn More Database Migration Solution
Migrating to fully managed cloud databases brings a host of benefits including scalability, reliability, and cost efficiency.
Learn MoreMore Posts by OpenAnolis