By Zhenmu, from Alibaba Cloud Storage Team
With the popularity of cloud-native applications and microservices, observability design has become a fundamental capability requirement for an online service. In this article, we will explore the foundation of the Tiangang project to understand the observability design and practice around key observability pillars, namely logs and indicators, using Tracing Analysis. We will also deep-dive into the five key steps to implement observability in the project.
Note: Examples provided in this article applies to Spring Boot 2.x.
Firstly, we need to know whether our application instance is still alive. Then we need to check whether the process is still there. We must also check whether the application instance can provide external services if the process is intact. Therefore, the health check result includes liveness and readiness. The readiness state contains the application services readiness and the external components readiness. The actuator has built-in dependency checks for common external dependencies such as DataSource and Redis and does not have built-in support for external dependencies. You can use custom Healthlndicators to access.
curl -Li http://localhost:8080/actuator/health
HTTP/1.1 200
Content-Type: application/vnd.spring-boot.actuator.v3+json
Transfer-Encoding: chunked
Date: Fri, 05 Nov 2021 03:37:54 GMT

{"status":"UP","components":{"db":{"status":"UP","details":{"database":"MySQL","validationQuery":"isValid()"}},"diskSpace":{"status":"UP","details":{"total":494384795648,"free":372947439616,"threshold":10485760,"exists":true}},"livenessState":{"status":"UP"},"ping":{"status":"UP"},"readinessState":{"status":"UP"}}}%
Through health check interfaces, both container and non-container environments can cooperate with load balancing or probes of Kubernetes to automatically isolate the traffic of unavailable instances. Apart from the Spring Boot framework, the health check interface should be able to support developers or external systems to determine the state of liveness and readiness quickly. Health checks that do not cover these two aspects are meaningless. In addition, we can use the HTTP plug-in to collect the data to Log Service to set alerts.
When the application meets the basic living condition, we need to know how our application lives and whether there are potential risks. Just as humans' quality of life depends on the social environment, food, and body health, the same holds for applications. Take Java as an example. We first need to consider the physical resources status of the host or container in the environment where the application resides. Then we need to consider the basic components such as CPU, memory, disk, and network, followed by JVM-related operation indicators, and finally, the application's business-related indicators.
For host monitoring, Tiangang uses Logtail's built-in host monitoring capability and stores it in the time series storage of SLS. In addition to host monitoring, JVM and application business metrics monitoring use the Prometheus specification. By integrating with a micrometer, JVM-related monitoring metrics can be output by default. We can use custom metrics to collect data for metrics that Spring Boot doesn't support, such as the database connection pool status of druid and the status of the http client connection pool. To provide a unified monitoring index system for each service, the metrics of these common components are managed through the two-party library of spring-starter. The existing and new services can be seamlessly integrated into a unified monitoring index system. For business-type metrics, the custom metrics method is also applicable.
curl -Li http://localhost:8080/actuator/prometheus
HTTP/1.1 200
Content-Type: text/plain; version=0.0.4;charset=utf-8
Content-Length: 13244
Date: Fri, 05 Nov 2021 06:32:31 GMT

# HELP jdbc_connections_active Current number of active connections that have been allocated from the data source.
# TYPE jdbc_connections_active gauge
jdbc_connections_active{app="aliyun-center",name="dataSource",source="30.1.1.1",} 0.0
# HELP jvm_gc_max_data_size_bytes Max size of long-lived heap memory pool
# TYPE jvm_gc_max_data_size_bytes gauge
jvm_gc_max_data_size_bytes{app="aliyun-center",source="30.1.1.1",} 2.863661056E9
# HELP jdbc_connections_max Maximum number of active connections that can be allocated at the same time.
# TYPE jdbc_connections_max gauge
jdbc_connections_max{app="aliyun-center",name="dataSource",source="30.1.1.1",} 8.0
# HELP process_cpu_usage The "recent cpu usage" for the Java Virtual Machine process
# TYPE process_cpu_usage gauge
process_cpu_usage{app="aliyun-center",source="30.1.1.1",} 0.0012296864771536287
# HELP system_load_average_1m The sum of the number of runnable entities queued to available processors and the number of runnable entities running on the available processors averaged over a while
# TYPE system_load_average_1m gauge
system_load_average_1m{app="aliyun-center",source="30.1.1.1",} 3.7958984375
The new version of Logtail provides built-in collection capabilities for Prometheus monitoring metrics to collect and store application monitoring metrics. For more information, see Access Prometheus Monitoring Data through the Logtail Plug-in.
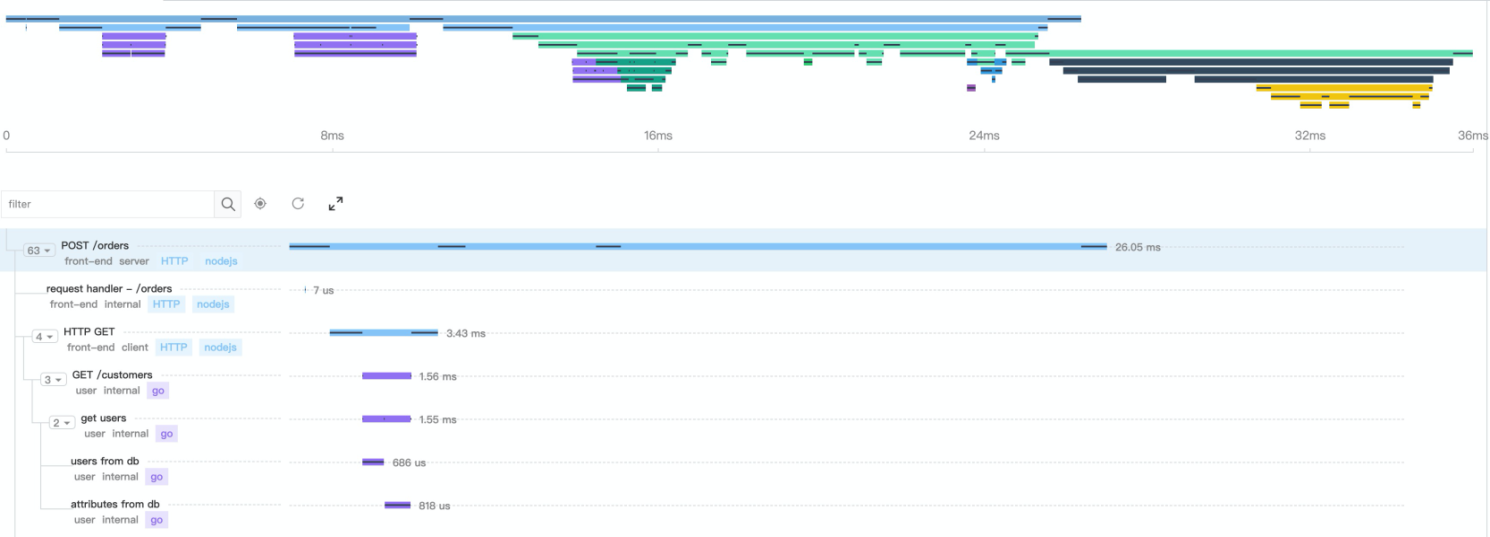
However, minor problems are inevitable even if you pay attention to daily health checks and maintenance. There may be severe potential risks behind a minor problem. Here, Tracing Analysis helps quickly troubleshoot and locate problems, thus eliminating the potential risks.
In the Tiangang project, we use the SkyWalking Agent to collect and report trace data. For more information about installation and configuration, see Use SkyWalking to Report Java Application Data .

SkyWalking generates a unique trace ID for each request. We can use the trace ID to view the complete call trace and determine the actual location of the problem.
Generally, all calls of cloud products are accessible through POP APIs. When users feedback problems, they usually provide the RequestId information when an error is reported in their feedback. The challenges to be addressed in log relevance are finding the call trace quickly through RequestId or discovering the RequestId through the call trace.
Our application is an all-time running system. This system records its running status and runtime information as logs every second. We need useful information from the records to locate root causes when problems occur. Therefore, the logs need relevance and must be associated with a specific event or process. Collecting logs is necessary (usually determined by the external O&M environment), and finding log relevance is more important.
We can ensure log relevance with RequestId. With the MDC mechanism of logback, we only need to inject RequestId into MDC at an appropriate position to ensure that the logs generated by the current request have fixed identities:
@Override
public boolean preHandle(HttpServletRequest request, HttpServletResponse response, Object handler)
throws Exception {
    String requestId = request.getHeader(TBS_REQUEST_ID);
    if (!Strings.isNullOrEmpty(requestId)) {
        MDC.put("requestID", requestId);
    }
    return true;
}
SkyWalking has built-in integration with logback, enabling it to inject traceId information into MDC automatically. We just need to introduce dependencies:
<dependency>
  <groupId>org.apache.skywalking</groupId>
  <artifactId>apm-toolkit-logback-1.x</artifactId>
  <version>8.5.0</version>
</dependency>
Then we need to print in the logback configuration:
<property name="FILE_LOG_PATTERN"
              value="[%X{tid}] %d{yyyy-MM-dd HH:mm:ss.SSS} %-5level [%X{requestID}] %logger{36}:%line [%thread] - %msg%n"/>
<!--省略的其-->
<encoder class="ch.qos.logback.core.encoder.LayoutWrappingEncoder">
  <layout class="org.apache.skywalking.apm.toolkit.log.logback.v1.x.mdc.TraceIdMDCPatternLogbackLayout">
    <pattern>${LOG_PATTERN}</pattern>
  </layout>
</encoder>
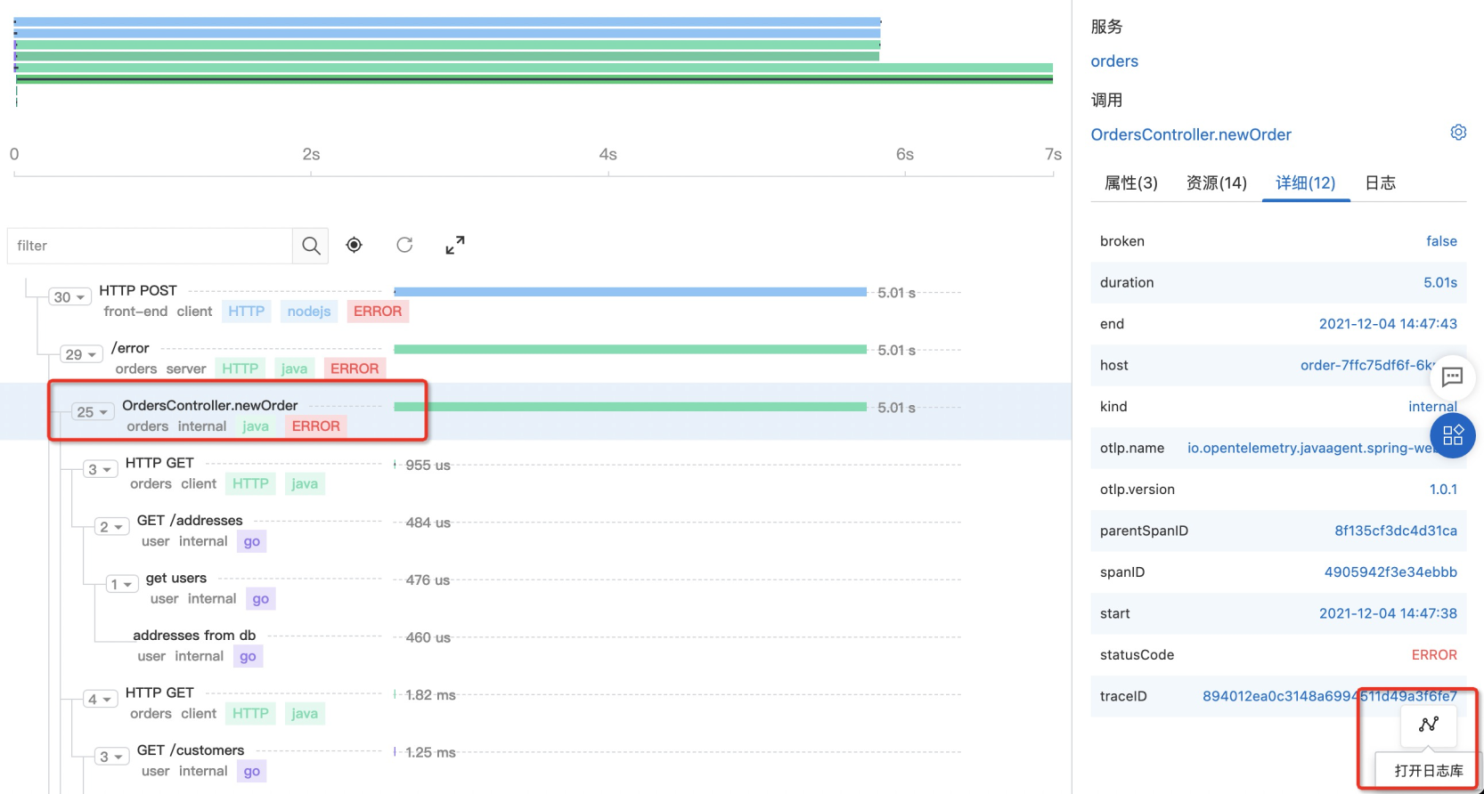
After completing the log relevance configuration, we can proactively discover slow request traces and use trace IDs to find log records to perform problem analysis. We can also troubleshoot problems online by finding the call trace according to the RequestId, delimit problems, and find relevant logs for analysis.

Trace association log

Log association trace
So far, to realize observability, we have built the health check interface, the metrics interface of Prometheus, and the SkyWalking Agent in the application. We also use log relevance policies to correlate businesses and traces to help us quickly locate and analyze problems. The last step in observability, of course, is to build the visual dashboard. SLS time series storage provides a standard Prometheus interface. Therefore, we can add SLS time series storage as a Prometheus data source to Grafana and use Grafana for visualization.

The dashboard should be iterative. We use Git to manage the visual dashboard in the spirit of everything as code.
.
├── README.md
├── docker-compose.yaml
└── grafana
    ├── config.monitoring
    ├── dashboards
    │   ├── app
    │   │   └── jvm-micrometer.json # jvm jvm monitoring packaging
    │   └── server
    │       └── hosts.json # host monitoring the dashboard
    └── provisioning # Initialize
        ├── dashboards
        │   └── dashboard.yaml # dashboard configuration
        └── datasources
└── datasource.yaml # datasource configurationObservability, like a key, allows us to open the application's black box so that we can see the operation of applications all the time. It also helps us locate and analyze problems faster through external performance (monitoring indicators) and internal status (traces and logs).
Digital Transformation and the Future of Finance – Tech for Innovation

1,344 posts | 470 followers
FollowAlibaba Cloud Native Community - March 18, 2025
Alibaba Cloud Native Community - April 29, 2024
Alibaba Cloud Native Community - September 11, 2024
Alibaba Cloud Native Community - August 12, 2025
Alibaba Cloud Native Community - April 15, 2025
Alibaba Clouder - November 23, 2020

1,344 posts | 470 followers
Follow Managed Service for Grafana
Managed Service for Grafana displays a large amount of data in real time to provide an overview of business and O&M monitoring.
Learn More Bastionhost
A unified, efficient, and secure platform that provides cloud-based O&M, access control, and operation audit.
Learn More Simple Log Service
An all-in-one service for log-type data
Learn More Storage Capacity Unit
Plan and optimize your storage budget with flexible storage services
Learn MoreMore Posts by Alibaba Cloud Community